Leaderboard


Popular Content
Showing content with the highest reputation on 04/02/18 in all areas
-
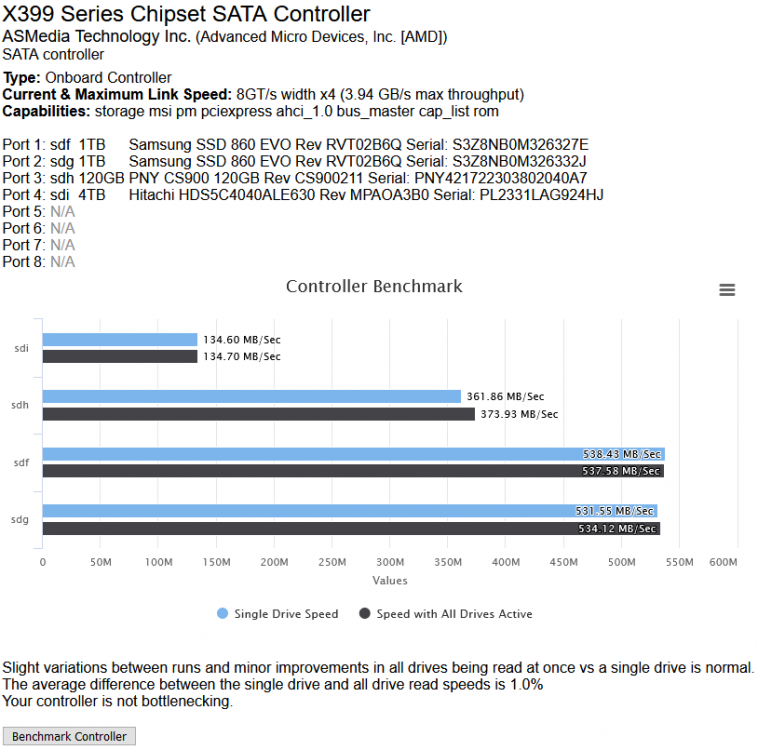
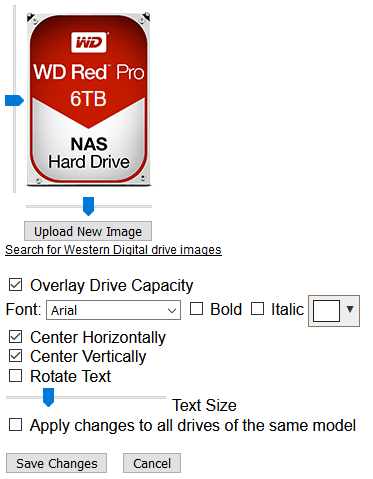
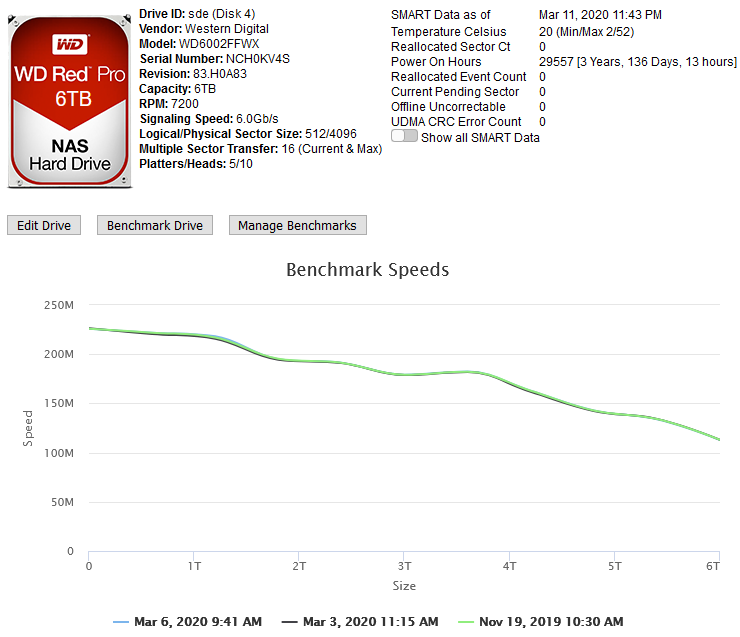
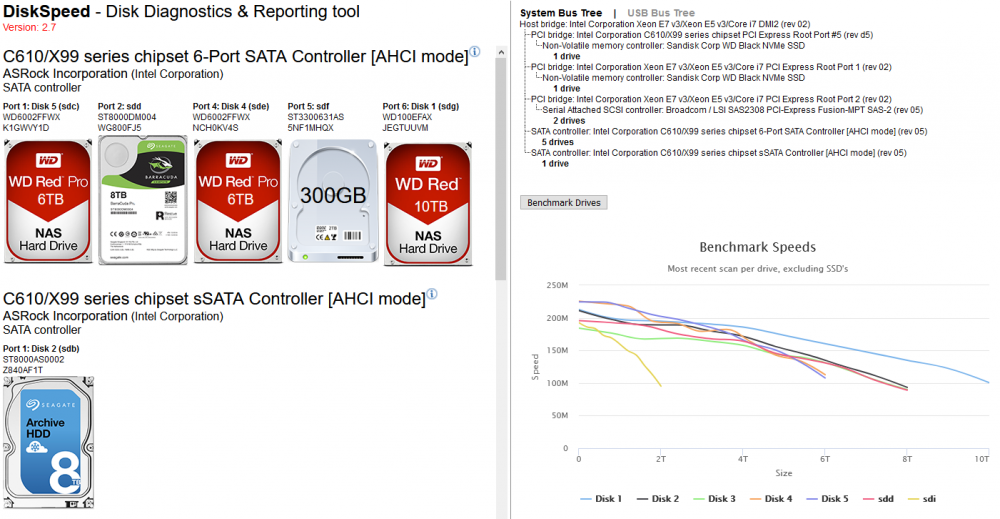
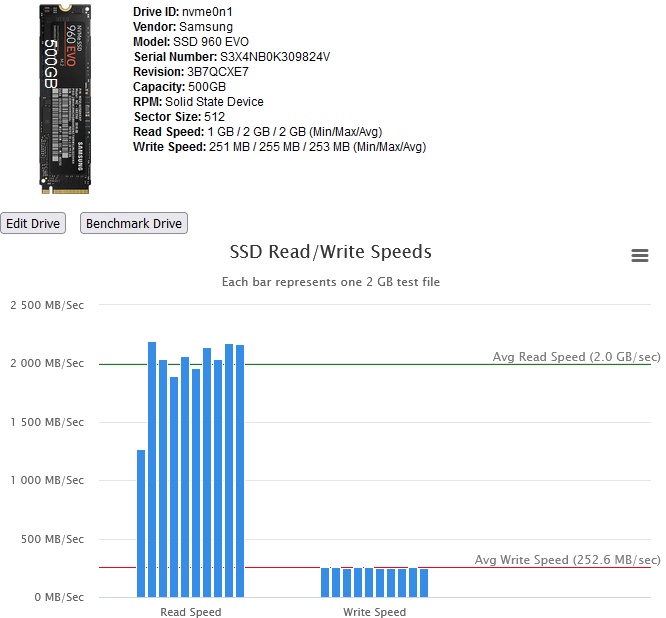
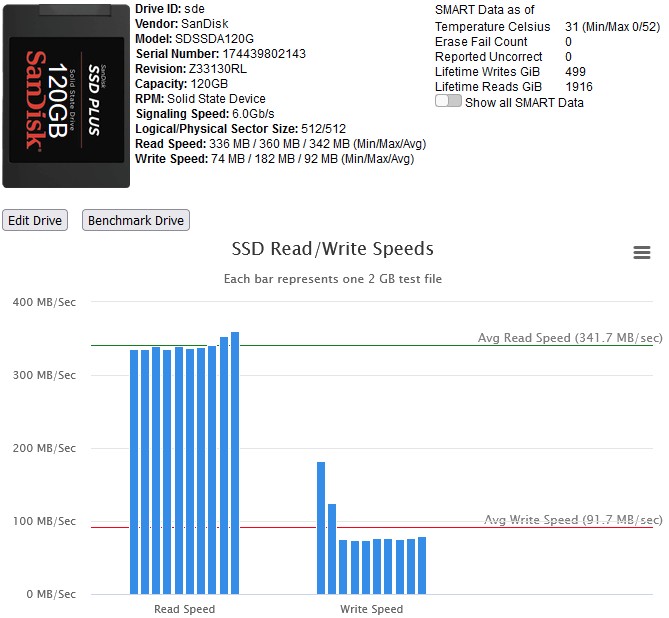
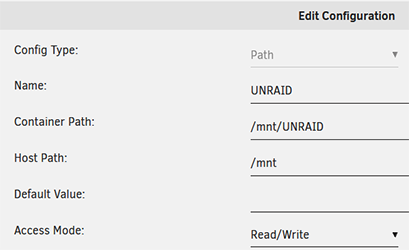
This Docker Application will let you view your storage controllers & the drives attached to them and perform Benchmarks on both. Controller Benchmarks helps to identify if the drives attached to it will potentially exceed the capacity of the controller if they were all fully being read from at the same time (such as during a Parity check). Drive Benchmarks lets you monitor the performance over time to look for desegregation or unexpected slow areas while getting a clean SMART report. Installation Via the Community Application: Search for "DiskSpeed" Manual Installation (The Community Applications plugin is having issues currently, here's a work around for now) Save the attached "my-DiskSpeed.xml" file to your NAS under \\tower\flash\config\plugins\dockerMan\templates-user View the Docker tab in your unRAID Administrator , click on "Add Container" Under "Select a template", pick "my-DiskSpeed" The defaults should work as-is unless you have port 18888 already in use. If so, change the Web Port & WebUI settings to a new port number. The Docker will create a directory called "DiskSpeed" in your appdata directory to hold persistent data. Note: Privileged mode is required so that the application can see the controllers & drives on the host OS. This docker will use up to 512MB of RAM. RAM optimization will happen in a later BETA. Running View the Docker tab in your unRAID Administrator and click on the icon next to "DiskSpeed" and select WebUI. Drive Images As of this December 2022, the Hard Drive Database (HDDB) has 3,000+ drive models in 70+ brands. If you have one or more drives that do not have a predefined image in the HDDB, you have a couple options available - wait for me to add the image which will be displayed after you click "Rescan Controllers" or you can add the drive yourself by editing it and uploading a drive image for it. You can view drive images in the HDDB to see if there's an image that'll fit your drive and optionally upload it so others can benefit. Controller & Drive Identification Issues Some drives, notably SSD's, do not reveal the Vendor correctly or at all. If you view the Drive information and it has the same value for the vendor as the model or an incorrect or missing Vendor, please inform me so that I can manually add the drive to the database or add code to handle it. If you have a controller that is not detected, please notify me. Benchmarking Drives Disk Drives with platters are benchmarked by reading the drive at certain percentages for 15 seconds and averages the speed for each second except for the first 2 seconds which tends to trend high. Since drives can be accessed while testing, if a min/max read speed exceeds a threshold, the test is re-performed with an increasing threshold to account for drives with bad areas. Solid State drives are benchmarked by writing large files to the device and then reading them back. In order to benchmark SSD's, they must be mounted in UNRAID and a mapping configured in the DiskSpeed Docker settings. You must restart the DiskSpeed app after mounting a device for it to be detected. For other Docker installations, an example is -v '/mnt':'/mnt/Host':'rw' if you have all your SSD's mounted under /mnt. You may need more than one volume parameter if they are mounted in different areas. Contributing to the Hard Drive Database If you have a drive that doesn't have information in the Hard Drive Database other than the model or you've performed benchmark tests, a button will be displayed at the bottom of the page labeled "Upload Drive & Benchmark Data to the Hard Drive Database". The HDDB will display information given up by the OS for the drives and the average speed graphs for comparison. Application Errors If you get an error message, please post the error here and the steps you took to cause it to happen. There will be a long string of java diagnostics after the error message (java stack) that you do not need to include, just the error message details. If you can't get past the Scanning Hardware screen, change the URL from http://[ip]:[port]/ScanControllers.cfm to http://[ip]:[port]/isolated/CreateDebugInfo.cfm and hit enter. Note: The unRAID diagnostic file doesn't provide any help. If submitting a diagnostic file, please use the link at the bottom of the controllers in the Diskspeed GUI. Home Screen (click top label to return to this screen) Controller Information Drive Information While the system cache is bypassed when benchmarking, some devices have a built-in cache that ignores cache bypass commands. An initial high write speed that quickly levels out is a sign of such as shown below. Drive Editor my-DiskSpeed.xml
 3 points
 -
Hi Guys. After many requests I have made a tutorial for setting up a docker container for pi-hole. This gives us network wide adblocking. Hope you find it useful1 point
-
Worked great for me in legacy using Safari. Took about 40 seconds.1 point
-
Never in my wildest dreams did I think that people were going to have problems with Legacy Mode downloads timing out on 6.4+ (I usually go by the assumption that everyone's hardware and internet connection is better than mine) Nevertheless, the rather extended outage by Digital Ocean accelerated the need to slightly revamp how Legacy Mode downloads are handled. There is now basically zero chance that niginx (unRaid) will ever timeout when switching to Legacy Mode. Tested on Chrome, Edge, IE, Firefox. Can someone running Safari go to CA's settings, enable developer mode, then hit Legacy Mode and confirm that it also works. (You'll see the pop up individually download the various repositories instead of just the spinning wheel) Other notable changes In the event of an appfeed failure, CA will check for and display an applicable "Public Service Announcement" that will state if I know the feed is definitively down. Appfeed download failure screen is more obvious that if nothing is wrong with your network settings to go to legacy mode. Various PHP warnings that could have appeared when displaying stats on a appfeed failure without switching to Legacy Mode have been suppressed. Download timeouts have been lowered from 60 seconds to 45. All new installs of CA now require you to actually accept the disclaimer before using the plugin.1 point
-
Onboard SATA controllers aren't being detected. I'll add code to pack up the saved data files so I can see exactly what you see and troubleshoot.1 point
-
We're back in business1 point
-
I'm really happy that some issues got reported and brought to developers attention. HOWEVER Please stop using the Announcement topic to report issues. We're doing the best we can to make it easy to report issues right here in this forum. It is simply too hard to track this stuff if otherwise. My next step is to lock these announce topics and force people to create issue reports. The next step after that is to forget about the forum and use Bugzilla or Mantis. We have resisted that because if forces people to create multiple accounts which means more effort. We have found the best way to find out about issues is to make it as dirt simple as possible to report them. But I have to draw the line here: don't report bugs in the announcement posts.1 point
-
............ and for the record Nobody here would ever consider this funny at your expense. We've all lost Data due to some kind of dumbness of our own doing and it really sucks. I'd personally recommend after you survive this look into installing the Recycle Bin Plugin. Its saved my Bacon many times.1 point
-
The first call trace: Mar 31 06:43:17 Tower kernel: BUG: unable to handle kernel NULL pointer dereference at 0000000000000038 is unrelated to the second one (and xfs_repair), it's a kernel bug fixed on rc3, the second one was filesystem corruption and should be fine now after running xfs_repair.1 point
-
Yep, there's another one related to a kernel problem, fixed in rc31 point
-
This is the way docker version 12.09.1 displays stat information. A newer docker version is planned after more testing is done, scheduled for the moment for 6.6. Run the following: docker stats $(docker ps --format='{{.Names}}') CONTAINER CPU % MEM USAGE / LIMIT MEM % NET I/O BLOCK I/O PIDS cAdvisor 4.49% 62.41MiB / 125.9GiB 0.05% 936B / 0B 43.9MB / 0B 44 Netdata 1.82% 117.4MiB / 125.9GiB 0.09% 3.69kB / 0B 99.6MB / 0B 22 Emby 0.00% 72.8MiB / 125.9GiB 0.06% 613kB / 1.97MB 162MB / 19.3MB 16 Heimdall 0.00% 23.98MiB / 125.9GiB 0.02% 3.99kB / 3.35kB 3.11MB / 139kB 14 Tautulli 0.15% 75.05MiB / 125.9GiB 0.06% 0B / 0B 44.6MB / 139kB 20 HandBrake 0.24% 282.4MiB / 125.9GiB 0.22% 3.69kB / 0B 270MB / 279kB 70 Unifi 0.76% 658.8MiB / 125.9GiB 0.51% 9.41MB / 925kB 363MB / 95.5MB 909 Plex 0.11% 185.1MiB / 125.9GiB 0.14% 2.49MB / 551kB 151MB / 1.09MB 48 Nginx 0.02% 36.5MiB / 125.9GiB 0.03% 321kB / 0B 44.6MB / 139kB 25 Pi-hole 0.03% 43.48MiB / 125.9GiB 0.03% 2.72MB / 599kB 104MB / 86MB 22 Tonido 0.03% 21.11MiB / 125.9GiB 0.02% 380kB / 1.85MB 55.7MB / 2.92MB 28 Or, and select which columns to display (example below has all columns) docker stats --format='table {{.Name}}\t{{.CPUPerc}}\t{{.MemUsage}}\t{{.MemPerc}}\t{{.NetIO}}\t{{.BlockIO}}\t{{.PIDs}}'1 point
-
No, a regression error. Fixed in next release. Thanks for reporting.1 point
-
The first disk is detected just fine. The second one is seen briefly and then lost. The SATA port is reset to a slower speed and then disabled. The fault is either the port, the cable or the drive electronics. Change the SATA cable (again) and check the power to the disk (again).1 point
-
To restart nginx i've been having to use both /etc/rc.d/rc.nginx restart and /etc/rc.d/rc.nginx stop Quite often checking its status will show its still running. So make sure it's really closed. It doesn't want to close gracefully /etc/rc.d/rc.nginx status Running 6.5.1rc3 for around 12hours now, but my system is still under 50%. I think I need to be starting new dockers, checking app store using dockerhub etc before I see the memory grow. Will see how the next day or two goes.1 point
-
Still down for me. Good thing I read this first before hacking things apart.1 point
-
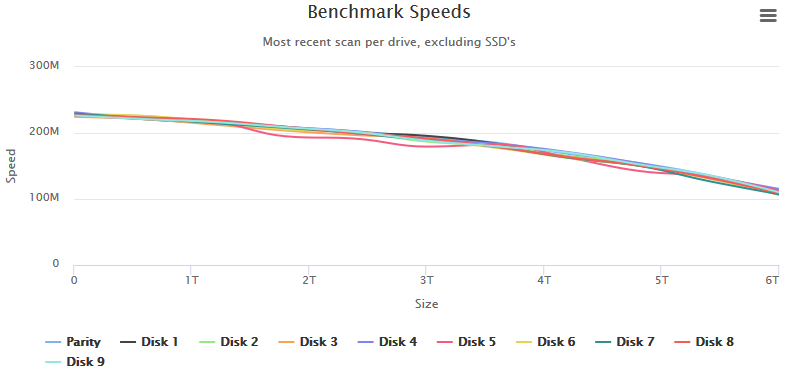
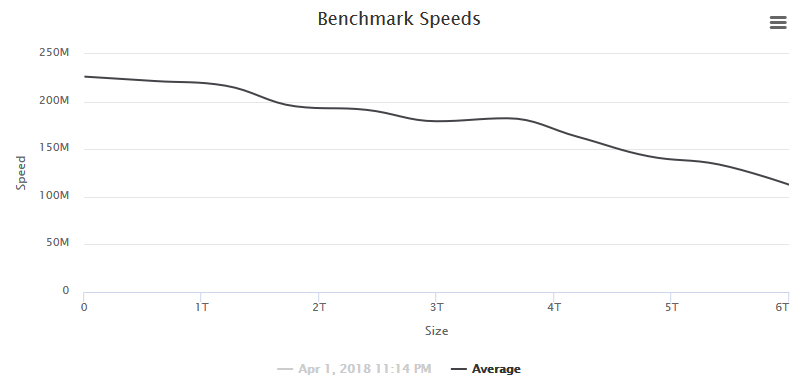
When I tested this utility against my production server, I noticed that I had a drive going wonky on me. I couldn't even test it at first because it kept tripping the SpeedGap detection in which the minimum & maximum speed over 15 seconds was too great - a sign of disk activity or in my case, a drive giving very inconsistent read speeds. I had to add logic to disable the SpeedGap detection to even be able to fully test the drive. In this case, the drives are all the same make & revision and their curve should be nearly identical but Disk 5 stands out. Viewing Drive 5 by itself, I can see it's curve is not normal. Spinners should have a steady decline over the entire range of the drive. I'll be retiring this drive from my main server and using it for platter heat map test where the entire drive is read and a heatmap of the read speeds given.
 1 point
 -
Your time limit is when another of your disks fails. Parity does not have the ability to rebuild any drive on its own. To do that you need parity and all the other disks to be perfectly readable. You can however continue to write to the array, including the missing disk as its contents are emulated. The safest thing to do in your position is to shut down your server until you have a spare disk available but you can continue to use it if you need to, as long as you understand and accept the risk.1 point
-
You can last as long as the other drives remain valid. If we know exactly how long that was, we'd buy lottery tickets and retire off the winnings.1 point
-
1 point
-
I still get nginx-related errors in Safe Mode. Details and diagnostics here. UPDATE: The parity check completed successfully but my syslog has many nginx-related errors. Latest diagnostics here.1 point
-
Did you try the support thread for Community Applications? Looks like this has been discussed recently.1 point
-
Most likely, you want to optimize your share settings, e.g., avoid using most free, so that files don't go to multiple disks simultaneously.1 point
-
Reconstruct write just removes the read/modify/write step which means it can give a very high bandwidth when you write to one data disk. But when you write to two data disks, then each of the writes represents a specific LBA that needs to be processed on all disks (write for the specific data disk and the parity disk(s) and read for the other data disks). Since the two writes to different disks will affect different LBA, that means the parity disk(s) will have to perform a large number of seek to jump between the two different locations that parity needs to be updated. It's the same result you get as if you try to read and write two different files from a single data disk - the total bandwidth will be a small fraction of the bandwidth you can get for a single file because of all the seek latencies - the time spent seeking is time then disk will not do any read or write so the bandwidth will drop very sharply.1 point
-
The GUI is tightly integrated since unRAID 6.0, but it was decided not to offer separate standalone GUI updates anymore, these are now always coming with any new unRAID versions, which nowadays are updated frequently.1 point
-
Two that would have been previously listed were Dynamix WebUI and unRaid OS. The webUI is tightly integrated with the OS and is no longer a separate plugin. The OS "plugin" has been moved to Tools - UpdateOS1 point
-
i just mount 3 ssd drives to the cache pool and run the balance option -dconvert=raid5 -mconvert=raid1 so far everything works as expected and have had no problems1 point