Leaderboard


Popular Content
Showing content with the highest reputation on 08/27/19 in all areas
-
Here is my attempt. Just started down this road and am still within the trial and am waiting for my first disc to preclear. I was able to remove the graphic with the help of SpaceInvaderOne, but no luck in removing the pesky version text. Would LOVE to have it on the right somewhere with all of the pertinent data. Would love to change all of the text everywhere to the blue hex I've chosen here. A couple more additions on the Display Settings page would be great!
 2 points
 -
Could someone please link a walk-through or provide the steps to do this roll back function mentioned above?1 point
-
Hello guys and girls I‘m right now building my first server and I‘m not so sure about the os for it. I consider unraid primarely for one feature: the possability to integrate new HDD‘s easly in the system. Now what do I want to do with the Server. First and foremost it will be a server for Plex but I also want a Ts3 Server on it and maybe later on some TTT (gaming) Server too. Can I do all these things with unraid? Will my hardware be enough? Right now I don‘t want to compress the movies, it will all be on Lan, maybe later on I will open the server for my family to watch movies over the internet. Hardware: i5 4600 8GB DDR3 Ram no GPU for now 3x 8TB WD Red1 point
-
Remove the line with this stuff in it. Just delete it from the xml. <topology sockets='1' cores='2' threads='2'/>1 point
-
Ok, don’t listen to me. Seeing how I’ve run OS X on an 80 core 4 processor machine at the max 64 allowed.... The problem is OS X only recognizes certain topologies and won’t boot if its not within those parameters. Soo... yes, it’s a topology issue. Remove topology and you can do 3, 33, whatever. The added bonus is OS X will utilize threads as single cores for greater performance. For further reading see or, you know, don’t.1 point
-
Looks like the latest Plex update broke the settings page. Plex Plug-in [com.plexapp.system]: error while loading shared libraries: libpython2.7.so.1.0: cannot open shared object file: No such file or directory Running Binhex/arch-plexpass 1.16.6.1559-1-01. All settings pages display "Server settings are unavailable." However, the server itself works. Plex.tv is aware.1 point
-
Edit config/ident.cfg on the flash drive and change USE_SSL from "yes" to "no", then reboot.1 point
-
remove your topology from the xml, then you can go up to 641 point
-
i am having a very frustrating issue, which is now beyond my limited knowledge of Unraid and Plex.. So yesterday I decided to update Unraid (from 6.5 to 6.7.2), and Plex (linuxserver version) to the newest version. After that have had a whole host of issues, mainly with Plex which seemed to have corrupted the libraries for Movies & TV shows, making them unavailable and not possible to view via Plex GUI, or a respective player. After hours of trying to get it to work (and searching online), I decided to delete the docker, and rename the Appdata folder, installing the binhex version (all new). I thought it was strange on loading binhex that it gave my user details straight away (as not sure where it pulled it from), and on loading it, its saying that the server is not accessible and wont let me add any meedia to the library. Is there somewhere else I need to delete old plex data, as its doing my head in **UPDATE** OK looks like its the current plex version thats broken (both Linuxserver & binhex), and rolling back the binhex version is working.. Time to rebuild the library....1 point
-
I am currently away on holiday so this will have to wait until I'm back on Sunday, for now please roll back to the previous working tagged version. Sent from my CLT-L09 using Tapatalk1 point
-
Assum.ng you have a folder called 'isos' on the nvme drive then from the Unraid command line use a command of the form: ln -s /mnt/disks/nvmename/isos /mnt/user/isos/nvme_isos (where nvmename is what the nvme drive is called in the UD plugin) should result in what looks like a folder called 'nvme_isos' inside the 'isos' share that contains the contents of the 'isos' folder on the nvme drive and that you can get to via the GUI. I have not actually tried this but it shows what I am thinking.1 point
-
Most flash drives (and the BIOS's I've used -> new to very old) are detected as a hard drive. Set the hard drive as first boot and under BBS priorities hopefully you see the flash there1 point
-
Just discovered this tonight. Got my account created. Installed the docker on my main machine & got it authorized. Installed a client on my Android phone & got it authorized. Installed the docker on my backup server & got it authorized. I can connect to the WebGUI of my main server from my phone with WiFi turned off no problem! I do have to use the ZT IP address to access it, but I often have issues accessing my server internally via name instead of IP, so I'm not too concerned about that. I cannot browse the server with Astro (an Android file manager app) like I used to, but I don't think that's ZeroTier's fault - I haven't been able to do that for months. (Must find new file manager app.) Also, I cannot access the servier via ControlR or get nzb360 to connect even though both will work just fine via openVPN. I have a test Duplicati backup running to my backup server via an Unassigned Devices share. Now I just need to get the server off-site and test it out that way! Probably took me 30 minutes including playing around with Astro and submitting an issue to them about the network browsing not working. All-in-all a successful evening I'm probably going to come up with a different backup solution than Duplicati, but otherwise, I'm feeling 100% with what I've got right now. Thanks for making this available, @Dmitry Spikhalskiy!1 point
-
Suffice it to say, it's a sore subject. Been discussed to death in the forums. Caused many issues, created many arguments. First rule of unifi thread, don't mention unifi updates. We love unifi hardware, hate unifi half done updates that break great hardware.1 point
-
In theory, yes. So containerization is different than virtualization in several ways. On Linux this has some big benefits. For example, on a Linux OS devices are populated into a filesystem we call "sysfs" Sysfs nodes exist for every single sensor, switch, and register for every single device that is found and initialized. As such, your GPU also becomes a SYSFS node, and all of it's features become exposed through SYSFS as well. With a virtual machine, we "remove" the card from the host OS and "install" that card into the guest OS. In a containerized environment, specifically in docker, sysfs nodes can exist on both "machines" simultaneously. The application, driver, et al aren't any wiser about the existence of the other OS, and the card exists in both at the same time. As far as the card is concerned (and nvidia-smi for that matter), two processes on the same system are using the same card at the same time. Which is perfectly acceptable. In theory you could use it on both Plex and Emby at the same time with a 2 transcode limited card - but any more than 1 transcode at a time on either would result in broken transcoding on the other. Not a desirable situation. I have successfully had the card in use with 3 "operating systems" at the same time: - Unraid (I spawned a fake xorg server on a 'virtual display' running at 640x480 so I could run nvidia-settings over ssh) - The LS.IO Plex docker - netdata1 point
-
I added code to invalidate a test result if a drive gives a 10% or greater improvement in speeds over it's single-drive speed.1 point
-
Dockers are not virtual machines and the nvidia container runtime should support multiple dockers using the same card's resources. Know that if both of these cards require access to the transcoding pipeline you may run into problems, especially if you have a card that isn't licensed for more than 2 simultaneous transcode processes.1 point
-
UTT does not do any writes, only reads. Specifically, it applies a combination of tunables parameters, then initiates a non-correcting (read only) parity check, let's it run for 5 or 10 minutes (depending upon the test length you chose), then aborts the parity check. It then tries the next set of values and repeats. I believe dalben's report might be the very first time a drive failure has been reported during testing. UTT v4 works the same basic way as the previous versions, so there's years of data behind that statement. In theory, the tests that UTT performs are no more strenuous then a regular parity check. But anytime you spin up and use your hard drives, especially all of them at once generating max possible heat, you risk a drive failure - same as during a parity check. Some may feel that the stress is slightly harder than a parity check, as UTT keeps repeating the first 5/10 minutes of the parity check, for dozens of times (minimum 82 times, maximum 139 times), so it keeps all of your drives spinning at their fastest/hottest for the entire test period, unlike a true parity check that would allow smaller drives to complete and spin down as larger drives continue the check. But the stress should be less than hard drive bench-marking, especially tests that do random small file reads/writes and generate lots of head movement.1 point
-
I am currently doing the same, (except I'm using GRE over IPSEC as my routers don't have OpenVPN UDP support) and have linked 3 sites together. Do note that the overall speed for file transfer (and the latency!) will be determined by the Unraid servers' upload speed, your download speed and the VPS upload + download. If you are not on CGNAT (as I am) it might be possible to have your routers connect to each other directly (as i did before CGNAT was implemented) Haven't tried getting a seedbox so not sure what you can cannot run on it.1 point
-
I can answer the last part... no, you don't have to set Tunables to default before using the tool. The first test is performed using "current". It then takes a peek at "default". Only then does it start probing the possible values that may affect the performance. If you want to set the values back to Default at any time, simply go to the Disk Settings page and delete the value in the fields that say "User Defined" and hit Apply. It will automatically reset them to Default for you.1 point
-
Do you have a link to the hotfix info? Have had issues with 4K playback on my Samsung TV and wonder if they are finally getting around to fixing it. Edit: Nevermind, I think I've found it. Looks to be a recent issue that cropped up in past few days in a server update. My issue is much older and this doesn't seem like it addresses it. Edit2: Btw, it looks like the fix for the issue @showstopper is talking about has been pushed to Plex Pass users, so restart the container and it should pick it up - v1.16.5.1554-1e5ff713d.1 point
-
It seems I may have found the root cause. The power I used to connect to the drives that are causing problems came from a molex to sata splitter because I don't have enough sata power. When I connected the Molex from the PSU and the Molex from this splitter, I may have not connected them securely. Though there's power, it seems whatever drive I'm connecting to it is encountering problems. I've changed Sata cables, connected to onboard ports. I've changed to other onboard ports also, until I finally looked at this sata power issue. I tried to secure the 2 molex sides properly, and so far, I've finished my parity rebuilding, I've attached other drives to this same power connector, and performed heavy transfers using Unbalance plugin, so far so good. Never would have suspected this if I didn't ran out of other things to troubleshoot already.
 1 point
 -
My background is in tech stuff; maybe I should start dabbling in emergency medicine as stress relief from all the drama I deal with daily. How does one go about picking up emergency medicine as a hobby? ?1 point
-
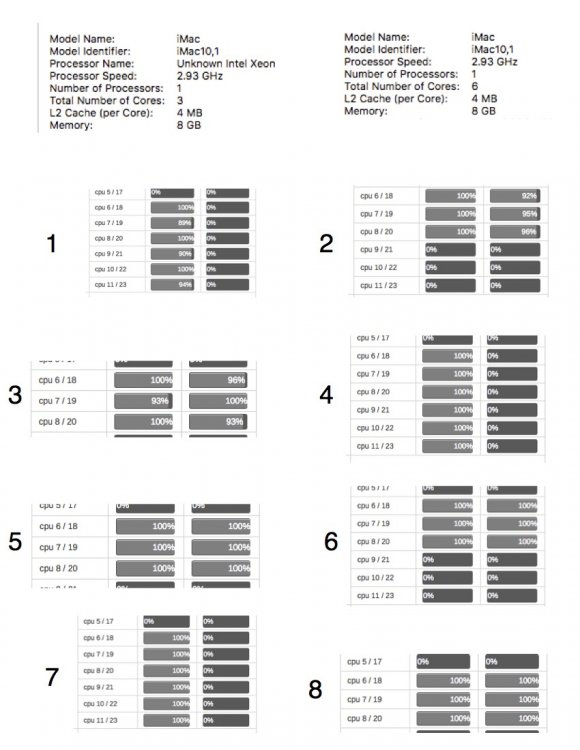
-WARNING - LONG POST- I had a project cancel this am, so I was able to do get to this a little sooner than expected. And since this got long, I decided to remove it from the OS X sierra install thread and give the discussion its own space. I believe I realized why topology settings did not affect performance before in my testing a few months ago. I tested topology settings on a windows vm. And as I discuss later, you’ll see why I thought it did nothing (spoiler: it really doesn’t…) The following tests were completed to determine optimal cpu performance settings in relation to cpu pinning and topology in os x. There were not done to test lag, video/audio responsiveness, or any other element. For the previous tests in the sierra install discussion, no topology was ever defined for the vm. So for these tests, I swapped to using the Linux xml that gridrunner provided which defines topology. And there were some noticeable changes between showing the vm either a grouping of individual single thread cores vs cores with a virtual hyper-threading processor, and an interesting revelation about os x in virtual environments. SO, on to the scores! Note: no tests were done with audio/video Modified Linux xml (previous tests were modified Ubuntu xml) 8GB ram Cinebench R15 Same fresh copy of un-updated os x emulator pin 1-2 All set to host passthrough Proc 2 isolated from unRaid CPU Thread Pairings Proc 1 cpu 0 <===> cpu 12 cpu 1 <===> cpu 13 cpu 2 <===> cpu 14 cpu 3 <===> cpu 15 cpu 4 <===> cpu 16 cpu 5 <===> cpu 17 Proc 2 cpu 6 <===> cpu 18 cpu 7 <===> cpu 19 cpu 8 <===> cpu 20 cpu 9 <===> cpu 21 cpu 10 <===> cpu 22 cpu 11 <===> cpu 23 (test numbers correlate on the attached image of processor utilization in unRaid) 1. Topology 3 cores:2 threads, processors 6-11 (see image 1) not all cores not utilized to 100% 482 485 486 2.Topology 3 cores :2 threads, processors 6,18 7,19 8, 20 (HT Pairs on physical cpus) same issue, vm HT cores not pushed to 100% utilization 351 350 350 3. Topology 3 cores :2 threads, processors 6, 7, 8, 18, 19, 20 (HT Pairs on physical cpu) same issue, HT cores not pushed to 100% utilization 345 351 348 4. Topology 6 cores: 1 thread, processors 6-11, 100% cpu usage 541 535 540 5. Topology 6 cores: 1 thread, processors 6,7,8, 18,19, 20, 100% cpu usage 359 356 360 6. Topology 6 cores: 1 thread, Processors 6,18 7,19 8, 20 (ht Pairs on physical cpu) image 4 100% cpu utilization 360 363 361 and for fun: 7. Topology 2 sockets, 3 cores, 1 threads, processors 6-11, 100% cpu utilization 540 536 542 8. topology 2 sockets, 3 cores, 1 threads, processors 6,18 7,19 8, 20, 100% cpu utilization 365 364 363 ——————— The info you don’t care about - Setting the topology to 2 processors with 3 cores 1 thread each showed no real change in benchmark vs showing the vm 1 processor of 6 cores with 1 thread each. Not that this was ever debated, but I figured it wouldn’t take too long just to see what happens. In any test utilizing HT cores/threaded pairs on a physical processor, scores were consistently lower than using non-paired cores. Not that that was ever in question either, but shows consistency in testing. Now something interesting- Declaring a topology that presents an OS X vm a hyper-threaded processor results in degraded performance numbers. This performance loss is not improved regardless if you use only physical cores or physical threaded/HT core pairs. It is continually lower vs. either setting a topology of 6 cores 1 thread, or no topology definition at all (which defaults to 6:1) And I think this is why- Through viewing cpu utilization in unRaid of the cores, and presenting OS X with a virtual HT processor created via topology declaration (3:2), and assigned on 6 physical single thread cores, it displayed that every other core was not achieving 100% utilization. (see image 1.) Even as the core assignment changed to the defined virtual processor (3:2), the degradation of performance on every other core remained (see benchmarks/images 2 &3.) I believe this is because OS X does not push “HT threads” (a second thread on a perceived core) to full utilization. This also means that OS X sees vm HT pairs assigned in horizontal groups, not the vertical rows in the xml as is currently believed to be the case with windows. To achieve os x HT pairing using this method would be defined in xml as <cputune> <vcpupin vcpu='0' cpuset=‘6’/> <vcpupin vcpu='1' cpuset=’18’/> <vcpupin vcpu='2' cpuset=‘7’/> <vcpupin vcpu=‘3’ cpuset=’19’/> <vcpupin vcpu=‘4’ cpuset=‘8’/> <vcpupin vcpu=‘5’ cpuset=’20’/> </cputune> while the windows accepted standard way is <cputune> <vcpupin vcpu='0' cpuset=‘6’/> <vcpupin vcpu='1' cpuset=’7’/> <vcpupin vcpu='2' cpuset=‘8’/> <vcpupin vcpu=‘3’ cpuset=’18’/> <vcpupin vcpu=‘4’ cpuset=‘19’/> <vcpupin vcpu=‘5’ cpuset=’20’/> </cputune> I needed to determine if this behavior was indicative of my hardware, or os x. At this point, I booted up a windows 10 vm and proceeded with the same testing methodology. Windows 10 8GB ram no emulator pin (forgot, but inconsequential for testing reasons) Cinebench R15 host passthrough A. Topology 1 socket, 3 cores, 2 threads, processors 6-11, 100% cpu utilization 535 527 526 B. Topology 1 socket, 6 cores, 1 threads, processors 6-11, 100% cpu utilization 551 549 551 C. Topology 1 socket, 3 cores, 2 threads, processors 6,7,8, 18, 19, 20, (accepted windows pairing) 100% cpu utilization 376 369 368 D. Topology 1 socket, 6 cores, 1 threads, processors 6,7,8, 18, 19, 20, 100% (accepted windows pairing) cpu utilization 368 368 371 E. Topology 1 socket, 3 cores, 2 threads, processors 6,18, 7,19, 8, 20, (os x thread pairing) 100% cpu utilization 365 367 367 F. Topology 1 socket, 6 cores, 1 threads, processors 6,18, 7,19, 8, 20, (os x thread pairing) 100% cpu utilization 367 368 367 Windows testing results were as expected in terms of a vm running 2 threads on 1 core performing less than one using 1 thread per core. Also evident was that Windows does not show the reduction in core utilization regardless of topology declaration (I did not attach images because they all showed the same result.) And as such, I am unable to determine if the HT pairings that windows uses are actually different than OS X. And this may be for good reason. I don’t think virtualized windows cares about HT pairings- When testing topology declaration that would seem to match os x HT pairing (grouped) vs the accepted windows HT pairing (row) the results showed almost no difference, which is also interesting because it implies that windows treats what it believes as paired threads on a physical core being presented to it as the same. This is demonstrated by the close benchmark results that occurred when using the same physical cpus, but topology differences. And if you look at task manger>performance>cpu, it lists a total count of virtual processors, no topology definition. Windows is self aware… So trying to pair threads by defining topology for a windows vm, in terms of performance, is essentially an exercise in futility as you reap no tangible gains vs presenting the vm a grouping of cores. And as the tests showed, even mixing up what could be be considered HT pairs and putting the “wrong” pair together had essentially no change in results (Compare tests C:E, D:F.) How does this relate to os x- Since os x is not optimized for virtual environments, it still “believes” it is on bare metal and tries to compensate accordingly by not forcing 100% cpu usage on what it perceives as the second thread on a physical cpu, since there is no way to achieve 100% utilization of both threaded pairs at the same time. This is demonstrated by tests that use 3 physical cores and 2 threads on each achieving lower scores than 6 physical cores of 1 thread each. Bottom line- Based on these cumulative test results, if you want to maximize os x cpu performance, give it a group of single threaded cpus and don’t present it a virtual processor with HT pairs defined in topology. I would ask anyone else to replicate this process and see if their results match.
 1 point
 -
You need help? We've got lots of helpful people! So take a deep breath, and try to relax. If you are worried about data loss, we can reassure you that it's very rare here. Many problems turn out to be simple issues, like a loose or bad cable or connector. NEW! Try the Fix Common Problems plugin! But first, some guidelines that will both help us help you and help you get the help you need sooner! Almost always, the most important thing you need to do is capture your complete syslog, BEFORE YOU REBOOT! We usually need to see what went wrong BEFORE the reboot, because once you reboot, it's lost! [For Unraid v6.0-rc4 or later] If networking is working, browse to the Unraid webGui, go to the Tools tab, click on the Diagnostics icon, then click on the Download button (Collect button if v6.0). After the diagnostic data collection is complete, it will save a diagnostics zip file to your computer, to the download location you specify or is configured in your browser. This zipped file is ready to attach to a forum post. It contains a copy of your syslog with DOS friendly line endings, copies of SMART reports for all drives present, copies of your system and share config files, and a technical file describing your array, including all of the content on the Main screen. Once you obtain this diagnostic dump file, you can skip the next paragraph because you already have the syslog, and you can skip capturing the SMART reports below, because you already have them too! If networking is not working (and you have Unraid v6.0-rc4 or later), then if you can login at the console command prompt, you can type diagnostics, and you will get the same diagnostics.zip file in the /boot/logs folder. You can then shut down with powerdown and take the flash drive to another computer. [For v6.0-betas through -rc3, OR if you only want the syslog] If networking is working, browse to the Unraid webGui, go to the Tools tab, click on the Syslog icon, then click on the Download button. (Prior to v6.0-beta15, it's at the bottom.) After clicking the Download button, it will save syslog.zip to your computer, which is a zipped file containing syslog.txt, which is a copy of your syslog with DOS friendly line endings. The zip file is ready to attach to a forum post. (Since syslogs are highly compressible, we appreciate them being attached as zip files!) If no network, then you will have to capture the syslog from your server console. Please see Capturing your syslog, and use the 'All Unraid versions' method. Move the flash drive containing the syslog to your workstation, where you can attach it to a support post. Is it a problem with a hard drive? Then we will probably need to see a SMART report for each drive giving errors. If you don't have the diagnostic dump file from above, please do so via Tools-> Diagnostics, and make sure each SMART report is available to be attached with the syslog. In some problem cases, a drive is not responsive, so you cannot request a SMART report until AFTER rebooting. Just remember to get that syslog before you reboot! Time to create a new support topic! A new one please, don't hijack someone else's topic. Browse to the unRAID forums, and go to the General Support board in the unRAID V6 section, or other board as appropriate, such as Docker, KVM, hardware build, etc. (Make sure you did not go to the General Support board in the v5 section!) Click on the New Topic button in the upper right. Enter a descriptive subject that summarizes the problem. Remember, we have seen a lot of problems, many very similar, so your subject should try to be a little different. First, tell us the exact version of Unraid, the plugins and addons you have loaded, and what hardware you are using. You can tell us about your hardware either here in the post, or in your signature. Now describe the problem, what exactly goes wrong, what errors you saw (exact words please!), what you were doing at the time, what steps you have taken to fix it, anything that helps us fully understand the problem. The sooner we understand what the real problem is, the sooner you get the right help. If you have it, attach your diagnostics zipped file. If not, attach your syslog and SMART reports (if any), preferably zipped. If it's too big, you MUST zip it. If it's useful, attach any screen captures or pictures you have made. You may wish to zip everything into one file, or if too big, into separate zip files. Preview it, then post it. If you've been asked to post a diagnostics file (or anything in addition), DO NOT add it to a previous post: Please create a new post with the requested information! Yes, we've asked for a lot of information, but it's to help you. Please don't make us beg! We're just volunteers, with limited time and lives of our own! Do you believe you have found a bug? Create a support thread in Bug Reports, and describe the problem according to the guidelines above, and tell us why you believe it is a bug in unRAID. Some additional guidelines - * Syslogs need to be complete if possible, not just excerpts. We often need to see where the errors start, and we may need to see how the drives and subsystems are set up. * Please don't process the syslog in any way. We do not want syslogs in a .rtf, .doc, or .pdf format. We want it intact in its original raw text form, just the way you captured it. * Make sure you have upgraded to the latest version, if possible. It's frustrating to spend time helping someone, only to discover it was a problem long fixed. * Please don't ever say "latest version", of anything! Always specify the exact version number of whatever software you are referring to. We can't know which versions you were aware of, and we don't know if you are referring to the latest official version, or the latest beta or RC. And in a month or 2, or worse a year from now, no one will know which version you were referring to. * Try starting in Safe Mode, without any plugins or other addons. Does the problem still occur? Then repeat testing with and without various plugins and addons. * Are you overclocking? Don't! Try restoring all CPU and memory timings and voltages to their stock settings, then see if the problem still occurs. * If you take a picture, make sure it's viewable, no glare. * If you try to capture part of the webGui screen, temporarily drag the browser borders in, to make a much smaller picture. * Is the problem repeatable? We need to know that, so please test, and if repeatable, report the steps that cause a repeat. * If the system crashes completely and there is no way to capture a final syslog, then start a tail on the unRAID console or Telnet session (tail -f /var/log/syslog). * Once the problem is solved, modify your original post, and insert [solved] at the beginning of the Subject line. Moderators: feel free to lock a solved topic. PLEASE do not privately ask the moderators or other users for personal support! Helpful moderators and users are just users like yourself, unpaid volunteers, and do not provide official support, so it is better to ask support questions on the forum instead. That way, you get the benefit of having answers from the whole community, instead of just one person who may or may not know, or may be wrong, or may be unavailable. Plus, you will probably get faster help. And, other users in the community can benefit by learning from your problem and its solution. Moderators: please feel free to edit this post.1 point