Leaderboard


Popular Content
Showing content with the highest reputation on 07/04/21 in all areas
-
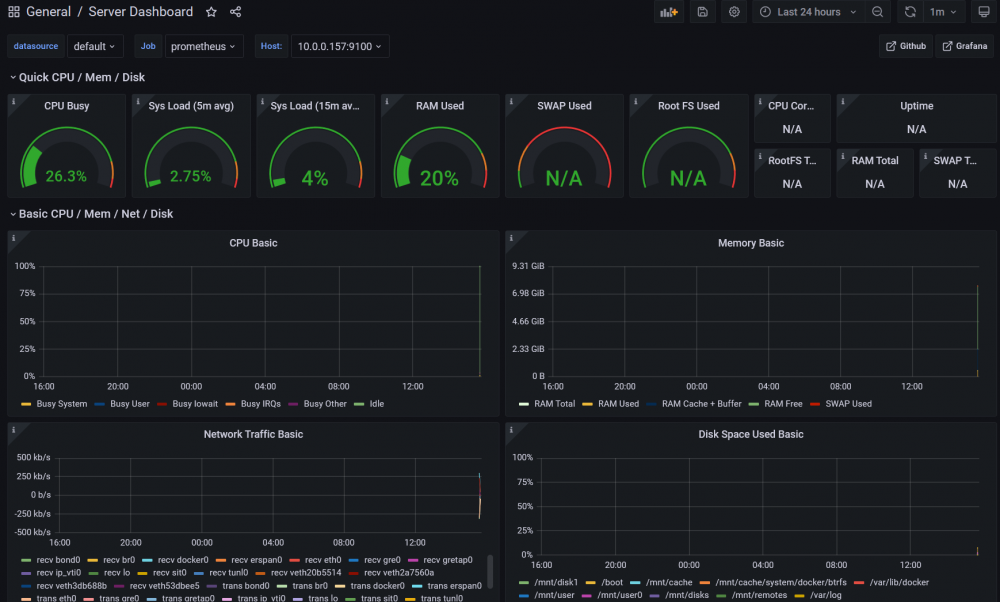
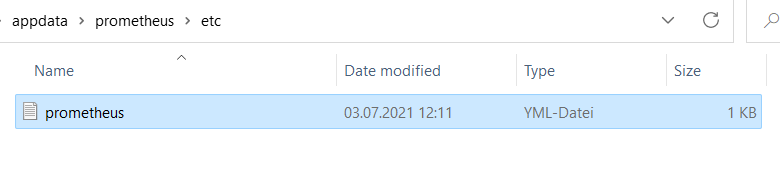
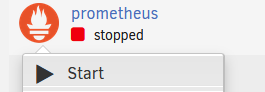
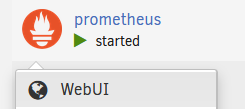
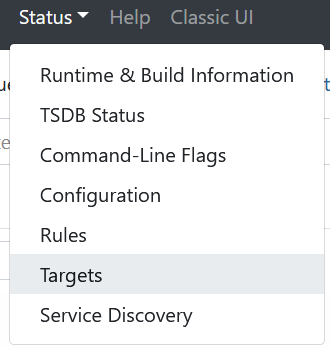
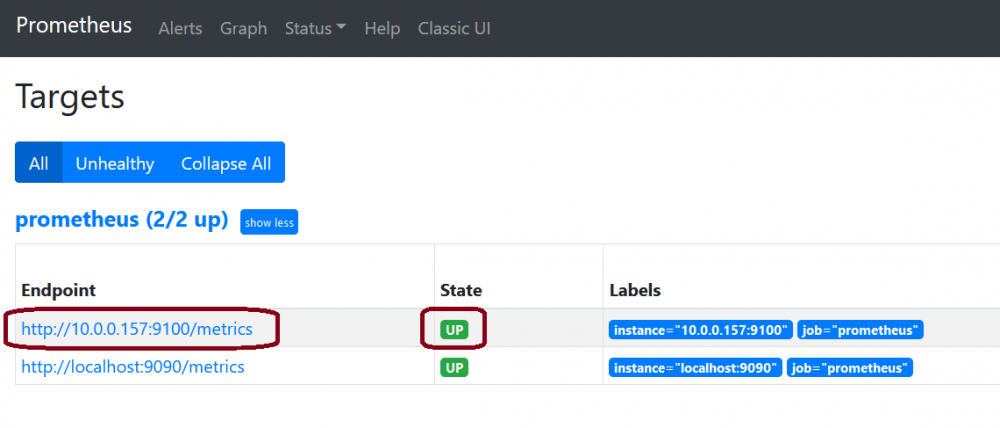
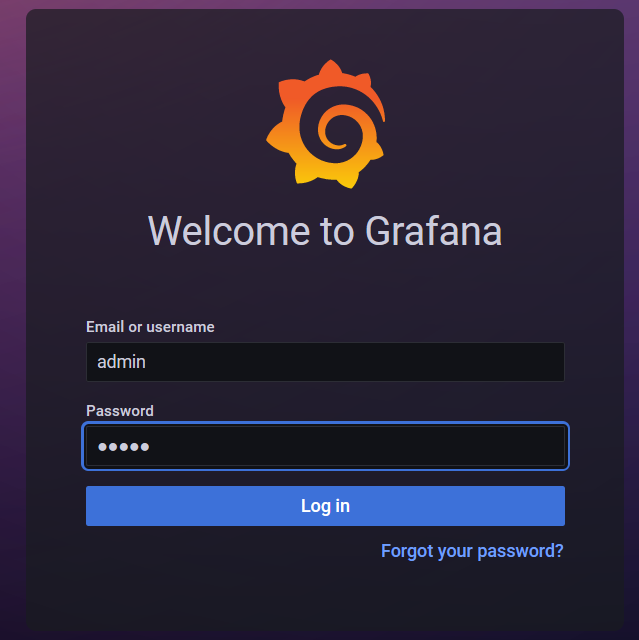
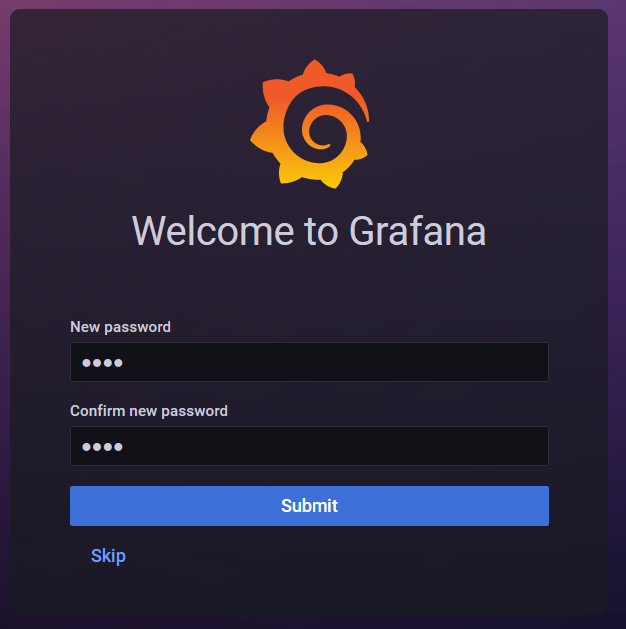
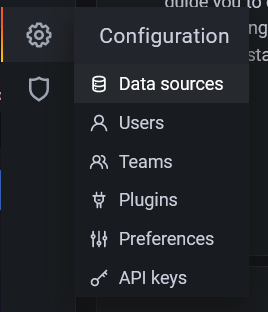
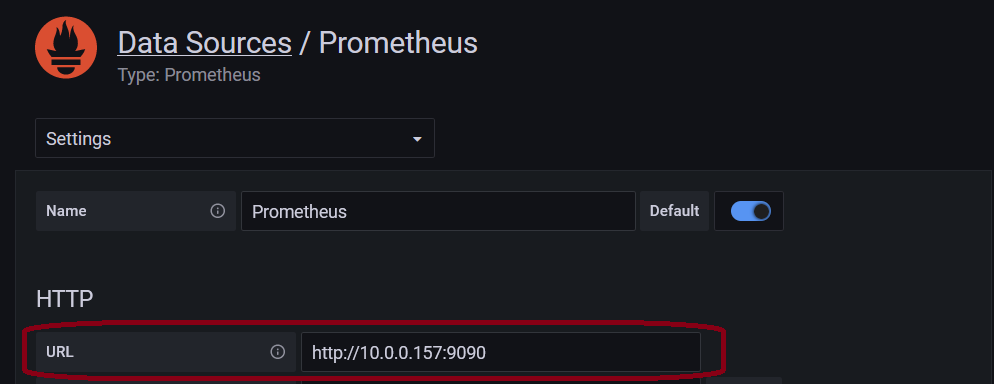
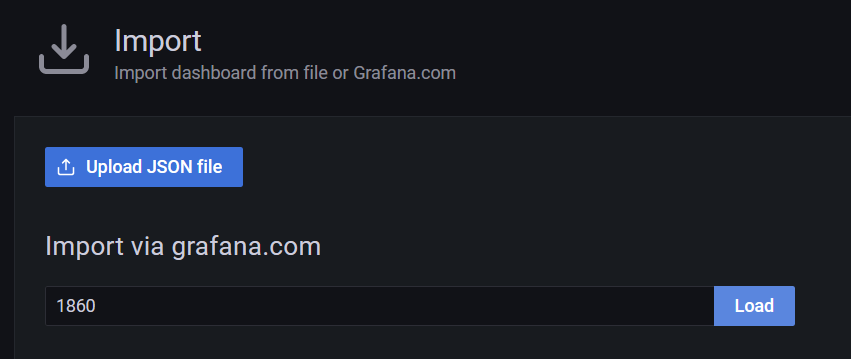
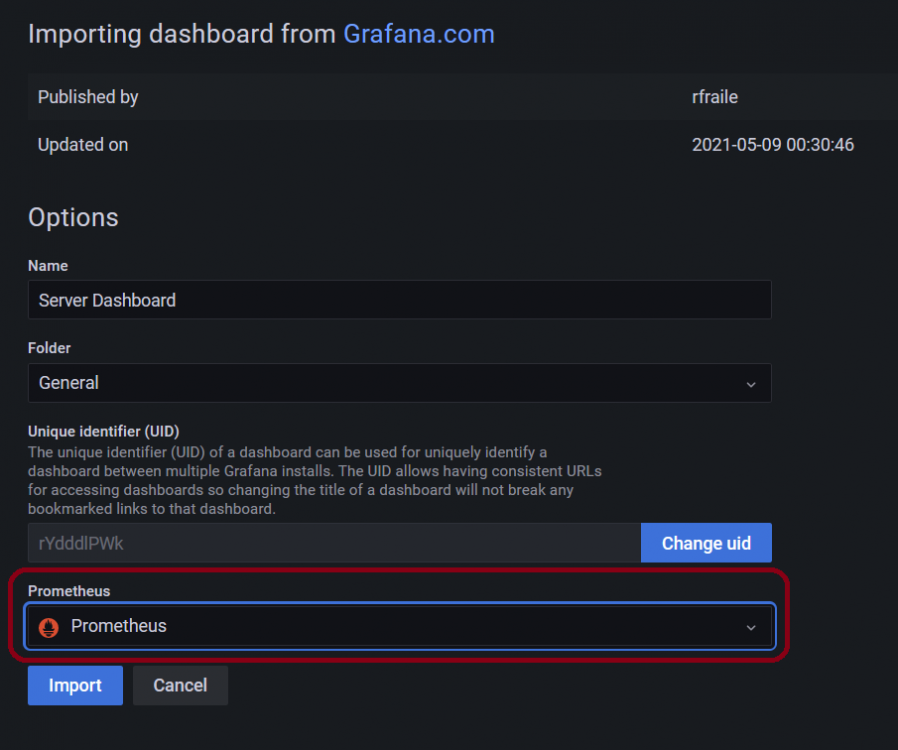
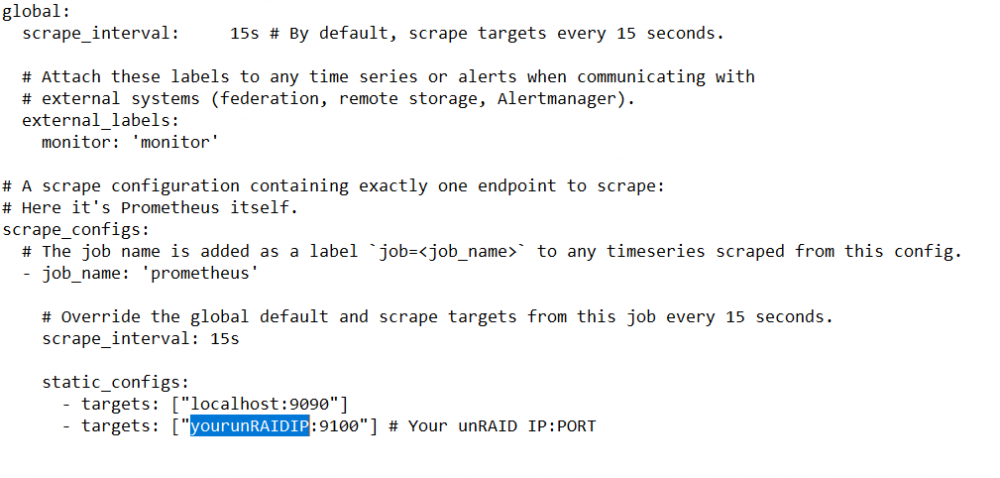
Prometheus unRAID Exporter Plugins This is the support thread for the Prometheus unRAID Exporter plugins. If you got a request for a Prometheus Exporter plugin feel free to ask here in the thread. Following plugins for Prometheus Exporters are available (click on the name to go to the tutorial post): Node Exporter (this post) Data from your unRAID Server nvidia-smi Exporter Data from your Nvidia card(s) passed through to Docker PiHole Exporter Data from your PiHole, whether from Docker or your local network MSI Afterburner Exporter Data from your local PC/VM Wireguard Exporter Data from unRAID Wireguard AdGuard Exporter Data from your AdGuard, whether from Docker or your local network Fritzbox Exporter Data from your Fritzbox Tutorial Grafana, Prometheus & Node Exporter base configuration to get the basic readings from unRAID: Go to the CA App and download the Grafana Docker container: Download the Prometheus Docker container from the CA App (please note that it will be stopped after the installation, that's just fine and will be fixed in the next steps): Download and install the Prometheus Node Exporter plugin from the CA App: Download the 'prometheus.yml' and place it in your '.../appdata/prometheus/etc' directory on your unRAID server: prometheus.yml Open the prometheus.yml and edit the part 'YOURUNRAIDSERVERIP' so that it matches your server IP, save and close the file: Go to your Docker page and start the Prometheus Docker container: After it is started click the Prometheus container again and select WebUI: On the top click on "Status -> Targets": You should see now a list with two entries, the entry "YOURSERVERIP:9100" should display "UP" like in the following screenshot: Go to the Docker page and start the Grafana WebUI: Login with your Username and Password (default: admin | admin): If you left it at default you should change the password in the next screen to something secure or press "Skip": Next we are going to configure the Prometheus datasource in Grafana, click on the "Gear Icon -> Data sources": Click on "Add data source": At Prometheus click on "Select": In the next screen enter the IP and Port from your Prometheus container like this: (You can check the IP:PORT on your Docker page): At the bottom click on "Save & Test": You should see this message: In Grafana click on "+ -> Import": Now we are going to import a preconfigured Dashboard for the Node Exporter from Grafana.com (Source), to do this simply enter the ID from the Dasboard and click "Load": In the next screen be sure to select "Prometheus" as the data source and rename the Dashboard to your liking: Click on "Import": Now you should be greeted with something like this (please keep in mind that the Dashboard can display N/A at some values since there is not enough data available, wait a few minutes and you will see that the values are filled in): (Please also keep in mind that some values will not be filled at all because unRAID by default don't have a SWAP)


 3 points
 -
The Ultimate UNRAID Dashboard that I developed has all of this S.M.A.R.T disk info, but uses Telegraf. It’s nice to have both options. The UUD displays this in a “pretty” format. Let me know if you need a link to it. ich777 can also point you to it as he is aware of my work. Edit: Here is the link:
 2 points
 -
This looks great @ich777! Will share this. Congrats @falconexe! I hope you have a great wedding2 points
-
Hey everyone. I just wanted to shout out @ich777 and his great work on some Prometheus plugins for Grafana. These will most likely be included in the UUD 1.7 someday… @SpencerJ2 points
-
Great work man! Thanks for DMing me about your projects. I know what I’m adding to the Ultimate UNRAID Dashboard (UUD) Version 1.7! 😂 @SpencerJ You see this yet? This might just be juicy enough to pull me out of retirement/hiatus and get the UUD 1.7 out. I’ll look into this in August. I’m getting married this month!2 points
-
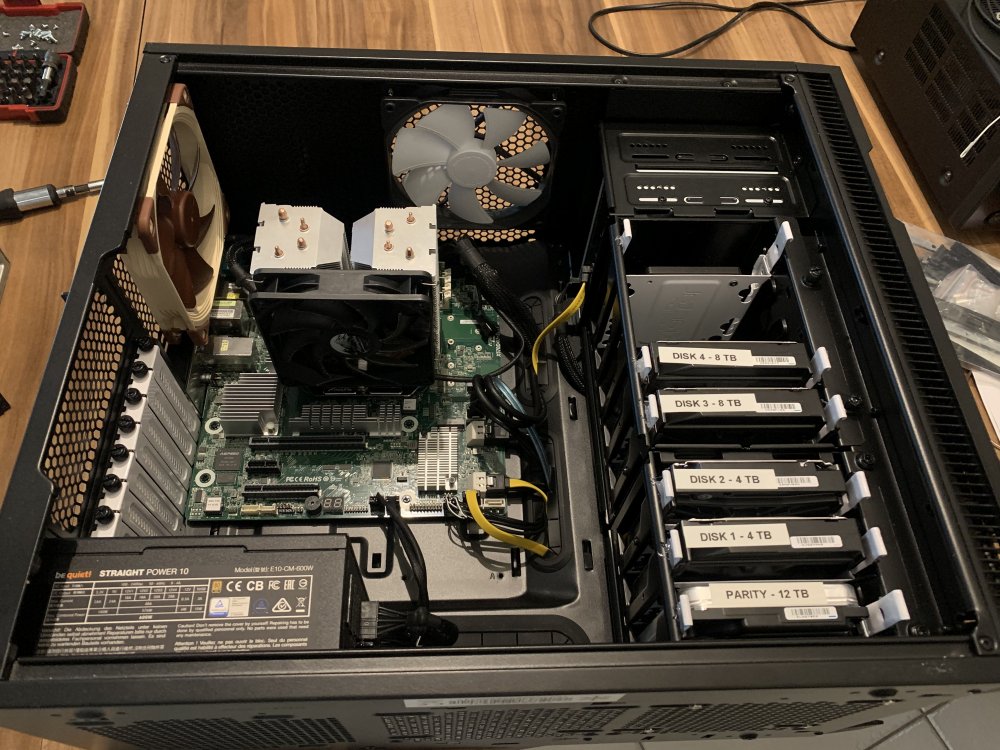
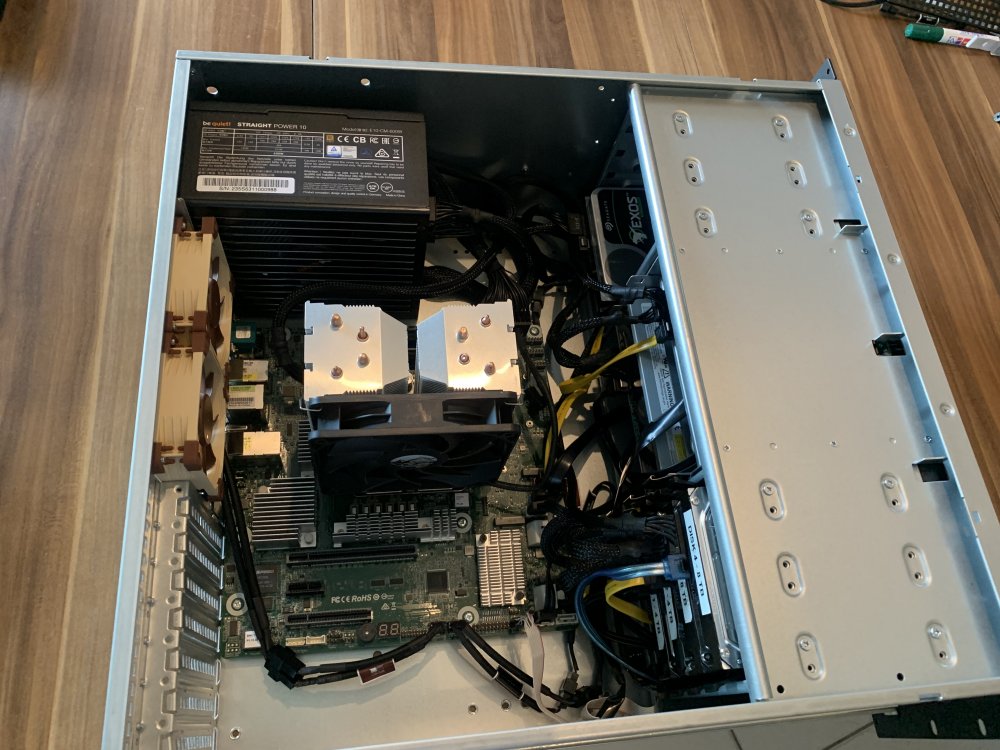
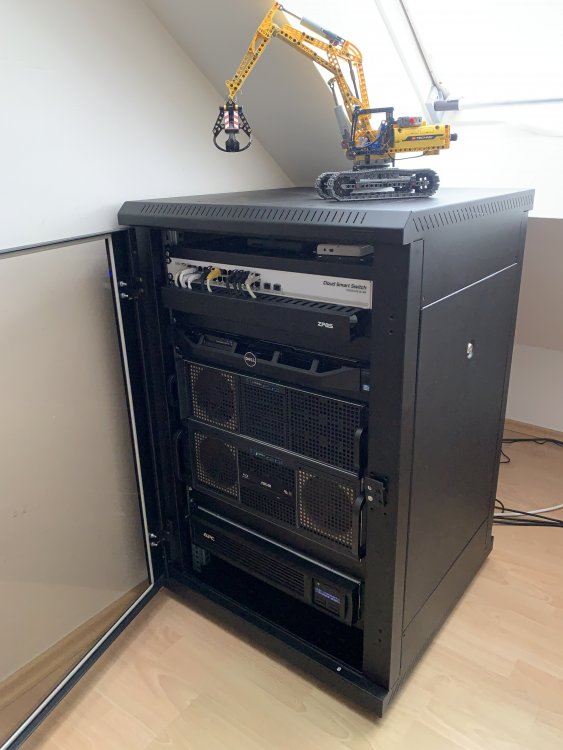
Nach knapp einem Monat ist auch endlich das 4HE angekommen Vorher: Nachher: Schrank: Ich denke so bleibt es erstmal
 2 points
 -
Yes I am... I want to keep everything in Prometheus if possible... Trying to get the script for smart work reliably and then integrate it into the plugin system. One thing I can tell for sure that this plugin for smartctl needs the node exporter installed and won't work without it but the integration to the node exporter will be handled by the smartctl plugin. I know your Dashboards look really nice and I also want it... But I simply haven't got the time to make Dasboards, Plugins, Dockers,... My goal is simply to stick to Prometheus wherever I can (currently I only have Prometheus and Grafana installed). I know you can't do all with Prometheus but at least I try... Have to look into this when I got more time, eventually when I retire from my real job in about 30 years or so...1 point
-
Thanks for the help anyway.1 point
-
Looking good. I'll definitely play around with this once I've got my server up and running. All the kit is sitting in a big pile behind me. Just waiting on a case to be delivered before I build it and start playing around with Unraid. I've been looking for a new tech project. This is going to be fun.1 point
-
To add to this discussion. I'm using Brave Browser and noticed recently that it won't load any Guca based dockers. I need to use FF for that even though there's nothing wrong with the docker1 point
-
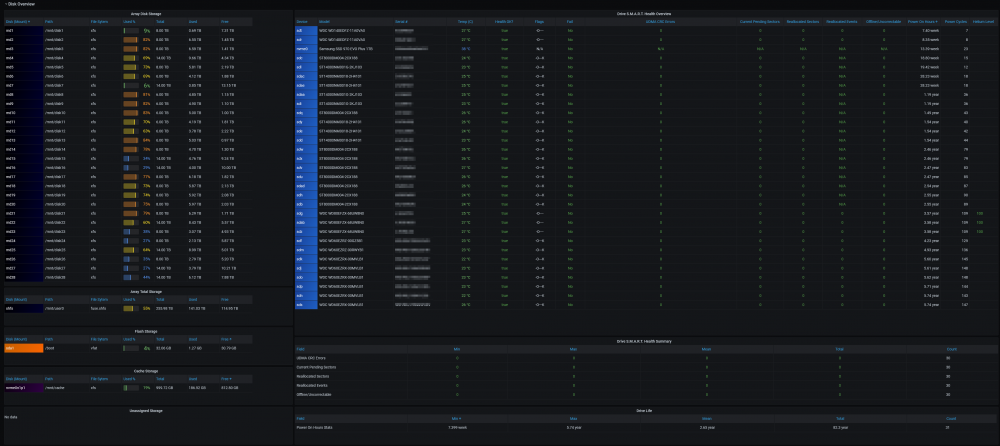
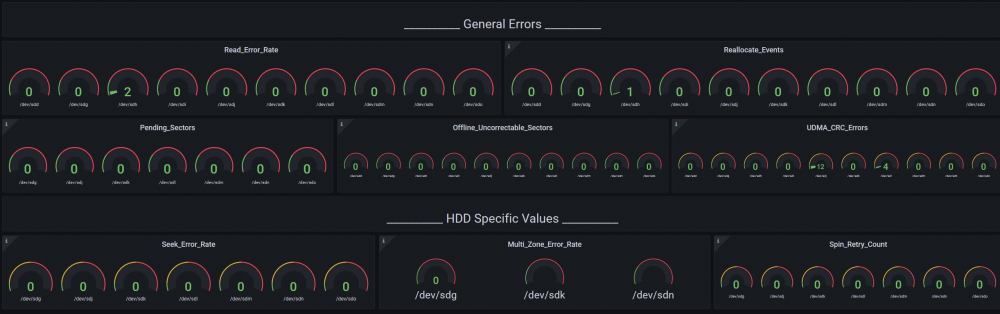
These values are read too but the dasboard is just a template, here is another one (I'm not really good at creating dashbaords but you can at least customize it or create one and if you want to share it I'm happy to put it here in the thread):
 1 point
 -
I will continue to monitor it and I greatly thank you for sticking with me and providing some guidance. I will have to see what else I can tweak to get better response times. Carlton1 point
-
@glennv, Will give it a try pointing it at my other cache pool (which the appdata now uses). If you don't hear from me assume that has worked out!1 point
-
Did you remove the corresponding appdata folders?1 point
-
Hi @mgutt, what is the reason for using MariaDB instead of SQLite? I am running jc21 and SQLite works great.1 point
-
What do you mean? What exactly?1 point
-
I should have mentioned that it will be on the same hardware. The Synology at the moment is running on regular hardware using Jun's Loader.1 point
-
See if this applies to you: https://forums.unraid.net/topic/70529-650-call-traces-when-assigning-ip-address-to-docker-containers/ See also here: https://forums.unraid.net/bug-reports/stable-releases/690691-kernel-panic-due-to-netfilter-nf_nat_setup_info-docker-static-ip-macvlan-r1356/1 point
-
Okay, my friend, it appears to be the MOTHERBOARD!! I literally just threw everything (drives, GPUs, SSDs, RAM, KB, Mouse) into the X570, turned it on, AND IT ALL WORKED FREAKING PERFECTLY. Each VM restarts quickly and normally. Everything appears to be funcitonal. You know, I bought this motherboard for the white shroud to fit a special black and white custom look, but when I first fired it up it reminded me suspiciously of an ASRock BIOS. I tried making some multiple GPU rigs with 2 or 3 ASRock motherboards - just regular one OS builds, not VMs, mind you - and it was a NIGHTMARE. I could never get them to address the multi-GPUs plus the integrated GPU correctly. I ended up returning both of them and using Asus Prime motherboards instead. Both AMD and Intel based Prime motherboards had NO TROUBLE running and handling the multiple GPUs EXACLTY how I set them in the BIOS, and Windows 10 just hummed along happily. This is an Asus TUF X570, and it is just humming happily along doing EXACTLY what I set it to do. ASRock + multi-GPU = NIGHTMARES. Further testing shall be conducted, but it looks like I've figured out my problem.1 point
-
turns out, I somehow smoked the neutral connector on the cord I was using. as in browned and melted the damn thing. probably why the GFCI was tripping... all that power was going down the ground. I'm back up and plotting as well. decided, I'm plotting to fill 24 disks total, then stopping. ordered another NR12000 to use.1 point
-
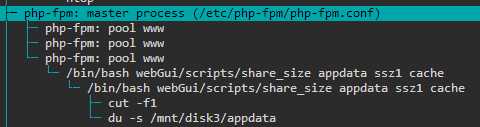
I know your post is over 3 years old, but I think I know the answer In htop I think this is the script that is executing, "webGui/scripts/share_size" - you could kill this process to stop it computing?
 1 point
 -
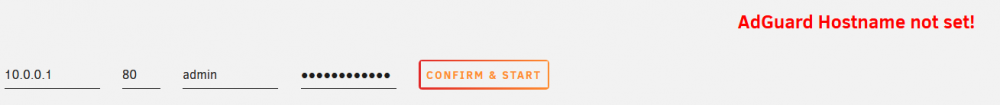
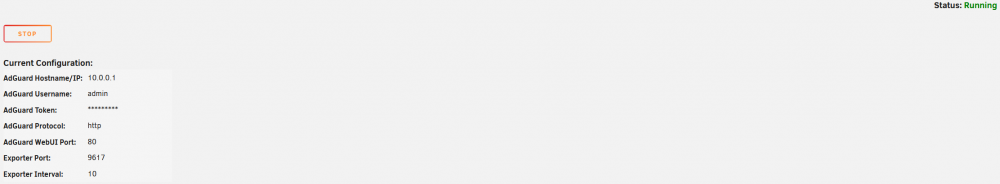
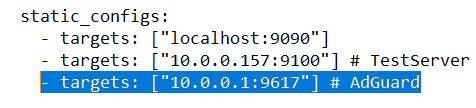
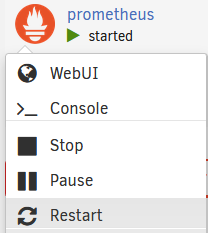
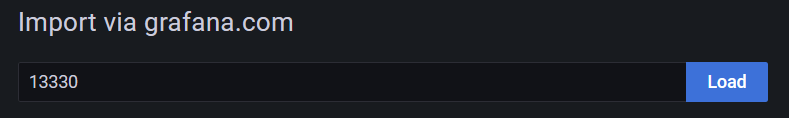
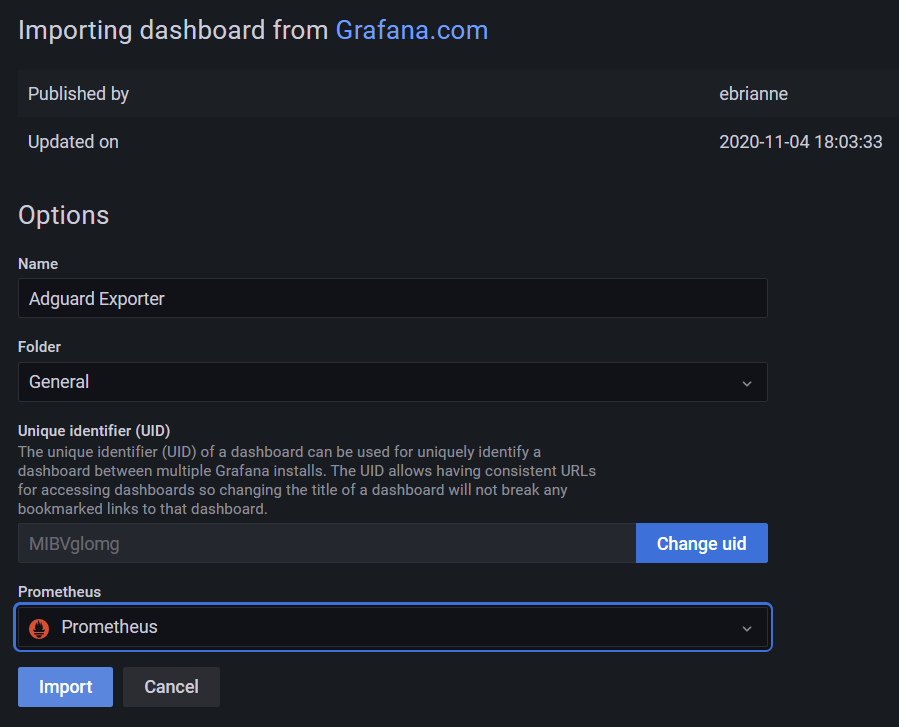
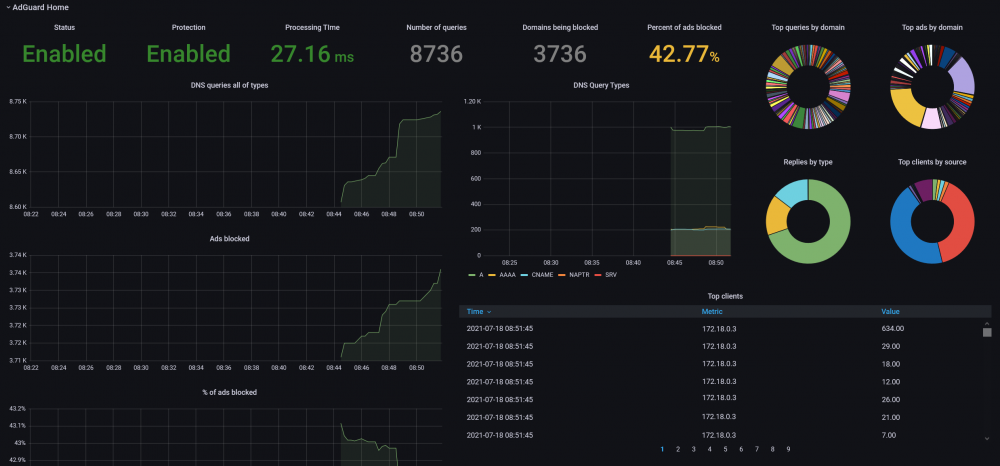
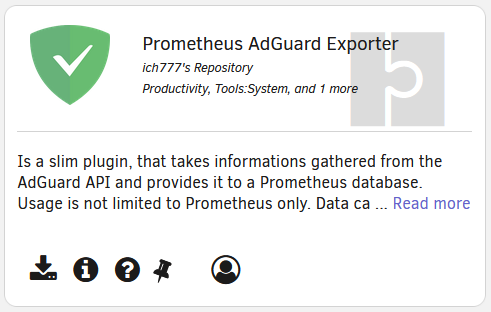
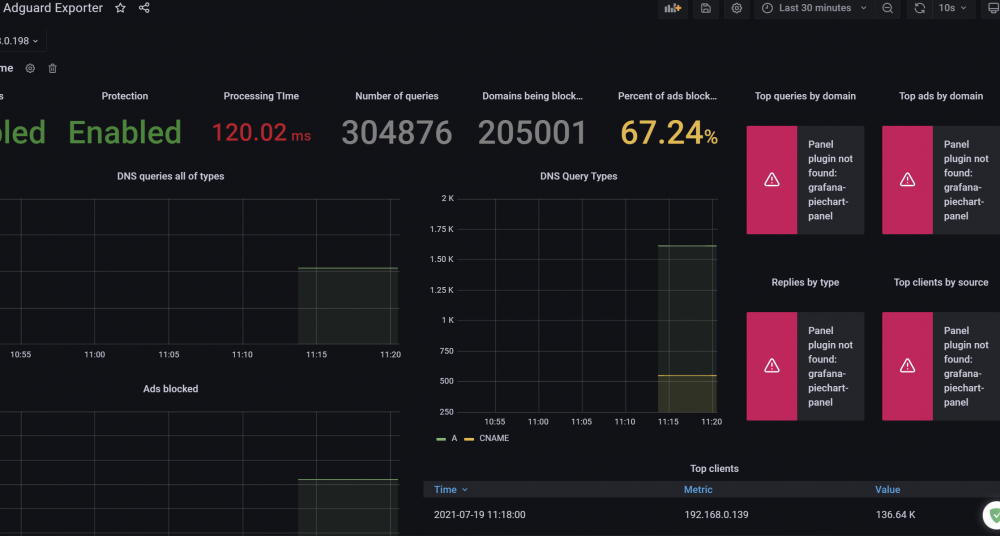
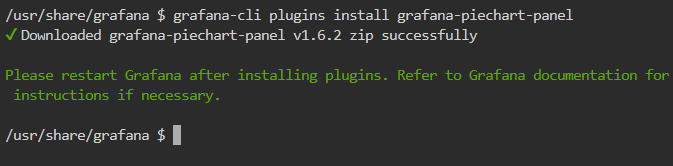
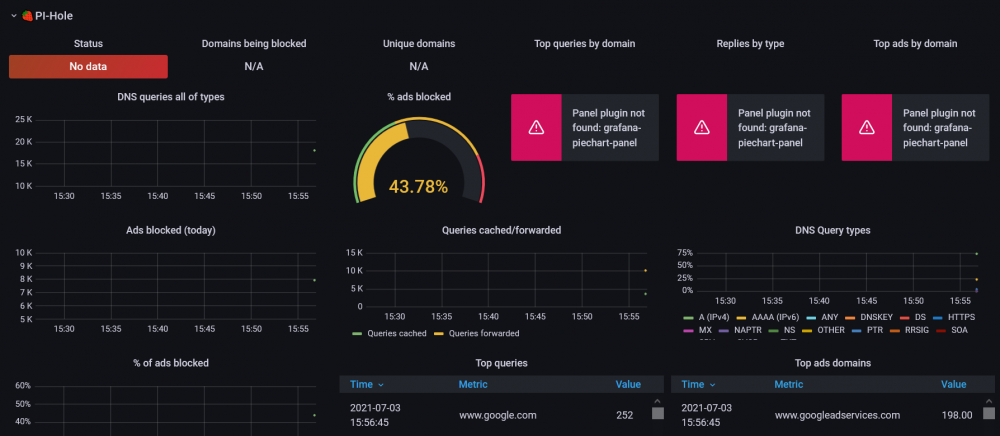
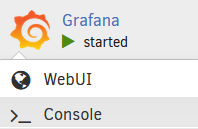
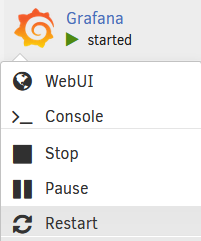
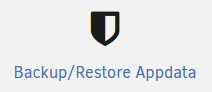
Prometheus AdGuard Exporter Note: You can connect to any AdGuard Home on your local network and of course if you run it on unRAID in a Docker container or VM. Download and install the Prometheus AdGuard Exporter plugin from the CA App: Go to the plugin settings by clicking on "Settings -> AdGuard Exporter" (at the bottom of the Settings page) : Enter your IP from AdGuard, Port, admin username & the password and click on "Confirm & Start": (Please note that if you run your AdGuard in a Docker container in a Custom network like br0 you have to enable the option "Enable host access" in your Docker settings, otherwise the plugin can't connect to your AdGuard instance) After that you should see in the right top corner that the Exporter is running and details about it: Open up the prometheus.yml (Step 4 + 5 from the first post), add a line with '- targets: ["YOURSERVERIP:9617"]' (please change "YOURSERVERIP" to your Server IP), save and close the file: Go to the Docker page and restart Prometheus: Open up the Grafana WebUI: In Grafana click on "+ -> Import": Now we are going to import a preconfigured Dashboard for the AdGuard Exporter from Grafana.com (Source), to do this simply enter the ID (13330) from the Dasboard and click "Load": In the next screen rename the Dashboard to your liking, select "Prometheus" as datasource and click on "Import": Now you should be greeted with something like this (please keep in mind that the Dashboard can display N/A at some values, especiall at the gauges, since there is not enough data available, wait a few minutes and you will see that the values are filled in): (Now you will notice that this warning: "Panel plugin not found: grafana-piechar-panel" appears on the Dasboard, to fix this follow the next steps) Go to your Docker page and click on Grafana and select "Console": In the next window enter the following 'grafana-cli plugins install grafana-piechart-panel' and press RETURN: After that close the Console window and restart the Grafana Docker container: Now go back to your AdGuard Dashboard within Grafana and you should now see that the Dasboard is fully loaded: ATTENTION Please note if you restart your AdGuard container the Exporter will stop and you have to manually start it from the plugin configuration page with the "START" button. This also applies if you have CA Backup installed and the container is beeing backed up. To workaround that you don't have to manually restart it after each CA Backup do the following steps: Go to Settings and click on the bottom on "Backup/Restore Appdata": Confirm the Warning that pops up and scroll all the way down to the bottom and click on "Show Advanced Settings": At AdGuard make sure that you click on the switch so that it shows "Don't Stop": Scroll down to the bottom and click "Apply":


 1 point
 -
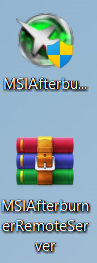
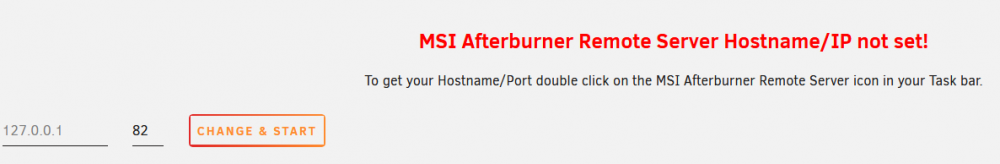
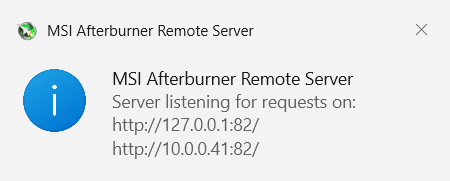
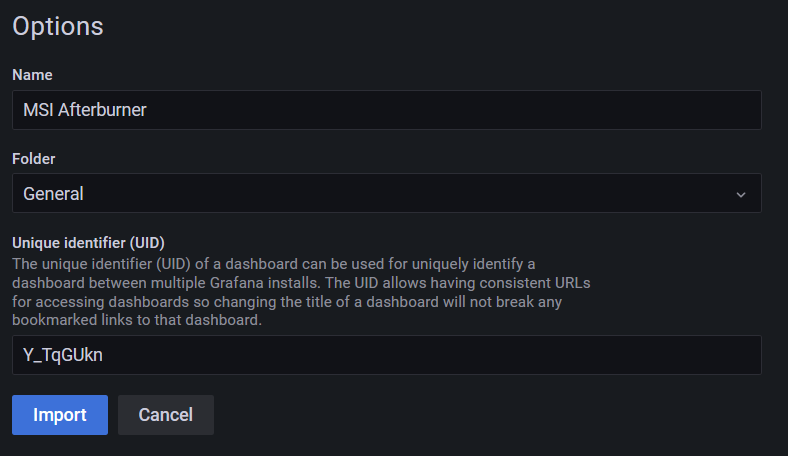
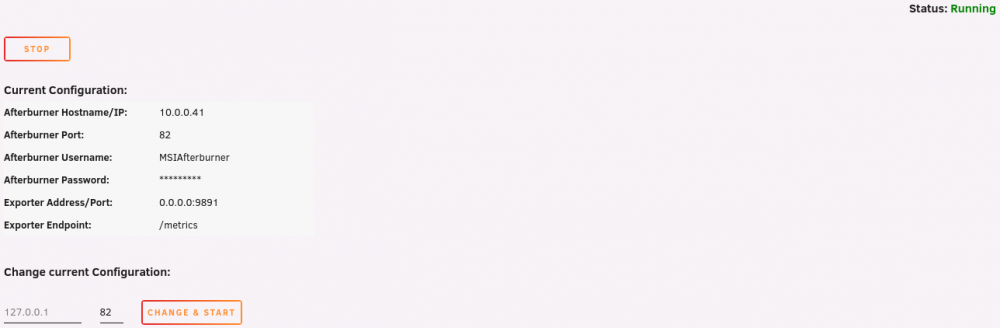
Prometheus MSI Afterburner Exporter With this plugin you can export the status from your local PC or a VM, running for example on unRAID, to Prometheus. Note: This plugin needs MSI Afterburner and MSI Afterburner Remote Server installed to work on the machine you want to watch (you can get them here )! Download and install the Prometheus MSI Afterburner Exporter plugin from the CA App: Go to your local local PC/VM and install MSI Afterburner and also MSI Afterburner Remote Server: (In the case for MSI Afterburner Remote Server I recommend to extract the folder to C:\Program Files (x86)\RemoteServer folder and configure the "MSIAfterburnerRemoteServer.exe" to run on boot as Administrator) Go to the plugin settings by clicking on "Settings -> Afterburner Exporter (at the bottom of the Settings page)": Enter your IP from your local PC/VM and click on "Confirm & Start": To get your IP go to your local PC/VM and doubleclick on the MSI Afterburner Remote Server icon and it will tell you the IP (in this case the second line is relevant since 127.0.0.1 = localhost is only reachable from the local PC/VM and your server actually can't connect to this address): (It is strongly recommended to assign your local PC/VM a static IP in your Router/Firewall) After you started it you should see in the right top corner that the Exporter is running and details about it: Open up the prometheus.yml (Step 4 + 5 from the first post), add a line with '- targets: ["YOURSERVERIP:9891"]' (please change "YOURSERVERIP" to your Server IP), save and close the file: Go to the Docker page and restart Prometheus: Open up the Grafana WebUI: In Grafana click on "+ -> Import": In the following windows click on "Upload JSON file" and upload the MSI Afterburner.json file: MSI Afterburner.json (thanks to @alturismo who created that Dashboard) In the next screen rename the Dashboard to your liking and click on "Import": Now you should be greeted with something like this (please keep in mind that the Dashboard can display N/A at some values since there is not enough data available, wait a few minutes and you will see that the values are filled in):


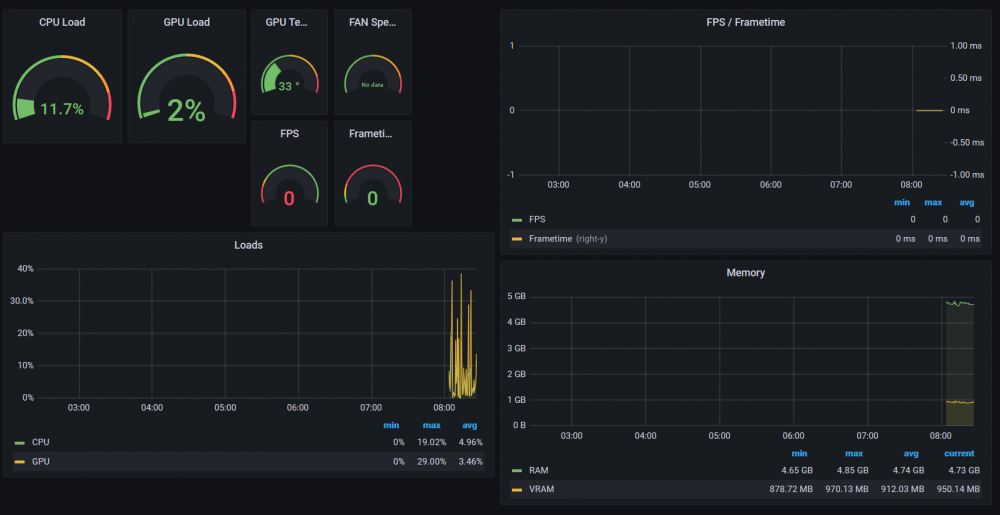
 1 point
 -
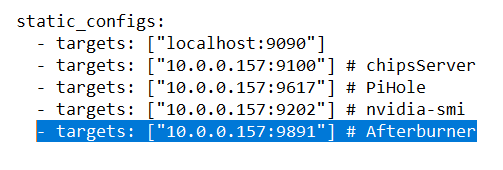
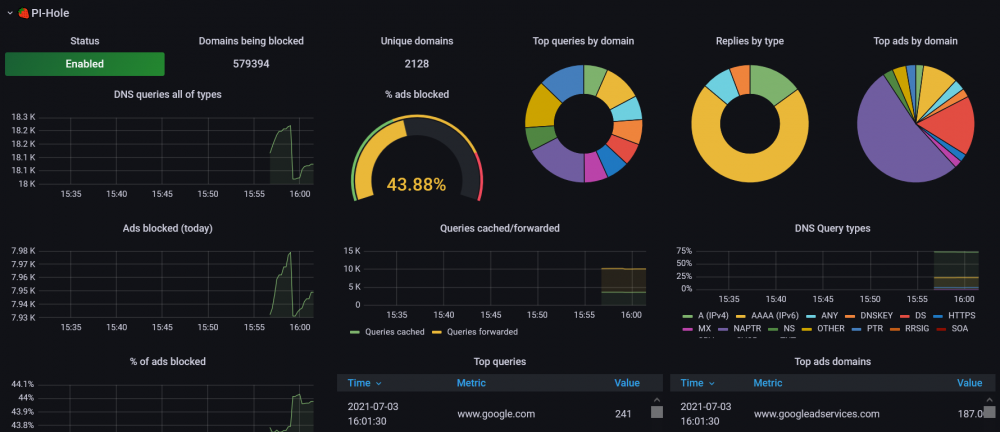
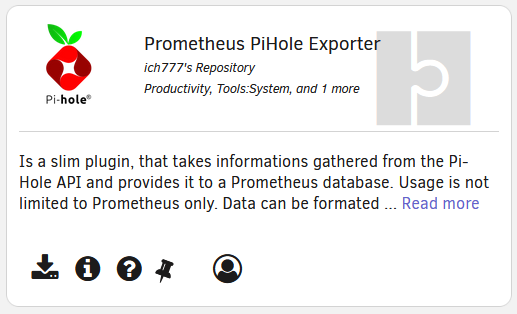
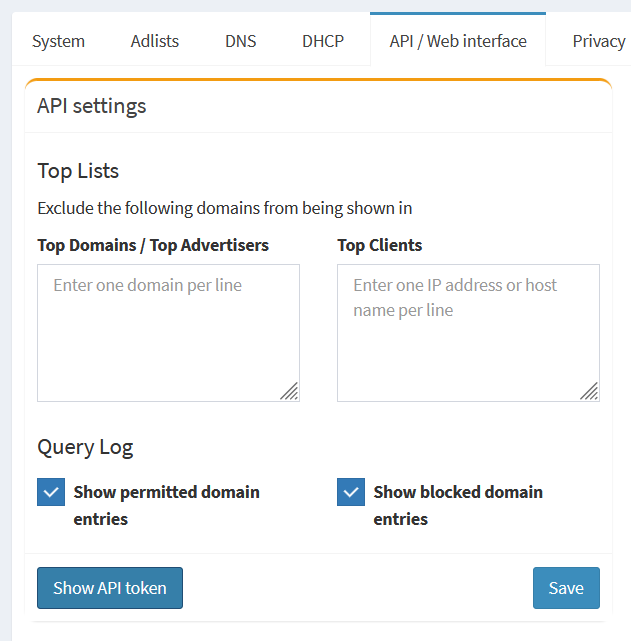
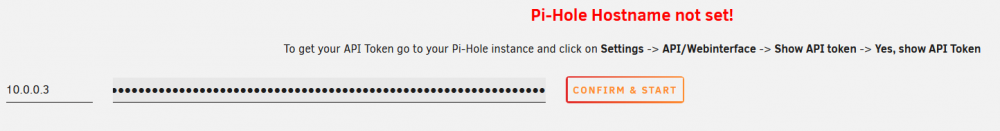
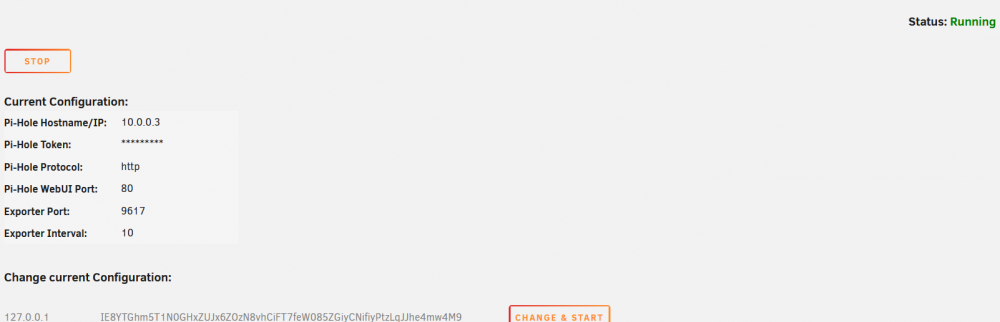
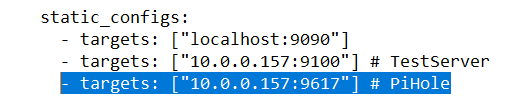
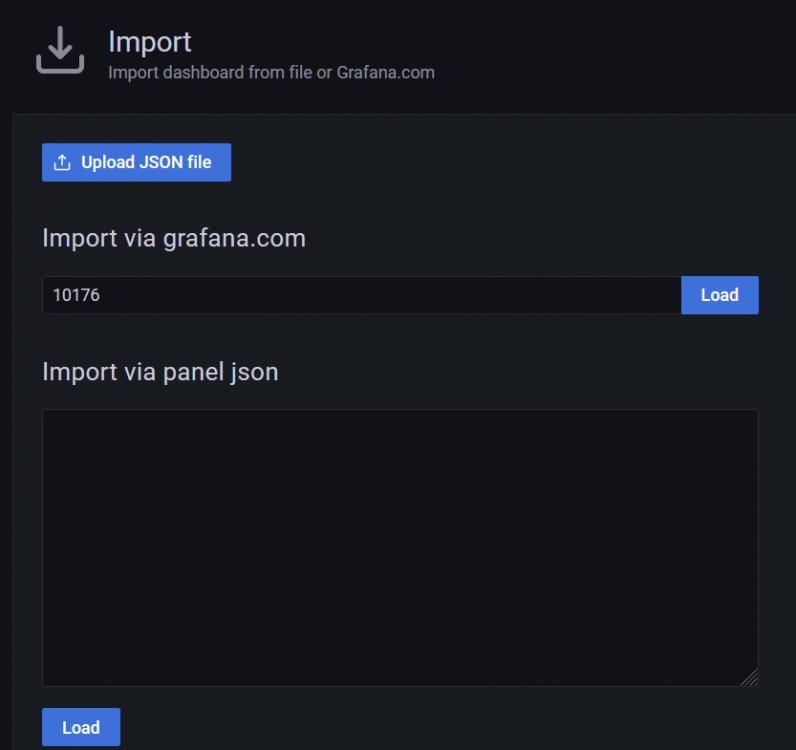
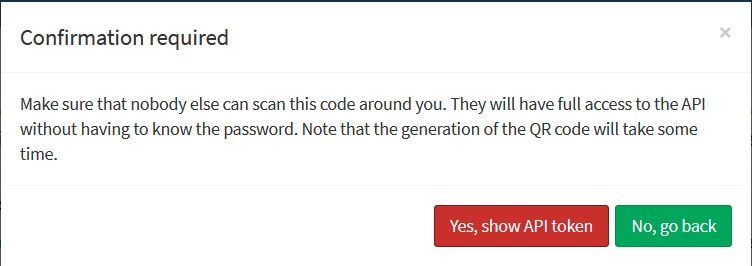
Prometheus PiHole Exporter Note: You can connect to any PiHole on your local network and of course if you run it on unRAID in a Docker container or VM. Download and install the Prometheus PiHole Exporter plugin from the CA App: Go to the plugin settings by clicking on "Settings -> Pi-Hole Exporter (at the bottom of the Settings page)": Enter your IP from PiHole and also your API Token and click on "Confirm & Start": (Please note that if you run your PiHole in a Docker container in a Custom network like br0 you have to enable the option "Enable host access" in your Docker settings, otherwise the plugin can't connect to your PiHole instance) To get your API Token go to your PiHole instance, Login and click on "Settings -> API / Web interface -> Show API Token -> Yes, show API Token": After that you should see in the right top corner that the Exporter is running and details about it: Open up the prometheus.yml (Step 4 + 5 from the first post), add a line with '- targets: ["YOURSERVERIP:9617"]' (please change "YOURSERVERIP" to your Server IP), save and close the file: Go to the Docker page and restart Prometheus: Open up the Grafana WebUI: In Grafana click on "+ -> Import": Now we are going to import a preconfigured Dashboard for the PiHole Exporter from Grafana.com (Source), to do this simply enter the ID (10176) from the Dasboard and click "Load": In the next screen rename the Dashboard to your liking and click on "Import" Now you should be greeted with something like this (please keep in mind that the Dashboard can display N/A at some values since there is not enough data available, wait a few minutes and you will see that the values are filled in): (Now you will notice that this warning: "Panel plugin not found: grafana-piechar-panel" appears on the Dasboard, to fix this follow the next steps) Go to your Docker page and click on Grafana and select "Console": In the next window enter the following 'grafana-cli plugins install grafana-piechart-panel' and press RETURN: After that close the Console window and restart the Grafana Docker container: Now go back to your PiHole Dashboard within Grafana and you should now see that the Dasboard is fully loaded: ATTENTION Please note if you restart your PiHole container the Exporter will stop and you have to manually start it from the plugin configuration page with the "START" button. This is also applies if you have CA Backup installed and the container is beeing backed up. To workaround that you don't have to manually restart it after each CA Backup do the following steps: Go to Settings and click on the bottom on "Backup/Restore Appdata": Confirm the Warning that pops up and scroll all the way down to the bottom and click on "Show Advanced Settings": At Pi-Hole make sure that you click on the switch so that it shows "Don't Stop": Scroll down to the bottom and click "Apply": NO DATA SHOWING UP IN THE PIHOLE DASHBOARD If no data is showing up in the PiHole Dashboard it is most likely the case that you have configured another Datasource like Telegraf in Grafana, to solve this issue go to this post:


 1 point
 -
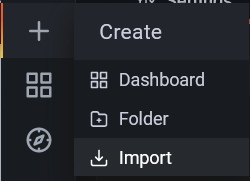
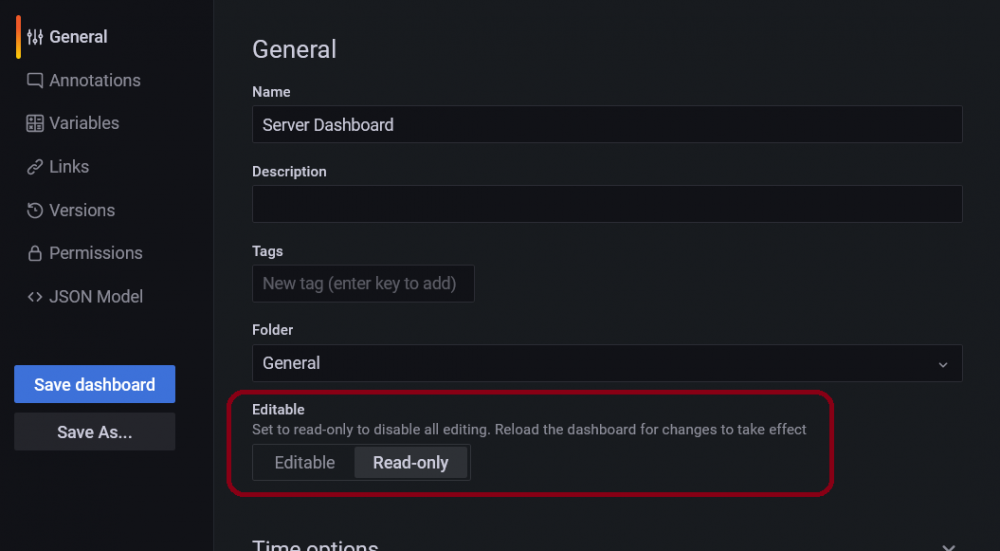
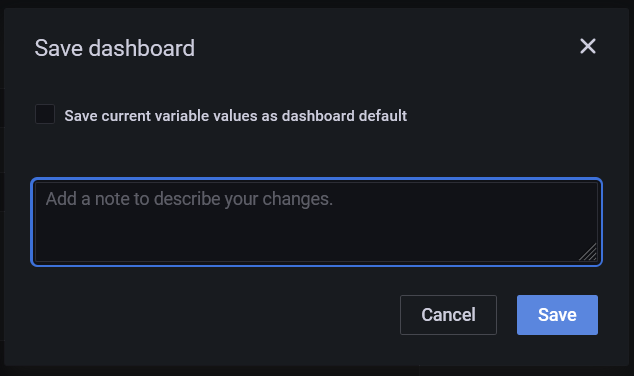
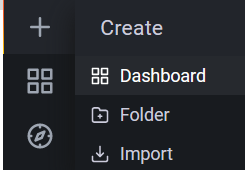
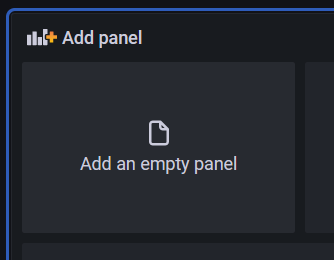
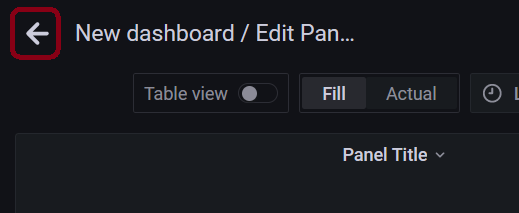
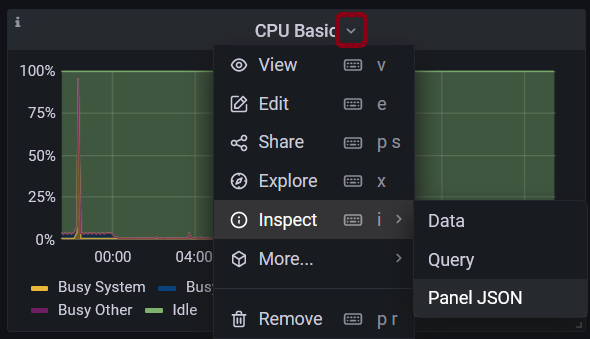
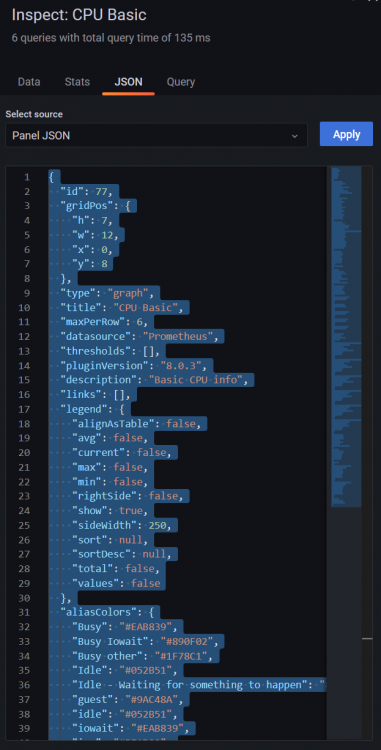
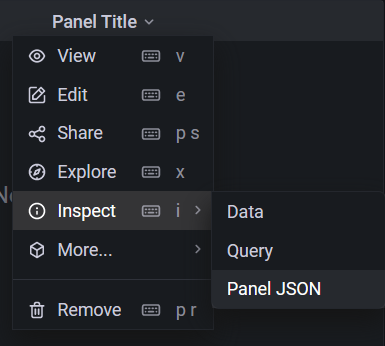
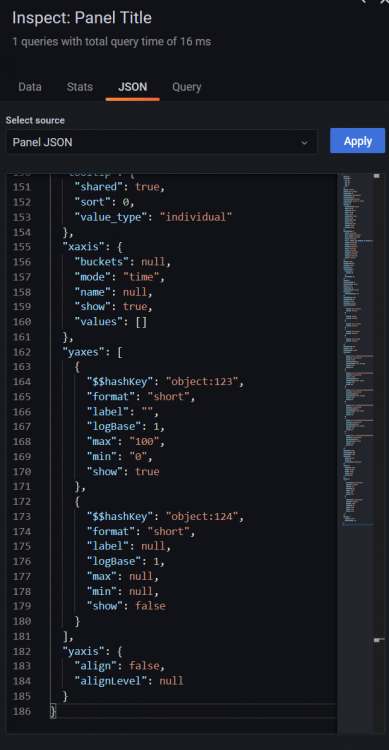
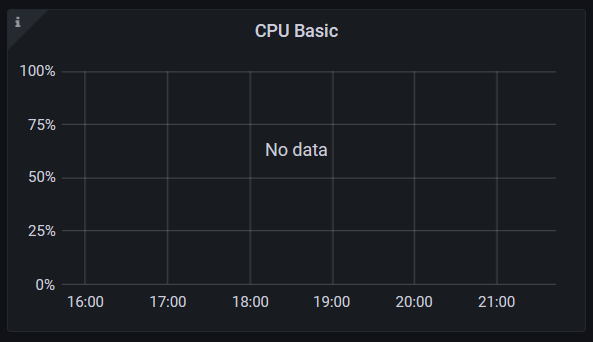
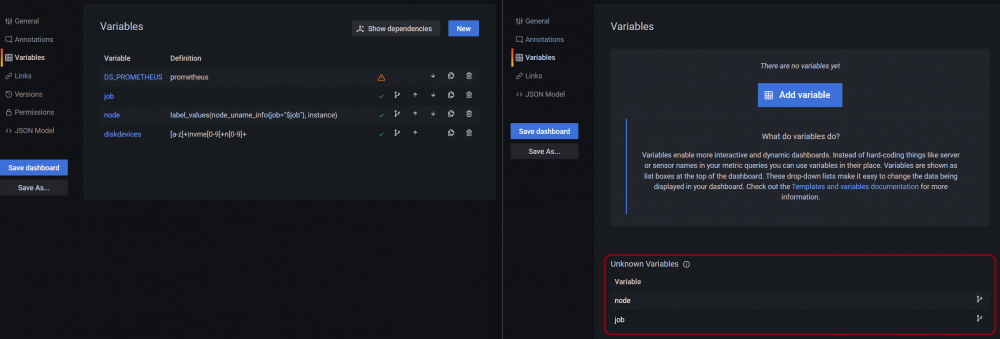
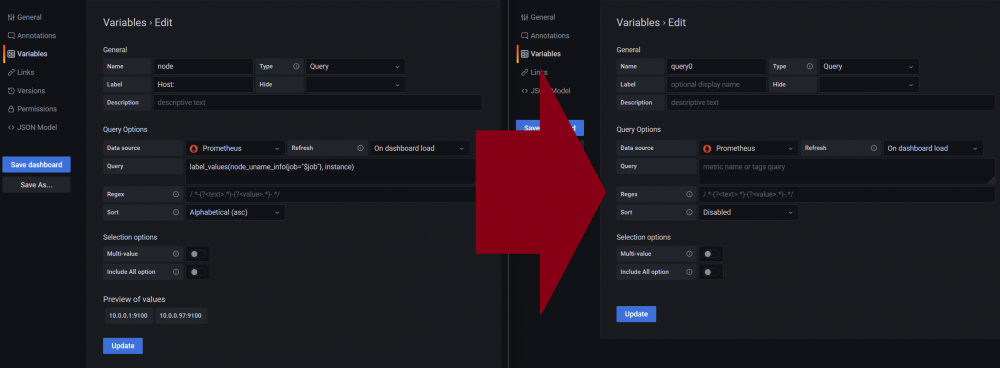
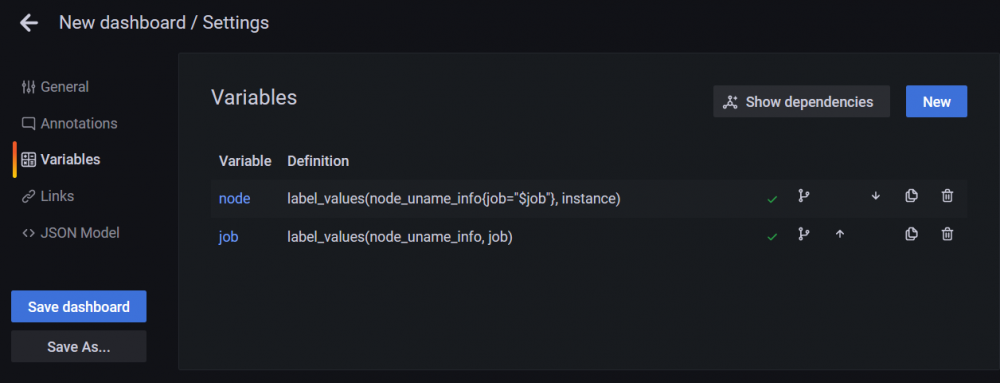
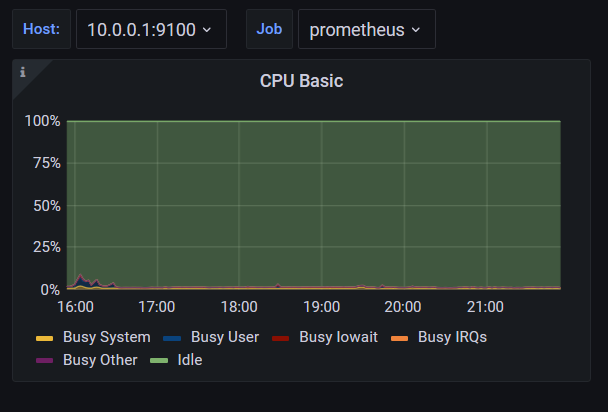
Dashboard Hints Create your very own customized Dashboard from the templates: Open two window side by side from Grafana In the first window open up the Dashboard from which you want to import panels In the second window click on "+ -> Dashboard" and click on "Add an empty panel" and click on the back arrow on the top: Back in the first window click on the little arrow that appears when you hover over the name from the panel with the cursor that you want to move over to your new Dashboard and select "Inspect -> Panel JSON": Copy the whole text from the appearing side panel in your clipboard with CTRL+C: Go to the second window and hover over the name from the empty panel with the cursor and select "Inspect -> Panel JSON": Paste the contents from Step 5 with CTRL+V from the appearing side panel and click "Apply": If you got an empty panel like in this case your source Panel from which you copied the JSON has most likely variables configured that you can also define in your new Dashboard: Click on the little Gear icon on the very top in your first and also in your second window: Click in both windows on "Variables" and add the missing variables from the first to the second window (the missing variables that you have to add are displayed on the bottom): Copy over all fields from the first to the second window so that they match and click "Update": Once you copied over all variables and none missing Variables are displayed anymore click on "Save dashboard" and in the following dialog box on "Save": Now you should see your panel in it's full glory: Note if you added (a) missing variable(s) from a "old" Dashboard to a "new" these variables apply globally to the "new" Dashboard so you don't have to configure it for each Panel. Make your Dashboard non editable: Open the Dashboard and click on the Gear icon: In the General tab go switch from "Editable" to "Read-only": Click on "Save dashboard": In the next dialogue click on "Save": Click on the "Back Arrow" on top to go back to your template: To make Dashboard editable again do the steps from above and in Step 2 switch from "Read-only" to "Editable".


 1 point
 -
ahh sorry my bad, looks like i echo out the internal tunnel ip address not the external ip, so for your example above 10.23.112.2 will be internal only, you need the external ip, this can be found by opening terminal for the container and running the command:- curl ifconfig.io this will return an ip, copy and paste this into https://www.yougetsignal.com/tools/open-ports/ with the currently assigned port (check log as it can change) and test it, i think you will find its open.1 point
-
Thanks for the input. We will improve this.1 point
-
Finally found a solution, i had to set hypervisorlaunchtype to off for my windows vm. Run Command Prompt as an Administrator. Type bcdedit and then press Enter. Under Windows Boot Loader an identifier is reported. Type bcdedit /set {identifier} hypervisorlaunchtype off and then press Enter.1 point
-
After building a custom QEMU 5.2 slackpkg and implementing the workaround described above, I was also able to use virtiofs to pass-through directories on my Unraid host to my VMs. However, determining the correct compilation options for QEMU was a time-consuming, iterative process. I reached out to @limetech and they confirmed that QEMU 6.0 will be included in Unraid 6.10 which is coming "soon". For future readers of this thread, if you are not in immediate need of this functionality, I would recommend waiting for Unraid 6.10. If you cannot wait I have a few notes that may help you get this working. Use a "full Slackware current" VM as your build machine. The Slackware current kernel is slightly ahead of Unraid 6.9.2 at the time of this writing (5.10.39 vs 5.10.28) but the QEMU package it produces is compatible. I downloaded my Slackware current install ISO from AlienBOB here. The QEMU 5.2.0 source code is available at https://www.qemu.org/download/#source (direct download link here). The QEMU 5.2.0 build scripts have a bug which results in incorrect options being passed to the linker. In order to build QEMU 5.2.0, you will need to apply a patch which can be found here (this may be resolved in QEMU 6.0). You might need to download and install a few additional slackpkgs onto your build vm to compile QEMU. I needed libseccomp-2.3.2, spice, and spice-protocol. The spice packages were not available on pkgs.org so I rebuilt them from source on my build machine (Note: these packages are already available on Unraid 6.9.2) A QEMU slackbuild script can be found on slackbuilds.org here. The QEMU build args that worked for me are included below. I also set the environment variables VERSION=5.2.0 and TARGETS="x86_64-softmmu,x86_64-linux-user". Additionally, I commented out the line "make config-all-devices.mak config-all-disas.mak" and removed a few nonexistent files from the cp command near the end of the build script. CXXFLAGS="$SLKCFLAGS" \ ./configure \ --prefix=/usr \ --libdir=/usr/lib${LIBDIRSUFFIX} \ --sysconfdir=/etc \ --localstatedir=/var \ --docdir=/usr/doc/$PRGNAM-$VERSION \ --enable-system \ --enable-kvm \ --disable-debug-info \ --enable-virtiofsd \ --enable-virtfs \ --enable-jemalloc \ --enable-nettle \ --enable-vnc \ --enable-seccomp \ --enable-spice \ --enable-libusb \ --audio-drv-list=" " \ --disable-gtk \ --disable-snappy \ --disable-libdaxctl \ --disable-sdl \ --disable-sdl-image \ --disable-virglrenderer \ --disable-vde \ --disable-vte \ --disable-opengl \ $with_vnc \ $targets The procedure above produces a QEMU 5.2.0 slackpkg which can be installed on Unraid. One final note: Unraid 6.9.2 includes glibc-2.32 and QEMU 5.2.0 depends on glibc-2.33; a slackpkg for glibc-2.33 can be obtained here. It's important to emphasize that I do not know the compilation options used to build QEMU for the official Unraid distribution so it's very possible that the QEMU package produced by the procedure above is missing some features that are present in the pre-installed QEMU. As such, I would caution against taking this route and suggest waiting for Unraid 6.10 unless you are truly in dire need. In the meantime I hope this helps others who may find themselves in the same situation that I was in!1 point
-
For all the noobs like I am. When you followed the spaceinvader one tutorials to use your delugevpn container for all the others, there is following things to do (thanks to jonathanm for providing the link with all the explanations). 1. In your delugevpn Container -> Edit, and add under Container Variable: ADDITIONAL_PORTS all the ports you have added for your applications, which should be passed through comma separated. For example: 6789,7878,8989,9117,8080,9090,8686. 2. Now you need to change settings in your Containers, which are passed through (Radarr, Jacket and so on). Inside the containers, which now will be accessable you have to change the Server adress to "localhost". So for example if you had in Radarr under Download Clients -> Deluge -> Host (for example) = 192.168.X.XX, you need to change the host to "localhost" without the ".. Just type localhost there. 3. Change it everywhere in the container where you have your host as numbers to text localhost (for example also in indexer). It seems like this helped me with my problem.. If you see that I have missed something, please feel free to note it.1 point
-
I know similar dockers have been requested already but this seems the easiest of those to use. https://github.com/AzuraCast/AzuraCast https://www.azuracast.com/ Radio Hosting / AutoDJ / Web DJ software1 point
-
How do I increase the size of my docker.img file? Go to settings - Docker Settings. Set Enable Docker to be "No" Apply. Switch to Advanced View (Top Right) Change the size of the image. Set Enable Docker to be "yes" Apply Done.1 point
-
1) If necessary, generate an SSH key on your Mac or Linux machines, using ssh-keygen. 2) Create an authorized_keys file for the unRAID server, using the id_rsa.pub files on all the machines which require access. 3) Copy this file to your server's /root/.ssh/ folder. This will work until a reboot. To handle a persistent setup: 1) Copy the authorized_keys file to /boot/config/ssh/. 2) Add this to the end of.your /boot/config/go, using your preferred editor: mkdir /root/.ssh chmod 700 /root/.ssh cp /boot/config/ssh/authorized_keys /root/.ssh/ chmod 600 /root/.ssh/authorized_keys1 point