

mlapaglia
-
Posts
76 -
Joined
-
Last visited
-
Days Won
1
Content Type
Profiles
Forums
Downloads
Store
Gallery
Bug Reports
Documentation
Landing
Posts posted by mlapaglia
-
-
watch facebook marketplace/craigslist/nextdoor, you can usually find an IT office trying to offload old equipment. i've found 50 port poe gigabit cisco switches. server racks with wheels and closing doors for $100. i once went to an IT office that was moving to a new location and scored a brand new 3000va ups with the optional network card for $150 because i was picking up a server rack and asked if he was selling anything else.
if you are buying a UPS used, make sure you check the expiration date of the batteries. if they are old keep the replacement price in mind.
-
My rosewill 4u server is now full of hard drives and the no name 120mm fans i am using aren't able to move air through the front of the case over them. are there any recommendations for fans with a lot of air flow and static pressure that can work? noise isn't too much of a concern, but i'd prefer pwm fans that can be powered by the motherboard.
-
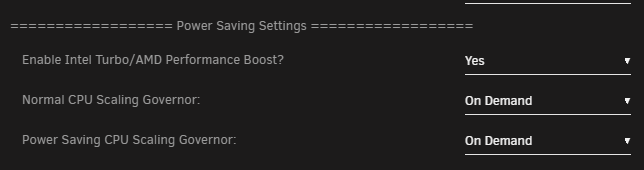
Got a new heatsink for my server, installed and realized it wasnt mounted correctly and was throttling. After reinstalling heatsink I monitored CPU MHz using `watch grep \"cpu MHz\" /proc/cpuinfo` and saw my 3900x was only boosting to 4GHz under load!
I went to "Tips and Tweaks" and changed `Normal CPU Scaling Governor` from `Power Saver` to `On Demand` and the CPU started boosting to 4.5GHz single core and 4.1GHz all core.
I don't remember ever setting or changing this value, not sure if it is default.
-
5 minutes ago, ich777 said:
This is the old plugin, please uninstall your version and reinstall it from the CA App, also don't forget to configure it through the Settings page from the new plugin.
That worked, thank you. we should probably remove the link to the github app for manual installation on the first post.
-
On 7/12/2023 at 4:19 PM, SimonF said:
Which version of the plugin are you using?
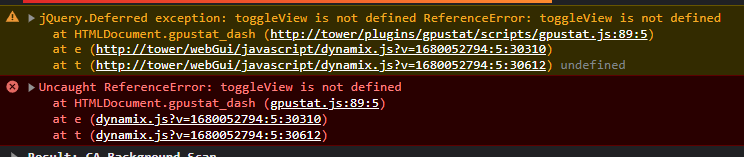
latest unraid, latest plugin (https://raw.githubusercontent.com/b3rs3rk/gpustat-unraid/master/gpustat.plg)
I see this in my console
-
Not sure if this has been brought up yet, but with the new version of unraid the sidebar gets messed up with no gpu selected

edit: might be something wrong with my machine?
-
how do we request getting a package upgraded to latest? borg backup is behind the latest stable.
-
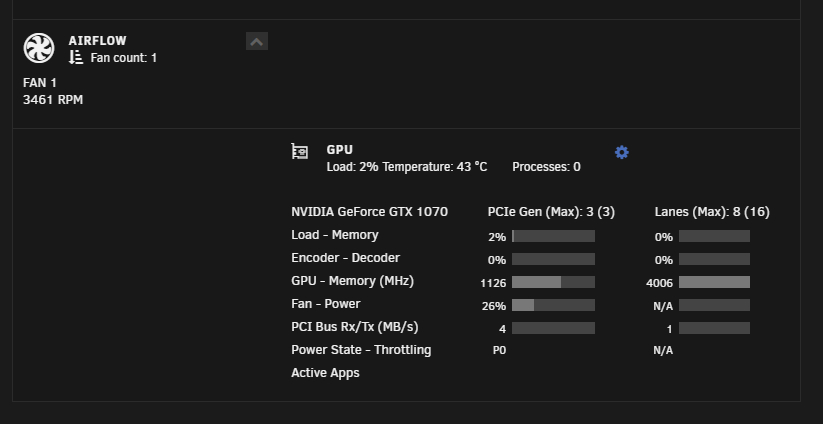
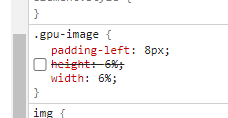
removing `height: 6%` from the `gpu-image` css worked for me on chrome.
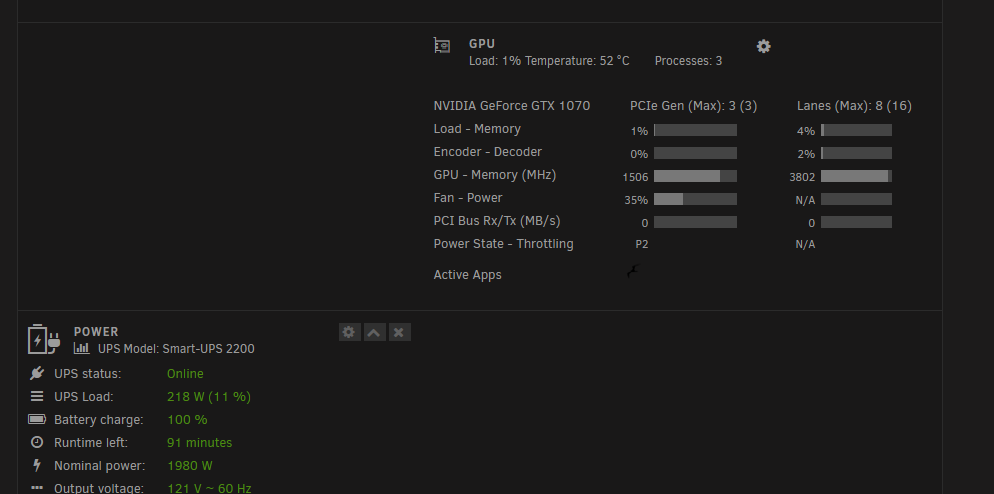
I have one plex stream and one ethereum miner but they both show up as plex:
-
the icon on my dashboard is weird too. also, i have more than plex running on my card, but that icon makes it appear as if they are all plex.
-
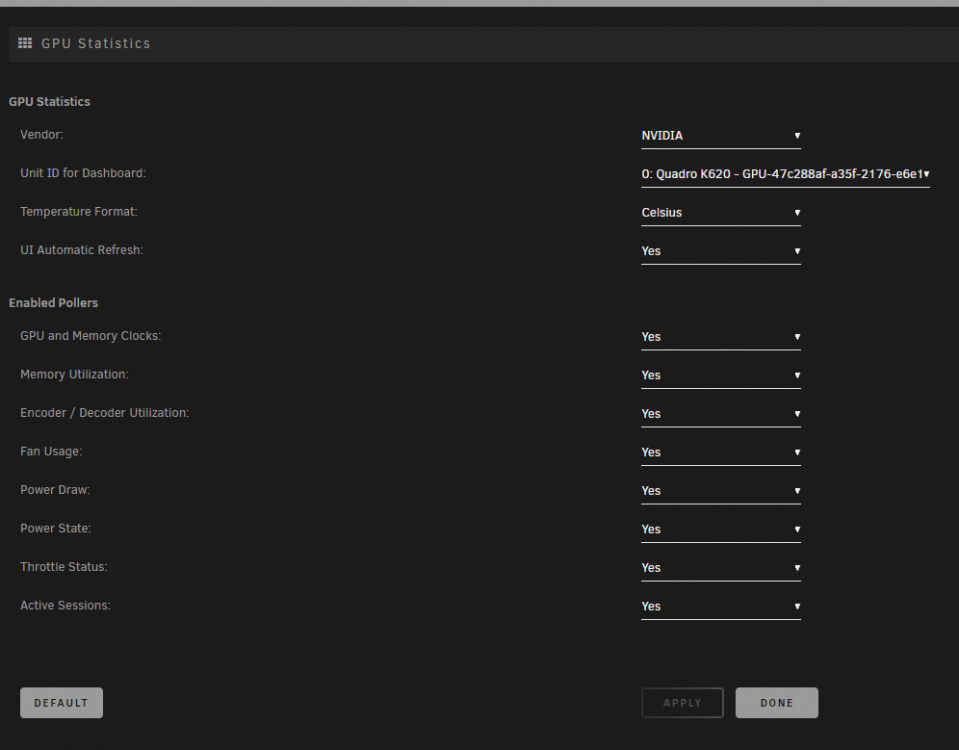
what options controls these showing?

-
ya let me open up a new pr. https://github.com/b3rs3rk/gpustat-unraid/pull/8
-
I would be interested in seeing CPU usage comparison between running a windows vm vs containerizing blue iris.
-
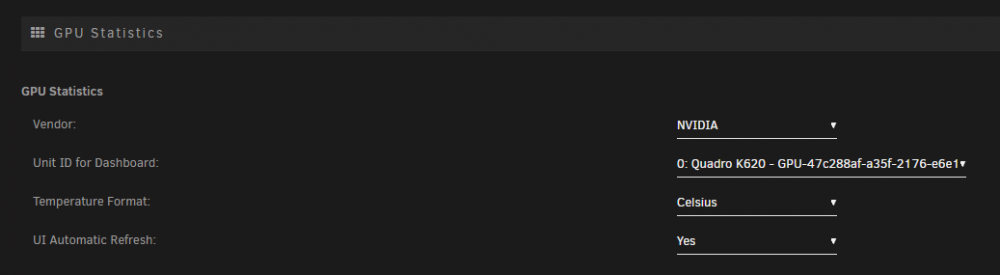
ok, i tried to find some examples but i can't find checkboxes being used anywhere in my config pages. once i switched them to drop down lists they started working:
-
 1
1
-
-
I'm not sure, I just modified it to make it look like the other dashboard, not sure how the back side works.
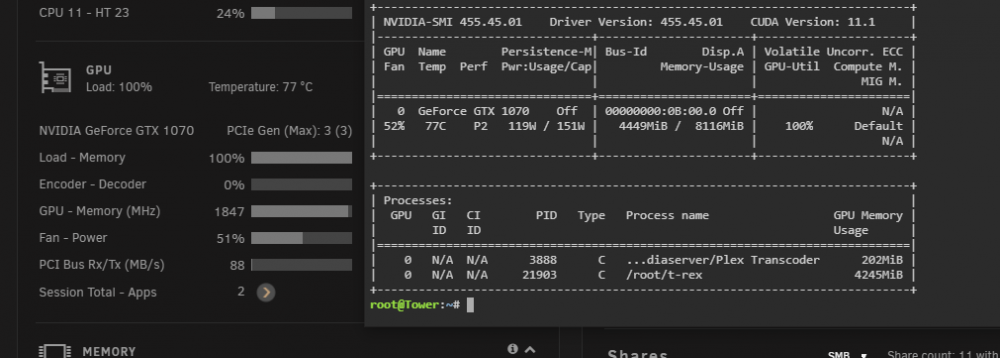
i realized it's missing a memory utilization bar. in the nvidia smi output i see two values. the utilization field for memory doesn't seem to reflect when plex is running transcodes. using the fb_memory_usage value works well though:
Quote<fb_memory_usage>
<total>8119 MiB</total>
<used>10 MiB</used>
<free>8109 MiB</free>
</fb_memory_usage>
<bar1_memory_usage>
<total>256 MiB</total>
<used>2 MiB</used>
<free>254 MiB</free>
</bar1_memory_usage>
<compute_mode>Default</compute_mode>
<utilization>
<gpu_util>0 %</gpu_util>
<memory_util>0 %</memory_util>
<encoder_util>0 %</encoder_util>
<decoder_util>0 %</decoder_util>
</utilization>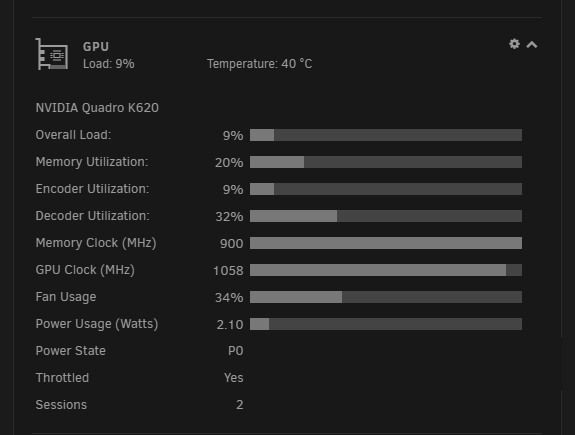
edit: found it https://docs.nvidia.com/deploy/nvml-api/structnvmlUtilization__t.html#structnvmlUtilization__t_19789def365e5aa382ac222db9c60a400
The utilization field for memory is:
QuotePercent of time over the past sample period during which global (device) memory was being read or written.
so for my purposes i'd just want to know how much memory is being used, just making the bar show the % used memory
-
2
-
-
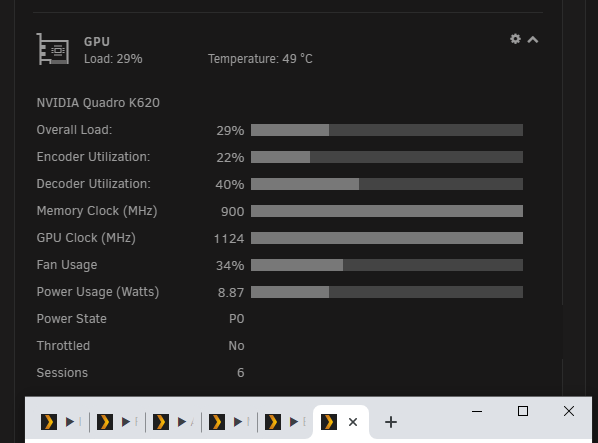
thanks for this plugin!
I have an old quadro k620 in my box I decided to try this on.
A $50 card from 2014 can handle at least 6 plex transcodes at the same time, using less than 10 watts lol!
-
1
-
-
thanks for this plugin. very simple to install, followed instructions and had plex DVR enabled in 10 minutes.
-
1
-
-
I know it's really stupid, but maybe this typo correction will help someone else. I copy/pasted the config volume instructions from the first post instructions and couldn't figure out why it wouldn't map the file into the container:
Quote-v '/mnt/cache/appdata/netdata/netadata.conf':'/etc/netdata/netadata.conf':'rw'
-
1
-
-
ok i added the optional display preferences back in, on my machine whenever i try to save my preferences they go back to default, does that happen on yours?
-
thanks! i couldn't find much information online about developing plugins so i was making wild stabs in the dark lol
-
1
-
-
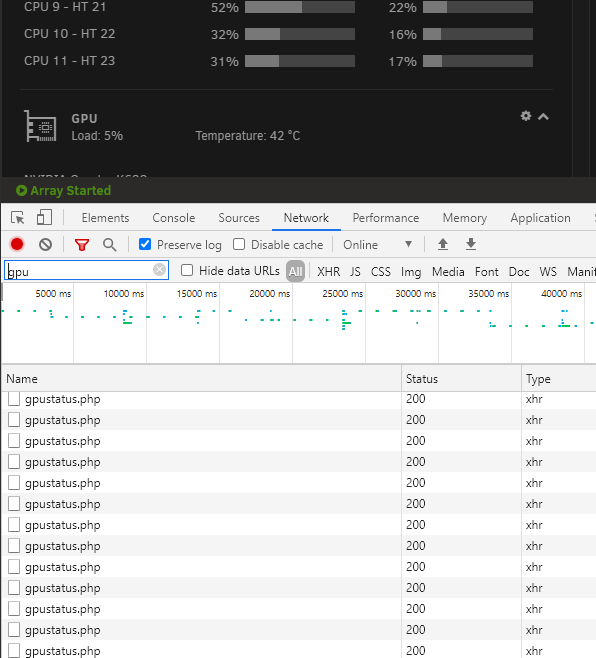
Ya I don't have that part wired up yet. I'm also curious why the plugin has to hit an endpoint every second to get information, while CPU usage in the unraid CPU sidebar doesn't make a http call to get information.
-
On 12/25/2020 at 11:12 AM, Skylinar said:
Would be appreciated if the fix could be merged, I love this tool. Thanks to mlapaglia for taking the time!
If you want to give mine a try first uninstall the existing plugin then manually install my PR https://raw.githubusercontent.com/mlapaglia/gpustat-unraid/master/gpustat.plg
-
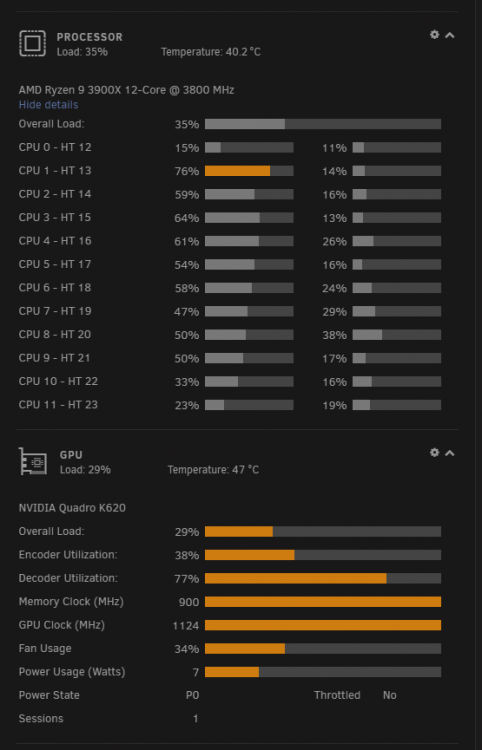
I did some more work to get it to look like the CPU sidebar that comes with unraid
-
4
-
-
I tried cloning the repo and making modifications but i couldn't get my plugin to work.. i modified the existing plugin while it was installed and got this:
Here's the PR: https://github.com/b3rs3rk/gpustat-unraid/pull/6
I need some help creating the pkg file for the pr.
-
1
-
-
I can help troubleshoot the UI refresh in 6.9.0. When I look at the page source I don't see the `setTimeout` listed, where does `$update` get set, i'm guessing this is false? when I call the `setTimeout` command manually in the console the UI does refresh.
    <?if ($update):?>
      setTimeout(gpustat_status, <?=max(abs($display['refresh']),2000)?>);
    <?endif;?>
-
 1
1
-


[PLUG-IN] NerdTools
in Plugin Support
Posted
could rdfind be added? it supports finding duplicate files and replacing them with links. https://github.com/pauldreik/rdfind