

mmag05
-
Posts
19 -
Joined
Content Type
Profiles
Forums
Downloads
Store
Gallery
Bug Reports
Documentation
Landing
Posts posted by mmag05
-
-
I'm using wireguard via PIA. My IP and port keep changing and each time this happens seeding stops. Is there any action I can take to correct this behavior?
-
As the title I'm receiving the error. I just installed the unRAID.net app and got it setup. Added the necessary lines to pfSense for DNS Resolver rebinding and I'm successfully able to access my server. Even performed the USB backup successfully. However, the titled error is showing and I'm not sure how to resolve it. I have no user: 'guest' under users and I'll my shares are set to private. Any pointers are appreciated. Syslog attached if it helps.
-
12 hours ago, falconexe said:
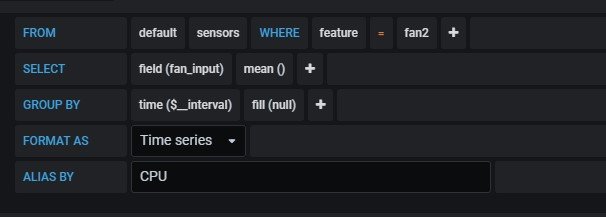
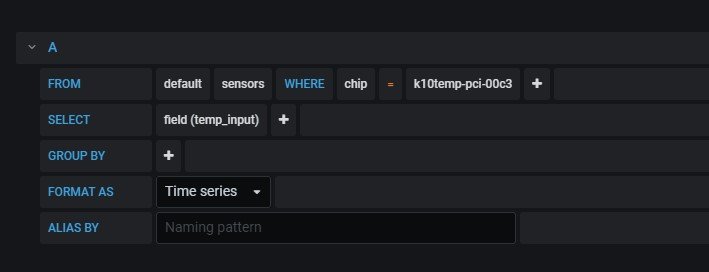
@MrLondon Hey man. Glad we got your AMD Threadripper CPU temps and fans working!!! Can you post pictures of the queries we made so we can document for others who have to use the "sensors" plugin on consumer hardware, instead of IPMI on server hardware? I'll be adding this code to 1.4 as alternate queries.
Here are some screenshots of what I had to use with my 3900x to get fan RPMs and CPU Temp
-
 1
1
-
-
7 hours ago, falconexe said:
Sounds good. I’ll be on the lookout. Thanks.I'd like to know what you come up with if you do. I just got prom/node-exporter setup via docker and communicating with prometheus. It includes a collector for hwmon which according to documentation is where amd_energy is pulled from. However, in grafana when I select prometheus as the data source for a panel I can't find any hwmon that shows or references amd_energy. I know prom/node-exporter is working because all the other collectors are showing in prometheus including a lot of hwmon ones.
Edit: Should also add that I am running 6.9 Beta 29 -
20 minutes ago, SPOautos said:
I'm back home and fixing to try to get started with this dashboard. I've got no idea what any of this stuff is like Telegraf but the gauges look awesome so I want to try to make this happen! lol I'll just say though that I'm not a 'computer guy'....we own a childrens clothing store and I build this out of necessity and then mixed some fun into it with stuff like Plex. So please forgive my lack of understanding lol.
I have a couple questions to get going......I installed your app, but do I also need to install a app called Telegraf?
Should I download the 1.3 file, then when I open the webgui of your app there is a place to import that?
In the template of your app, should I be able to leave it as is? In the template it has a lot of fields in "show more settings" related to Telegraf so I'm guessing I may need to install and set Telegraf up first?
Not the dev but can chime in. You need to install Grafana, InfluxDB and Telegraf from the Community Apps. Then follow the setup steps on page 1 for each app. Once those are setup there's an option in Grafana to import the json for the panel.
-
Still cranking away at modifying your dash and loving it. Learning so much. I was messing around with the Grafana Unraid Stack from testdasi, maybe GilbN here from what I see, and really like the addition of logs on their. I was able to get syslogs onto your dash also. Do you have plans to implement logs as an optional step since it would require other community app dependencies? I think the addition of logs would really suite the dash.
In order to get the logs working in Grafana I had to install grafanaloki and grafanapromtail from community apps. For Promtail I had to add a path with host as root and container as /rootfs for it to read the log directory. I used testdasi's config as a basis with slight mods for the default location of promtail position location and loki's index and chunks. From their I used the same loki queries for the panels as in GUS {job="unraidsyslog"} and {job="unraidsyslog"} |~ "(?i)error[:,]|[:] disabled|(?i)BTRFS error|failed command".
I believe you two may be already collaborating together so maybe this is something they wouldn't mind. Attached are the modded configs I used.
-
 1
1
-
-
20 hours ago, falconexe said:
I've been working on both 1.4 and 1.5 simultaneously. They will still be released separately, but the code overlaps in some areas, so I had to figure some of it out now.
Goal is for a super clean and refined Varken/Tautulli/Plex Dash which will be integrated directly into UUD, sporting some of the same falconexe style/customizations (like working growth trending) found in the UUD.
@Stupifier Thought You Would Appreciate This Sneak Peek...
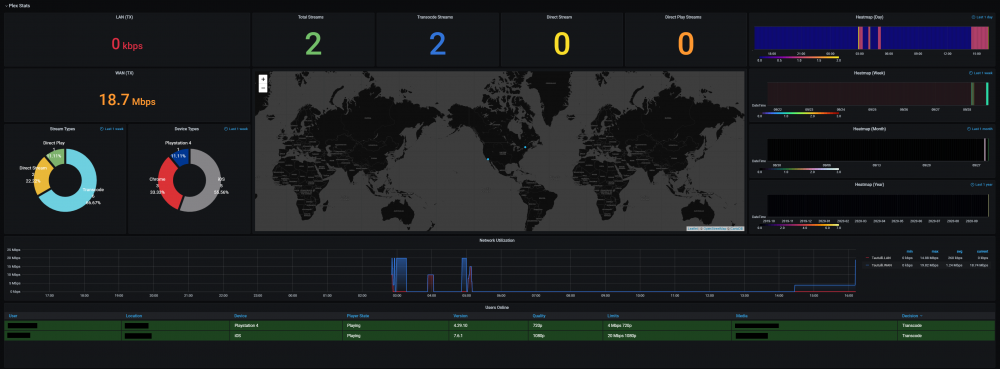
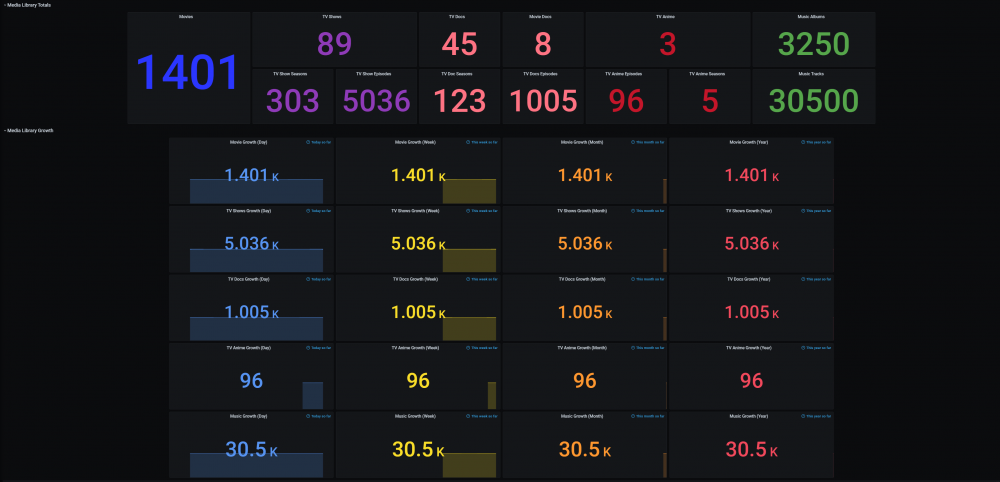
Really liking the way your going with this. Can't wait to the final product. I love all the growth trends for the media.
This week I've been messing around with mvantassel/deluge2influx and used dockerhub to automate a build of it. I used a local docker of deluge to remote to my seedbox and the deluge2influx points to the local instance. Learned of the trick to monitor a seedbox running deluge with a local instance from https://alexsguardian.net/2019/03/31/deluge-influxdb/
-
21 hours ago, falconexe said:
I'm cool with that as long as the following is done. And this goes for anyone who wants to republish our original work within or based on the Ultimate UNRAID Dashboard (UUD).
- Always REFERENCE and LINK This Official UNRAID Forum Topic:
-
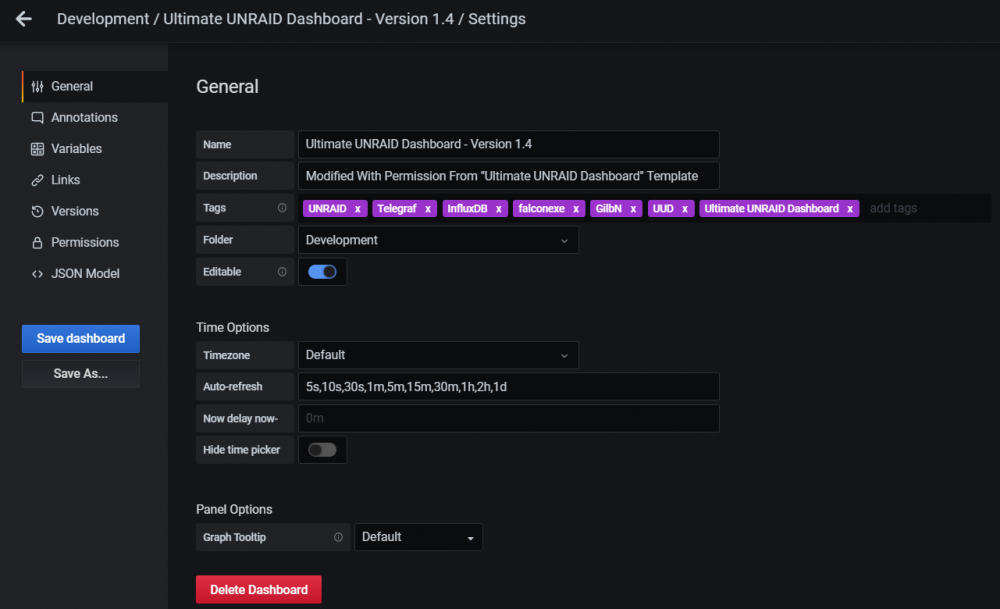
Within Your Modified Dashboard Under Dashboard Settings > General
- Add a Description of: Modified With Permission From "Ultimate UNRAID Dashboard" Template
- Tag "falconexe", "GilbN", UUD, & Ultimate UNRAID Dashboard
-
-
- Support: You Support the Modifications and Additions to the UUD (AKA Your Stuff). However, I am happy to support anyone having issues with original panels from the UUD within this forum, so feel free to send them here.
Fair Enough? 👍
Awesome deal. Will do the above before sharing. Thanks!
-
Thanks for the work. Coming over from Reddit from a post you commented on. On a few groups I belong to people have asked if I’d share the dash I made. It was heavily based on yours with other stuff added so, I don’t feel right sharing it without asking if you mind? I’ll make sure to add a mention to this forum in the description or some other way if you have a better idea.
-
I have the speedtest tracker docker running and it's working well with Organizr. However, I'd like to utilize it for a Grafana Dashboard that requires speedtest-cli and the below added to telegraf. I believe the reason it's not working is because the "/usr/bin/speedtest -f json-pretty" needs to be changed. Any ideas on how to change this for unRAID?
#
# Install speedtest cli from SpeedTest.net first
# https://www.speedtest.net/apps/cli
#
# And then run speedtest once to accept the license
#
[[inputs.exec]]
commands = ["/usr/bin/speedtest -f json-pretty"]
name_override = "Speedtest"
timeout = "1m"
interval = "5m"
data_format = "json"
json_string_fields = [ "interface_externalIp",
"server_name",
"server_location",
"server_host",
"server_ip",
"result_url" ]
-
Loving GUS as I never could get a stack working before. I see you mention it's compatible with UUD. How would a go about adding UUD? I don't see the option to add a new dashboard.
-
Setup and running great. As always thanks for contributions. Only question I have is it possible to mount another directory and have pwndrop store the files there and still have the config in appdata? If not I can just map this apps configs to a share already on my array.
-
I found a script I'd like to use with this plugin but, need some help to determine the path locations it points to. The only one that has me stumped is the TEMP_DB. Any suggestion on where it would be located? I've found the others in the appdata folder.
Paths:
TEMP_DB="/tmp/temp.db"
PIHOLE_ROOT="/etc/pihole"
PIHOLE_FTL="file:$PIHOLE_ROOT/pihole-FTL.db?mode=ro"
GRAVITY="file:$PIHOLE_ROOT/gravity.db"
https://github.com/yubiuser/pihole_adlist_tool/blob/master/pihole_adlist_tool
-
If I don't have multiple cache pools on Beta 25 will this still work? I just have the standard cache pool named "Cache"
-
I’ve been having issues with passthrough using a MSI 2060 Ventus XS. Win 10 VM starts fine using VNC but when I passthrough the 2060 it freezes up unraid and the VM does not start. I’ve been having to do a hard reboot to get unraid backup.
The 2060 is in my second slot with a P2200 in slot one, I guess the primary, for Plex transcodes. IOMMU is enabled and I also assigned the sound from the 2060. Here’s where I think my issue is. The 2060 also has a NVIDIA USB and Serial assigned to it. So there’s four devices all from the GPU in the IOMMU. It’s part of the graphics card, which is weird to me, as I verified this by removing the card and the entries are then gone.
Some other info. One, Plex transcodes work fine with the P2200 as this was verified using the command from Space Invaders video. I can also boot into GUI with the P2200. Second is I’m accessing unraid via webgui headless but, I did have the 2060 connected via HDMI. I’m on a 3900x so no integrated graphics. Last, I stopped all dockers to ensure not of them may be utilizing the 2060.
Any ideas what could be wrong? I’m only I week into using unraid and love it. If I could get this working my ultimate setup would be “complete.” I’m so close I can see the finish line but this has me struggling hard to finish.


[Plugin] Mover Tuning
in Plugin Support
Posted · Edited by mmag05
To use the mover script do I point to just the folder or to the folder/file name? Also, is a preexisting user script the correct format so I could just turn off the schedule for it and point mover tuner to that? I'm utilizing the scripts to stop my torrent container before mover and restart afterwards so that seeding torrents are moved to the array.