mclovin
Members
-
Joined
-
Last visited
-
This was definitely my issues. However, it was not the Kioxia drive that I suspected. I found the culprit was a Lycom DT-120 M.2 Interface Card and Adapter that i used to connect a Samsung 980 m.2 to the motherboard. I would see random high temp warnings for this disk, but it would never show high on the main page. As soon as i removed this pcie to m.2 card, i have not see the error since. I have that same m.2 and Lycom card in my test server now to see if I can reproduce the issue. Marking this as solved as it was definitely NVMe disk related. Hopefully this can help someone else in their troubleshooting. If i do see more issues on the test server, i will add those notes here.
-
Changed the Kioxia NVMe SSD to a Samsung 990 pro last night. First night I have not seen this default error pop up. And wow do these NVE disks copy over fast. 280GB moved over in a couple minutes! Once I see a few days of stability, i will close this out as solved. Thanks again @JorgeB for saving my sanity here. I have been trouble shooting this issue for months.
-
Thank you! If you have seen this before with NVMe disks, I know exactly which one it is. I'm going to order one now and will respond here if it fixes. Appreciate the response @JorgeB
-
Here is the Grok analysis of the segfault error i saw this morning. Analysis Segfault Details: First Incident (03:25:28): Process: smartctl[3047366] Segfault at address 1f1, instruction pointer (IP) 00001544b9f0720a, stack pointer (SP) 00007ffe0fe57f10. Error code 6 (invalid permissions for mapped object, likely trying to write to a read-only memory region). Occurred in libc-2.41.so, suggesting a potential issue in the C library or how smartctl interacts with it. Likely on CPU 0 (core 0, socket 0). Second Incident (03:27:30): Process: smartctl[3052408] Segfault at address 5583dc000000, IP 0000150a32cb7f45, SP 00007ffd2a3533e0. Error code 4 (invalid memory reference, likely accessing an invalid or unmapped address). Occurred in libc.so.6, again pointing to a C library interaction. Also on CPU 0. Commonalities: Both errors involve smartctl and libc, suggesting a possible issue with smartctl’s memory handling or a corrupted library. The different error codes (6 and 4) indicate varying memory access issues, but both are likely related to the same root cause. The timing (close together) suggests a recurring issue, possibly triggered by a scheduled task (e.g., a cron job running smartctl to check disk health). Possible Causes: Bug in smartctl: A known issue in the version of smartmontools installed, especially if it’s outdated or incompatible with the system’s libc. Corrupted libc: The C library itself might be corrupted or mismatched with the system. Hardware Issues: Faulty RAM or disk could cause memory corruption, leading to segfaults. Driver or Firmware Issues: Problems with the storage controller or disk firmware could cause smartctl to crash when querying drives. System Overload: If the system is under heavy load or low on memory, it might cause unexpected behavior. Steps to Resolve Check smartctl Version: Run smartctl --version to check the installed version. Compare it with the latest version from the smartmontools website or your package manager. Update if outdated: bash sudo apt update && sudo apt install smartmontools # For Debian/Ubuntu sudo yum install smartmontools # For CentOS/RHELCheck for known bugs in your version on the smartmontools bug tracker or forums. Verify libc Integrity: Check the integrity of libc: bash sudo ldconfig -v 2>/dev/null | grep libc.soReinstall libc if suspected to be corrupted: bash sudo apt install --reinstall libc6 # For Debian/Ubuntu sudo yum reinstall glibc # For CentOS/RHELInspect System Logs: Look for additional errors around the same time: bash sudo journalctl -k -t kernel -S "2025-08-19 03:25:00" -U "2025-08-19 03:28:00"Check for disk or controller errors that might be triggering smartctl crashes. Test Hardware: Run a memory test to rule out RAM issues: bash sudo memtest86+Check disk health manually with smartctl (run cautiously, as it’s crashing): bash sudo smartctl -a /dev/sdX # Replace sdX with your disk (e.g., sda)If it crashes, try running with debug output: bash sudo smartctl -d sat -a /dev/sdXCheck Scheduled Tasks: Verify if smartctl is run by a cron job: bash sudo crontab -l cat /etc/cron.*/*Temporarily disable any smartctl-related jobs to prevent crashes while troubleshooting. Update System: Ensure the kernel and all packages are up to date: bash sudo apt full-upgrade # For Debian/Ubuntu sudo yum update # For CentOS/RHELDebug with gdb: If the issue persists, run smartctl under gdb to get a backtrace: bash sudo gdb --args smartctl -a /dev/sdX (gdb) run (gdb) bt # After crash, to get backtraceShare the backtrace with the smartmontools community or on a relevant forum. Check for Known Issues: Search for similar issues on X or the web: Keywords: smartctl segfault libc 2025, smartmontools crash libc.so.6. Check smartmontools mailing lists or GitHub issues. If needed, I can perform a real-time search for recent reports (let me know). Next Steps Start by checking the smartctl version and updating it. Verify libc integrity and system updates. If the issue persists, test hardware and inspect logs for clues. Report the issue to the smartmontools community with details (version, system info, logs).
-
I've been troubleshooting some instability that has been leading to crashes about once per month. I turned on syslog and have been capturing and investigation any errors that i can see. The first I found that was ZFS corruption on a NVMe SSD that i dedicated to plex metadata. Since it was a single-disk ZFS pool that did not have parity, I wiped it and changed back to XFS. I only used ZFS for snapshots and replication, but with all of the memory issues i kept seeing, i decided to just go XFS for this disk and will just let plex rebuild in the future if needed. I also had a bunch of Syslinux Configuration paramters set when i was passing hardware through to a VM a long time ago. I removed all of those as i read it could cause the system to not enforce memory mgmt or something along those lines. the one fault i continue to see (just about daily) is a "smartctl[3052408]: segfault at 5583dc000000 ip 0000150a32cb7f45 sp 00007ffd2a3533e0 error 4 in libc.so.6[98f45,150a32c45000+155000] likely on CPU 0 (core 0, socket 0)"Z Each time ive seen it, ive tried to run the errors though either Grok or Google AI to see if it could point me in the right direction. Im at 14 days of uptime right now, so i am hoping that the previous issues that i found will let me get past the 30days - at 30 days, my UI typically gets hung. i also did run mem test for 4 passes and received zero errors there. Diagnostics zip and syslog attached. mclovinii-diagnostics-20250819-1137.zip syslog.latest.txt
-
Really appreciate you taking the time to look into this. I do have nightly zfs replication using Space Invader's script and Squid's user scripts - probably 4 or 5 zfs shares on one side & maybe 10 or so on the other. So the 500 over the course of the month might be accurate in this case. I think the output being seen on the terminal through me off, but I think there are some memory issues as well. Sure enough, the server crashed after i posted this a few weeks ago. I turned on syslog and was able see a memory issue regarding unreadable sectors. I found that my plex contaniers metadata disk (standalone NVMe disk that was using zfs) had errors. I wiped the nvme ssd, formatted with xfs, and let plex rebuild. 11 days and no more of those issues found. Today, i was adding so more libraries and getting things back to normal and i had another crash. I dug back into logs and found errors about access to memory being restricted. I have 64GB installed, and usual usage is around mid-40%. sometimes spikes to 60ish% Below was the first error: Jul 9 00:38:28 McLovinII nginx: 2025/07/09 00:38:28 [crit] 18022#18022: ngx_slab_alloc() failed: no memory Jul 9 00:38:28 McLovinII nginx: 2025/07/09 00:38:28 [error] 18022#18022: shpool alloc failed Jul 9 00:38:28 McLovinII nginx: 2025/07/09 00:38:28 [error] 18022#18022: nchan: Out of shared memory while allocating message of size 32484. Increase nchan_max_reserved_memory. Jul 9 00:38:28 McLovinII nginx: 2025/07/09 00:38:28 [error] 18022#18022: *3059388 nchan: error publishing message (HTTP status code 500), client: unix:, server: , request: "POST /pub/devices?buffer_length=1 HTTP/1.1", host: "localhost" Jul 9 00:38:28 McLovinII nginx: 2025/07/09 00:38:28 [error] 18022#18022: MEMSTORE:00: can't create shared message for channel /devices I have a HD homerun connected to plex, so that is transcoding to memory quite a bit. But Google AI makes this error sound like it is related to unraid UI running out of memory. Which took me down the rabbit hole of learning that leaving your browser open in the Unraid UI can cause it to crash. I noticed that i got these same errors for the last few days and i always leave the browser open. But today between 1300 and 1400 i seemed capture more memory errors but i am unsure if they are related. I attached the syslog of the last few days syslog.txt
-
Thank you! I do share SSH keys between two Unraid servers to replicate ZFS snapshots bi-directionally. Is there a certain log i can check to ensure its not from that? Thanks again for the quick reply and steps to follow
-
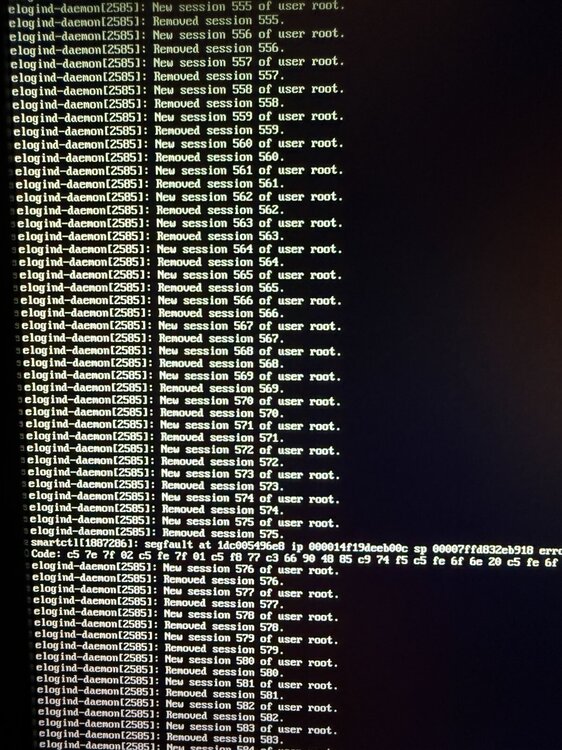
I noticed this being displayed on my terminal screen when I walked by it this morning. I always seem to hit some type of issue at 30 days of uptime - I'll go to log into the server and cant hit the IP address - the terminal screen is completely dark. Only way to bring back online is hard reboot and ive been meaning to schedule and automated restart. I am currently at 27 days, 7 hours of uptime now, so I'm expecting a repeat soon. Maybe I'm catching the issue this time? But also want to make sure it is not something malicious. Server config has been moved around through quite a bit of hardware over the last 5 years, so maybe it could be something with my config. Diagnostics attached. Thanks in advance for any info on thismclovinii-diagnostics-20250612-1456.zip
-
I have continued to run into this issue. I have also been seeing it more often after moving to 7.0. Props to @ClintonRH for providing a fix on different post - Thank you! For noobs like me...to ssh: From Windows, search "cmd" to open command prompt > type: ssh root@[your.ip.address] > run the below command. "SSH into server and run /etc/rc.d/rc.nginx restart This restarts the webgui. Now my main tab is useful again without restarting the entire server."
-
ill check it out. Thank you!!
-
Hello, When i add up the folders of the containers/VMs that live on the 2x 1TB NVMe raid 1 zpool (pool name: cache_nvme) I would expect to see it around 350GB. I saw an alert pop up on my phone today that this cache pool hit 681 GB (71%) I attached the diagnostics file. Is there anywhere I can look in the diagnostics file to pinpoint this growth? All folders look to be as i would expect when i look at those in the GUI file explorer. Also tried to look through QDirStat and all seemed normal there. thanks in advance mclovinii-diagnostics-20240920-1343.zip
-
Thanks for the quick info Jorge!! Ill keep an eye out for 6.12.7. & and ill try the 30-second wait if i see it again. Appreciate the help!
-
Correct. "Main" tab was accessible, but it only displayed the various sections with no info within each section (array devices, pool devices, the ZFS master plugin). The array operation portion on the bottom was still there and working. All other tabs in the UI seemed accessible. I saw it yesterday morning for the first time and a reboot brought back the main tab. Today was the second time and a reboot brought it back again. currently running v6.12.6
-
HI all, Two days in a row my Main tab in the UI goes blank. I tried other browsers to make sure it was not a browser issues and it was the same. Everything seems to be online (shares, VMs, containers) - just the main tab of the UI is blank. Has anyone seen this issue? Or way to resolve? Thanks!
-
Hi All, Ran into an issue a little while back and was curious if anyone experienced the same. Current build is a asus prime x570 pro, ryzen cpu, msi 3060 passed through for gaming vm, and quite a few 7200/5400 HDDs and 2.5 inch SSDs for persistent storage (nvme SSD used for system cache) - running v6.9.2. Since i run Plex as a container, as well as run a few VMs, i had the idea to add a PCIe NIC so that i can reduce the amount of traffic through the single 1GbE port on the mobo. Im probably not saturating that single mobo port, but im always tinkering and being able to add hardware is one of the aspects of unraid that i really enjoy - and this approach ensured i wouldnt be stomping on my plex traffic while I am gaming or downloading. So i followed space invaders tutorial on passing the PCIe NIC directly through to the VMs by updating the sys config file in Flash. Everything went as expected...i passed it through, giving 1 x port to my gaming VM and 1 x port to the 2nd VM i use for other tasks like downloading. The issue started with my 2nd VM that i download with. It would have an active connection to my VPN, but as soon as it started to pull a good amount of data via torrent, i would lose my RDP connection as well as the download connections. After a minute it would all return to normal, but it would do it again anytime i would restart the download. So i disabled the pcie nic in the VM settings and reenabled the onboard NIC. This cleared the issue. I continued to use the pcie NIC for my gaming VM and everything has been great on that side...but i now do not use the second port and do not do any LCAG/trunking since my core switch is kind of trash. Think passing through 2 NICs on the same pcie card to 2 x VMs is the issue? Or maybe am i saturating the pcie card and amount of PCIe lanes that it has access to? Thank you all in advance!!