





flymcb
Members
-
Joined
-
Last visited
-
Yes, I tried each pair separately before reinstalling. The first pair last 4 days before crashing. The second pair was around 6 hours. The memory speed is 2667 I've tried to keep notes, so I think I have the right diagnostics uploaded. The two attached now are right after the crashes on each pair. I had previously disabled most plugins and all docker containers except Plex. I didn't want to lose too much uptime on Plex. I'm currently spinning up an old laptop to migrate plex to, so I can do a proper Safe Mode test. I was also experiencing crashing on 7.3.2 - would an even earlier version be more stable for any reason? Thanks as always! tower-diagnostics-20260909-1658.zip tower-diagnostics-20260909-1006.zip
-
Hi Again, So I completely reset BIOS settings and set them per the recommendations for Ryzen CPUs. Still crashed and put RAM pair in A2/B2. Crashed again and tried the other pair of RAM in A2/B2 with another crash. Plex put out an update with the following information: After completing the update, the server was running for 9 days and I thought I may be in the clear, but it eventually locked up again. I've now created a script that is logging the sensor data to monitor voltages on the PSU. Would this exercise be a waste of time? I am trying to avoid spending money on a new PSU or replacing the CPU+MB unless they are truly the culprit. I've also started a post on the Plex support forum with my logs to help diagnose the potential problem there. The server crashed at 09:25 on Sep 18. Nothing is jumping out at me, but do you see anything in the diagnostics that provide any insight? Thanks as always! tower-diagnostics-20260918-0954.zip syslog-192.168.50.6 (7).log
-
Hi again. I have a quick follow up question/thought. A while back I was getting crashes when mover was running. I changed from turbo to normal write mode and the crashes stopped, but I thought my SATA cards may have been failing or getting overloaded. Would any of the errors I've been experiencing recently be caused by failure of either of these two cards? https://a.co/d/0ghUwSWU I imagine there would be other error messages associated with that, but am having difficulty remembering what happened with my previous issue. Thanks again
-
Thanks as always for the incredibly helpful post, JorgeB. I will try all that and report back.
-
After roughly 6 days of stability, I had another crash today. I have removed most plugins and docker containers and it had been running quite well, leading me to think I was in the clear ☹️ I've attached the diagnostics from immediately after the crash that occurred around 13:41. The following error occurred in sys-log on the reboot: Sep 4 13:44:02 Tower kernel: x86/amd: Previous system reset reason [0x08000800]: an uncorrected error caused a data fabric sync flood event Sep 4 13:44:02 Tower kernel: microcode: Current revision: 0x08701035 Sep 4 13:44:02 Tower kernel: mce: [Hardware Error]: CPU 8: Machine Check: 0 Bank 5: bea0000000000108 Sep 4 13:44:02 Tower kernel: mce: [Hardware Error]: TSC 0 ADDR 1ffff81ecc156 MISC d01a000000000000 SYND 4d000000 IPID 500b000000000 Sep 4 13:44:02 Tower kernel: mce: [Hardware Error]: PROCESSOR 2:870f10 TIME 1788543759 SOCKET 0 APIC 5 microcode 8701035 Is the next step running in safe mode only? Do you have any further recommendations? Does the error above confirm CPU failure? As always, thanks for all the help! tower-diagnostics-20260904-1351.zip
-
Thank you both for your replies. I was not messing with JetKVM leading up to the crashes. They seem to be very random, timing wise. Interesting catch from the diagnostics, JorgeB. I hadn't noticed that one. I installed the current BIOS trying to deal with the crashing that has started. I don't believe any other BIOS settings were messed with, other than the guidance from the FAQ, and the server had been running comfortably for some time prior to this issue coming up. Is there a way I can more specifically identify which of those components could be the failure point? I currently have the server running, have deleted most plugins, deleted the docker image, and only have rebuilt docker with plex installed and running. I'll leave it for a while and see if it stays running for a few days, otherwise it'll be a full safe mode for a few days.
-
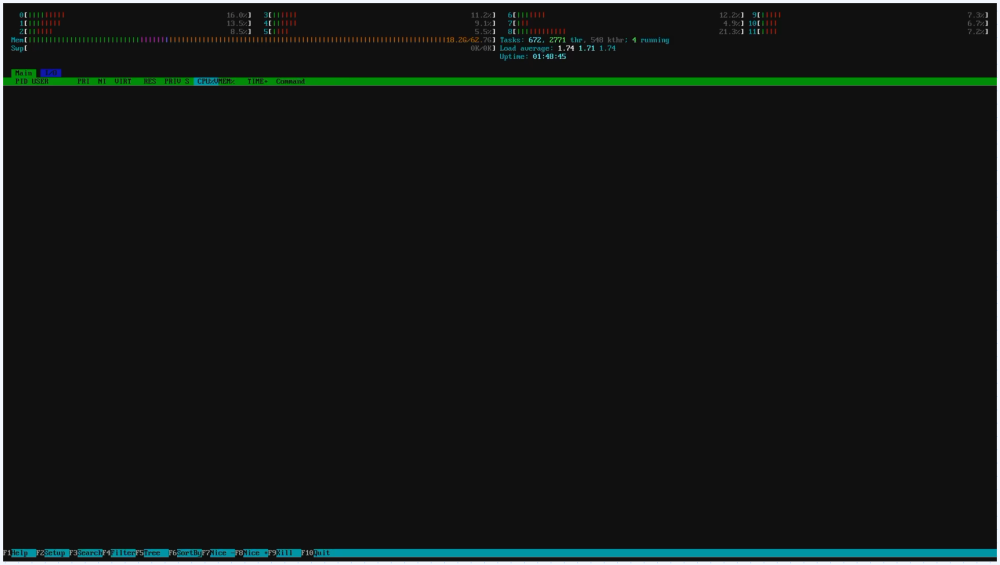
I have become quite frustrated as the server no longer runs more than 2 days without a hard lockup. I have run memtest over night with no errors. I have followed the guidance for Ryzen power states and RAM. The server had previously been running quite stably for a few years with the current hardware. When I checked the video output at the most recent crash, the display is attached. I can not pinpoint any specific activity prior to the crash and the system log has no errors leading up to the crash. Any help would be greatly appreciated! tower-diagnostics-20260828-2319.zip syslog-192.168.50.6 (4).log
-
As MowMdown suggested, it was most likely a docker or plugin. Since the issue was persisting with docker offline, it had to be a plugin. I removed the majority of my plugins and the issue has stopped. I tried doing a couple at a time, but ran out of time. Here is the list of dockers that were removed from my server: appdata.backup.plg - 2026.03.13 (Up to date) ca.update.applications.plg - 2026.04.14 (Up to date) disklocation-master.plg - 2026.06.02 (Up to date) dlandon.cache.dirs.plg - 2025.03.06 (Up to date) docker.versions.plg - 2026.03.06 (Up to date) dwmemtester.plg - 2025.08.21 (Up to date) dynamix.file.integrity.plg - 2025.11.14 (Up to date) dynamix.system.temp.plg - 2025.11.14 (Up to date) file.activity.plg - 2026.05.03.0212 (Up to date) folder.view.plg - 2025.01.11.1 (Unknown to Community Applications) gpustat.plg - 2026.05.19 (Up to date) open.files.plg - 2025.10.04a (Unknown to Community Applications) parity.check.tuning.plg - 2026.04.24 (Up to date) unRAID6-Sanoid.plg - 2.3.0 (Up to date) zfs.master.plg - 2024.12.09.104 (Up to date) Spin down behaviour is now back to normal. From some of my searching online, I think the problem may have been ZFS Master, but I haven't had the time to continue adding back these plugins and see if the problem comes back. Do you have any of these in common?
-
Besides shutting off one by one, do you have any recommendations of where to look in the diagnostics or terminal to figure out which one is the problem? I tried htop but couldn't see anything that stood out
-
Thanks for the info. I may have underestimated when the issue started, so I only downgraded to 7.3. I'm hoping to help find the bug in my case, but may need to try the same
-
I just tried and yes, they spin down (and remain down) in maintenance mode.
-
I have recently found that the disks in the array are not staying spun down. When I force a spin down, or when they automatically spin down after 15 minutes, they will soon after spin up again. I have tried to see what files are causing it, but there isn't any activity that is correlated in the file activity monitor plugin. I have changed all docker paths to cache/appdata. The behaviour has been good until recently. I tried downgrading to 7.3 from 7.3.1, but saw no difference, so I updated back to 7.3.1. When I look at 'Main' page, I do not see any reading/writing that should be causing a spin up. They are also running warm. Any help would be greatly appreciated! Diagnostic files attached. Edit to add - I have tried stopping all dockers, but they continue to wake themselves. tower-diagnostics-20260605-2034.zip
