

Viaduct
-
Posts
76 -
Joined
-
Last visited
Content Type
Profiles
Forums
Downloads
Store
Gallery
Bug Reports
Documentation
Landing
Posts posted by Viaduct
-
-
@BinHex
v2.99 is reported on forums as broken with a new v3.00 out.
Is there a plan to update the docker?
Thanks
V
-
I did a powerdown on the console and it shutdown ok.
Docker came up ok, but orphaned my Plex container. A 'force update ' fixed it.
All happy now
V
Sent from my iPhone using Tapatalk -
Is there a how to for getting email alerts in zoneminder on unraid working?
I can't see any reference to ssmtp in the appdata folder to enter any config.
V
Sent from my iPhone using Tapatalk -
Ok.
I killed the dockerd process:
kill PIDand have the Unraid GUI back (with some warnings on the dashboard for missing docker.sock)
How do I restart the docker daemon?
V
-
Had a docker fail an update. Now the Unraid UI is unresponsive. Telnet still works, but docker seems hung.
docker ps -aHangs and have to do a Ctrl - C to come out of it.
All the containers are working though i.e. Plex and Zoneminder are still running and are fully responsive, just seems the parent docker process has hung.
Any tips to un hang it?
I fear powerdown will just hang on trying to stop docker and I would need to do a hard reset.

How do I stop docker cleanly?
Thanks
V
-
This looks awesome, any chance of having it all bundled up into a plugin or docker container?
I'm sure it would be doable as a plugin. Docker container might be difficult since some of the scripts might need native access to the OS. It's not within my capability though, and it would be a weird plugin since it would be dependent on the dockers too.
Sent from my iPhone using Tapatalk
-
I had similar issues a few months ago with finding a local server. It was when I was messing about with different plug in and docker containers, testing the initial setup, then recreating the server in a different docker. Not sure what the cause was, but it seemed to sort itself out. My impression was that plex doesn't like recreating the same server with same name, owner and ip address. It's like it gets confused. I think internally it has a unique id and when there's two instances of the server with same name and ip address but different unique id it just fails to find it.
At times I could find it over wan, but not over lan. Also some pc's found it, eg hard wired into same router, whilst Wi-Fi didn't. It was very strange. It just fixed itself without any intervention from me. I did the management from the interfaces that could see it ie wan or the hard wired PC. Now it's behaved for ages. I assumed that plex forgets servers it hasn't seen for a while and thus sorted out its internal confusion. I'm just guessing. There are plex logs to be looked through, but they didn't add anything to help me at the time. YMMV.
Sent from my iPhone using Tapatalk
-
OK. I've started a thread in the user customisations board.
https://lime-technology.com/forum/index.php?topic=52220.0
Any corrections or suggestions for improvement is very welcome!
-
apcupsd.sh
Script to monitor values from the UPS.
** A working influxdb setup is required - see opening post **
**Disclaimer: I am not a programmer and thus please use the scripts at your own risk. Please read the script to understand what it is trying to achieve. There is no error trapping in it and no check to see if it is already running, so in theory if the script running time is longer than the crontab interval you could end up in a ever increasing system load and potentially crash the server.**
This uses apcaccess to get values from the UPS such as 'time on battery', 'battery %charge', 'load in %', 'time left on battery', 'unit temperature'.
#!/usr/bin/php
<?php

$command = "apcaccess";
$args = "status";
$tagsArray = array(
"LOADPCT",
"ITEMP",
"TIMELEFT",
"TONBATT",
"BCHARGE"
);

//do system call

$call = $command." ".$args;
$output = shell_exec($call);

//parse output for tag and value

foreach ($tagsArray as $tag) {

preg_match("/".$tag."\s*:\s([\d|\.]+)/si", $output, $match);

//send measurement, tag and value to influx

sendDB($match[1], $tag);

}
//end system call


//send to influxdb

function sendDB($val, $tagname) {

$curl = "curl -i -XPOST 'http://influxDBIP:8086/write?db=telegraf' --data-binary 'APC,host=Tower,region=us-west "
.$tagname."=".$val."'";
$execsr = exec($curl);

}

?>
Nothing special in grafana for this since they are simple values returned. I modified the LOADPCT by multiplying it with the rated capacity of my unit to get the power in watts.
I run this every minute in crontab:
* * * * * /mnt/cache/appdata/myscripts/apcupsd.sh &>/dev/null 2>&1
-
ipmi.sh
Script for monitoring IPMI parameters.
** A working influxdb setup is required - see opening post **
**Disclaimer: I am not a programmer and thus please use the scripts at your own risk. Please read the script to understand what it is trying to achieve. There is no error trapping in it and no check to see if it is already running, so in theory if the script running time is longer than the crontab interval you could end up in a ever increasing system load and potentially crash the server.**
This requires ipmi-sensors to be installed. I use the excellent dmacias IPMI plugin which installs this.
You need to edit the script to add the devices you want measuring in the $tagsArray statement. Different motherboards will have different values. Run ipmi-sensors from the command line to see what yours are. I'm not clever enough to write a script that does it automatically. And you will need to change the parameters mentioned in the first post in the curl statement. You will need to use a unix type editor to do it e.g. Notepad++ such that the correct line endings are in the file. Save them somewhere that crontab can access them (mine are in /mnt/cache/appdata/myscripts/).
Note that the tagName cannot have spaces in, so I have had to add an extra line to remove the spaces from the string.
#!/usr/bin/php
<?php

$tagsArray = array(
"CPU_FAN1",
"REAR_FAN1",
"REAR_FAN2",
"MB Temp",
"CPU Temp"
);


//do system call

$call = "ipmi-sensors";
$output = shell_exec($call);

//parse output for tag and value

foreach ($tagsArray as $tag) {

preg_match("/".$tag.".*(\b\d+\b)\..*$/mi", $output, $match);

//send measurement, tag and value to influx

sendDB($match[1], $tag);

}
//end system call


//send to influxdb

function sendDB($val, $tagname) {
$tagname2 = str_replace(' ', '', $tagname);
$curl = "curl -i -XPOST 'http://influxDBIP:8086/write?db=telegraf' --data-binary 'IPMI,host=Tower,region=us-west "
.$tagname2."=".$val."'";
$execsr = exec($curl);
}

?>
I run this script every 5 min in crontab:
*/5 * * * * /mnt/cache/appdata/myscripts/ipmi.sh &>/dev/null 2>&1
Grafana does not need any specific setup to show this metric since it is a simple value. The measurement IPMI will appear in the list of measurements to select.
To show fan speed and temp on the same graph, move the temps to the right axis and the fans to the left axis.
-
spin.sh
Script for monitoring the spin state of the HDs with hdparm
** A working influxdb setup is required - see opening post **
**Disclaimer: I am not a programmer and thus please use the scripts at your own risk. Please read the script to understand what it is trying to achieve. There is no error trapping in it and no check to see if it is already running, so in theory if the script running time is longer than the crontab interval you could end up in a ever increasing system load and potentially crash the server.**
The script uses hdparm to check if the value is standby.
You need to edit the script to add the devices you want measuring in the $tagsArray statement. I'm not clever enough to write a script that does it automatically. And you will need to change the parameters mentioned in the first post in the curl statement. You will need to use a unix type editor to do it e.g. Notepad++ such that the correct line endings are in the file. Save them somewhere that crontab can access them (mine are in /mnt/cache/appdata/myscripts/)
#!/usr/bin/php
<?php

$tagsArray = array(
"/dev/sdc",
"/dev/sdd",
"/dev/sde",
"/dev/sdg",
"/dev/sdh",
"/dev/sdi",
"/dev/sdj",
"/dev/sdb",
"/dev/sdf"
);


//do system call and parse output for tag and value

foreach ($tagsArray as $tag) {

$call = "hdparm -C ".$tag;
$output = shell_exec($call);
if (strpos($output, 'standby') !== false) {
	$idle = 0;
}
	else {
		$idle = 1;
	}

//send measurement, tag and value to influx

sendDB($idle, $tag);

}
//end system call

//send to influxdb

function sendDB($val, $tagname) {

$curl = "curl -i -XPOST 'http://influxDBServerIP:8086/write?db=telegraf' --data-binary 'HDSpin,host=Tower,region=us-west "
.$tagname."=".$val."'";
$execsr = exec($curl);
}
?>
This script runs pretty quickly, so I have mine setup to run every minute, but that might be overkill.
* * * * * /mnt/cache/appdata/myscripts/spin.sh &>/dev/null 2>&1
Grafana setup
I have this set up as a stacked bar chart in grafana.
The query for each device reads as follows in the Metrics tab:
FROM default HDSpin WHERE +
SELECT field(/dev/sde) sum() +
GROUP BY time(1m) +
ALIAS BY disc name Format as Time Series
At the bottom I have :
Group by time interval >60s
The display tab has
Draw Mode
Bars checked
Stacking and Null value
Stack checked
Hover info
Stacked value individual
-
hdtemp.sh
Script for monitoring HD temperatures via smartctl.
** A working influxdb setup is required - see opening post **
**Disclaimer: I am not a programmer and thus please use the scripts at your own risk. Please read the script to understand what it is trying to achieve. There is no error trapping in it and no check to see if it is already running, so in theory if the script running time is longer than the crontab interval you could end up in a ever increasing system load and potentially crash the server.**
This uses smartctl to get the information output from the SMART for the device. Needless to say SMART needs to be turned on for the device otherwise it won't work. But I can't think of a reason why you wouldn't want to have SMART turned off in any case.
You need to edit the script to add the devices you want measuring in the $tagsArray statement. I'm not clever enough to write a script that does it automatically. And you will need to change the parameters mentioned in the first post in the curl statement. You will need to use a unix type editor to do it e.g. Notepad++ such that the correct line endings are in the file. Save them somewhere that crontab can access them (mine are in /mnt/cache/appdata/myscripts/)
#!/usr/bin/php
<?php

$tagsArray = array(
"/dev/sdc",
"/dev/sdd",
"/dev/sde",
"/dev/sdg",
"/dev/sdh",
"/dev/sdi",
"/dev/sdj",
"/dev/sdb"
);

//do system call and parse output for tag and value

foreach ($tagsArray as $tag) {

$call = "smartctl -A ".$tag;
$output = shell_exec($call);
preg_match("/Temperature.+(\d\d)$/im", $output, $match);

//send measurement, tag and value to influx

sendDB($match[1], $tag);

}

//end system call


//send to influxdb - you will need to change the parameters (influxserverIP, Tower, us-west) in the $curl to your setup, optionally change the telegraf to another database, but you must create the database in influxdb first. telegraf will already exist if you have set up the telegraf agent docker.

function sendDB($val, $tagname) {

$curl = "curl -i -XPOST 'http://influxServerIP:8086/write?db=telegraf' --data-binary 'HDTemp,host=Tower,region=us-west "
.$tagname."=".$val."'";
$execsr = exec($curl);

}


?>
Since HD temp doesn't change that quickly I have made the script run every 5 minutes in crontab:
*/5 * * * * /mnt/cache/appdata/myscripts/hdtemp.sh &>/dev/null 2>&1
Grafana does not need any specific setup to show this metric since it is a simple value. The measurement HDTemp will appear in the list of measurements to select.
-
Scripts for Server Monitoring using Influx DB and Grafana without Telegraf agent
Thread for discussing user scripts to push data into Infuxdb.
Any system command that lists useful data can be parsed to send data into influxdb via a script.
I use the atribe docker for telegraf, influx and grafana from Community Applications plugin. They worked pretty much out of the box. Set these up first before adding any scripts, just to test that influxdb and grafana are actually working properly, and that the telegraf database within influxdb is already set up and accepting data. I'm not going to go into any detail on setting up these dockers, they seemed quite easy to setup. The only bit that needed specific setup was setting the datasource in grafana, but it was fairly self explanatory.
Data can be sent to Influxdb direct without requiring the telegraph agent. See influxdb man pages - Writing Data with the HTTP API:
https://docs.influxdata.com/influxdb/v1.0/guides/writing_data/
The basic command is :
curl -i -XPOST 'http://[color=red]influxServerIP[/color]:8086/write?db=[color=red]telegraf[/color]' --data-binary ’[color=red]measurementName[/color],host=[color=red]Tower[/color],region=[color=red]us-west[/color] [color=red]tagName[/color]=[color=red]value[/color]'
Specific bits in this to change are:
Usually static for your setup and same for all your scripts:
influxServerIP: change this to your InfluxDB server IP
telegraf: this can be changed to a different database if required. I just added the data to the existing telegraf database which saves adding another datasource in grafana
host: the host name of the server e.g. Tower or Unraid or whatever - best use the same as telegraf
region: region where you are
Usually change per script depending on what it is designed to measure:
measurementName: the type of measurement as a group, e.g. HDTemp
tagName: the specific thing/device/tag the measurement is measuring e.g. /dev/sdx
value: the numerical value to store
Note that spaces in the names can be a problem, so you might need a line in the script to remove spaces from the thing that you are measuring.
I'm sure there are better, more sophisticated ways of sending data direct to influxdb including specific php libraries, but I am not a developer, so I had to keep it simple.
So you just need a script to parse the data for measurementName, tagName and value and send it with the curl command. Simples!
The graphs can be generated in Grafana in just the same way as the graphs from telegraf (if you stick to sending the data to the telegraf database in influxdb). Otherwise you will need to set up another datasource in grafana which complicates this a little, but can be done.
I store my scripts in a folder called myscripts on appdata. I'm not entirely sure this is the safest place to keep them since anyone with smb access to this folder could change the scripts and then there could be trouble, so any advice on this is welcome.
Don't forget to make the script executable:
chmod +x /mnt/cache/appdata/myscripts/script.sh
The scripts are run using cron. The list of active scripts can be edited by the
crontab -e
command.
This defaults to the vi editor to edit the text which I find painful to use. In terms of basics there are plenty of useful guides on the net on how to use it, but essentially you need to go to the bottom of the file (type capital G), then insert a line below the current one ready for editing (type * o). Insert your crontab line e.g.
* * * * * /mnt/cache/appdata/myscripts/hdtemp.sh &>/dev/null 2>&1
Then <esc> (to stop editing mode)
Then type :wq <enter> (with the colon) to save the file again.
You can check the line is correct with
crontab -l
which lists the crontab file.
All stars in the crontab will run the script every minute. If you want it to run every 5 minutes use
*/5 * * * *
instead of 5 stars.
Some scripts to get started with:
HDTemp.sh - measures HD temperature with smartctl
https://lime-technology.com/forum/index.php?topic=52220.msg501122#msg501122
spin.sh - gets the spin state of the HDs with hdparm
https://lime-technology.com/forum/index.php?topic=52220.msg501124#msg501124
IPMI.sh - gets values from IPMI with ipmi-sensors (needs ipmi-sensors installed)
https://lime-technology.com/forum/index.php?topic=52220.msg501125#msg501125
apcupsd.sh - gets info from UPS from apcaccess
https://lime-technology.com/forum/index.php?topic=52220.msg501126#msg501126
-
 1
1
-
-
No worries guys. I'll do a how to guide soon.
I'll tidy the scripts up over the weekend and post something. Possibly in a new thread.
I have absolutely no idea about github, I'm not a developer or programmer and the last time I wrote anything resembling a program or script was in the 80s in BASIC! So I probably can't vouch whether the scripts are safe to run or not, nor can I probably support users where the scripts might not work. But, happy to post them as a starting point and others more capable can refine them.
Sent from my iPhone using Tapatalk
-
I would also love to have hddtemp in the metrics too. Is that the same problem, need plugin?
Hi,
I figured I wasn't clever enough to get the docker to do temperatures and wasn't really sure if it was possible to do it from the docker anyway, so I decided to write my very first PHP script!
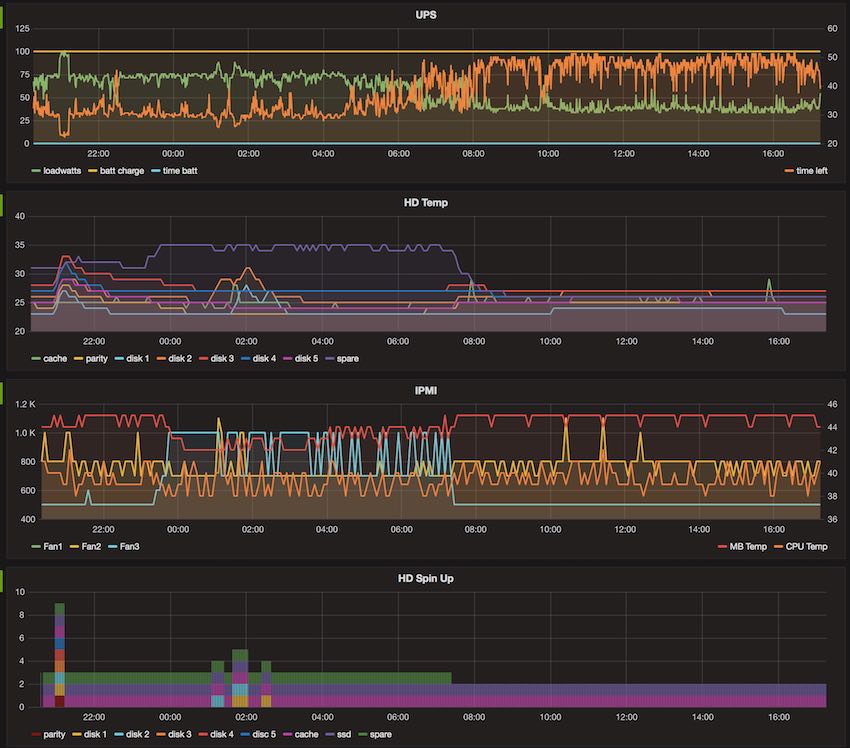
I managed to get sensible outputs for 'HD Temp' parsing the output of 'smartctl' for each of my disks, and luckily they still sense temperature without spinning up and when spun down. I used 'apcaccess' for UPS data so I can get the load on my UPS in watts (I have cable modem and router on the UPS as well as the server). I used 'hdparm' for spin status. And I used ipmi-sensors for fan speed and MB/CPU temp. Sending the data to influxdb via curl is quite straightforward.
I use crontab to invoke the scripts which reside in my appdata folder.
I have no idea if this is a sensible way of doing it and the scripts are very rough, but seems to work!

-
+1
Got done too.
Got an email saying Dynamix updated!
Thanks for the instructions to fix. All sorted now.
Sent from my iPhone using Tapatalk
-
Yup. I've a Roku for the kids and " 'er indoors ". And of course for when I'm feeling lazy. Works great.
Plex can be a bit funny sometimes. Could try changing some of the client settings. I'm sure there is a setting for ' direct play ' or 'prefer direct play' which helps miss out the transcoding step.
Also your client needs to be able to play the codec if you are direct playing the material else plex has to transcode. Each client has its own preference.
Which codec and client was having trouble again?
Sent from my iPhone using Tapatalk
-
I presume it is possible to run the docker run command from the shell via putty?
If one knows the correct command it could be done via the shell?
Sent from my iPhone using Tapatalk
-
Wmc never did any transcoding. If you've got a full htpc use kodi on that and leave plex for the mobile stuff
+1
Use kodi for playback on the htpc and plex for the library. There is a kodi plugin which keeps it all in sync.
This means that kodi plays the files direct from disc but uses the metadata from plex for the ui.
Also if you can get the directshow plugin for kodi to work you can use the excellent madvr filter for upscaling the content to your screen.
Sent from my iPhone using Tapatalk
-
Maybe PLEX does not like the nginx reverse proxy. I have it I the back of my mind that it exposes another port or two also except for the webui one. Maybe I'm dreaming it.
Sent from my iPhone using Tapatalk
-
Hi. Still working good here. Had a go at some basic dashboards but still learning.
Can't see any metrics for temperature though. Both netdata and munin get the CPU temp ok via volume mapping. I presume need to add a plugin into the docker telegraf config folder? Or is it something basic in my setup? Missing lm sensors or something.
I would also love to have hddtemp in the metrics too. Is that the same problem, need plugin?
I can really see the potential of the telegraf/influxdb/grafana method though. Configurable to the nth degree!
Sent from my iPhone using Tapatalk
-
Woo hoo! Working great thanks!
Sent from my iPhone using Tapatalk
-
Great. Thank you. I'll delete my instance and config and start afresh with the CA one later.
Sent from my iPhone using Tapatalk
-
Small error in parity check ?bug.
My scheduled monthly parity check kicked in as usual. But, I had a power cut a quarter of the way through. I have a ups , and apcups triggered a shut down due to estimated remaining time on battery less than set in config. I watched powerdown script shut down the server cleanly with just over 25% parity check done.
On reboot, Now the gui says parity valid, checked on 1 September. I know that the parity check did not complete. Last full check was 1 August I think.
Sent from my iPhone using Tapatalk


[Solved] Docker hang - help please
in General Support
Posted
30 Gb and roughly only 45% full.
Sent from my iPhone using Tapatalk