

atribe
-
Posts
120 -
Joined
-
Last visited
Content Type
Profiles
Forums
Downloads
Store
Gallery
Bug Reports
Documentation
Landing
Posts posted by atribe
-
-
On 10/17/2023 at 4:13 PM, jit-010101 said:
How to fix Grafana Permission Errors properly
(on first start and later)
Its not ok to set the permissions of the appdata/grafana folder anything else then root or increase the permissions blindly.
to correctly fix this there needs to be an extra parameter added do that the internal user id using the same id as the root user from unraid
Grafana Container -> Edit -> Advanced -> Extra Parameters -> add:
--user 0after that make sure owner of /mnt/user/appdata/Grafana is root:root and grafana will start just fine:
chown -R root:root /mnt/user/appdata/GrafanaI just updated the xml template to now include the extra parameters by default.
<ExtraParams>--user "$(id -u)"</ExtraParams>
-
 1
1
-
-
8 minutes ago, Fredrick said:
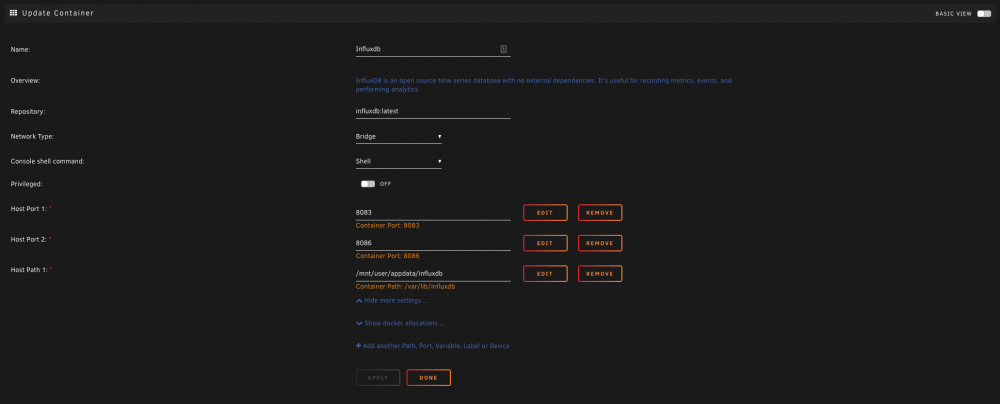
Anyone that can help me get access to my influxdb remotely? I want to be able to add some metrics from my VPS to InfluxDB, but I'm struggling with connecting.
I've forwarded port 8086 in my firewall to my Unraid server which is set up with the same port. I don't understand but I still cant get to it. Is there anything I need to change in the influxdb configuration files?

Try using InfluxDB Studio to trouble shoot the connection. https://github.com/CymaticLabs/InfluxDBStudio If you can figure out how to connect to it manually you should be able to figure the rest out.
-
1 hour ago, JaseNZ said:
Just upgraded to Version: 6.9.0-rc1 and Telegraf has broken with the following error.
Everything was working fine before hand
Anybody else found this has happened or perhaps has a solution ??
I just changed from telegraf:alpine to telegraf:latest in the xml, see if changing to that image fixes things.
-
7 hours ago, Nanobug said:
I'm having a rough time trying to sort out my databases with the correct name and all, since it's a pain to use the commands.
I really tried looking at the documentation, but for some reason, it's not working.
After spending some time on Google, I found out that some command works if I type
influx -executebefore the command database command.
Like this:influx -execute 'SHOW DATABASES'And when you're creating a user with the quotation marks, it doesn't work.
Can someone link me the correct documentation, or tell me how it's done properly?You can use this tool to view and manage influxdb database https://github.com/CymaticLabs/InfluxDBStudio/releases
I use it and like it better than the command line.
-
7 minutes ago, rragu said:
I recently set up Telegraf+InfluxDB+Grafana (+HDDTemp).
In order to get Nvidia GPU stats, I changed my telegraf repository from alpine to latest. Life was good.
However, I've just noticed that, in the Docker tab of unRAID, the Telegraf icon is missing and the docker container name is no longer a link to edit the template. If I click the docker icon, I only have the options of Console, Start, Stop, Pause, Restart, and Remove.
My Grafana dashboard is still populating properly. So, Telegraf still appears to be doing its job.
That said, can anyone help me figure out what I broke? Or is this just the price of switching the repository (I would switch back to confirm this but as stated, I can't edit the template)?
Probably the cost of switching the repo. See the bottom left of you screenshot? Libray/telegraf. You customized it. You might be able to go into the file system where that template info is stored and put the icon there.
-
10 minutes ago, Greyberry said:
Hi,
I am moving from a native install (without docker) on a VM to this docker-image on UNRAID and so far everything is good.
But I am not that experienced with docker, so I got this issue:
In my original installation I made some edits in /etc/grafana/grafana.ini which I want to move to the docker-container as well.
[analytics]
reporting_enabled = false
check_for_updates = false

[security]
admin_user = [censored]
admin_password = [censored]

[users]
allow_sign_up = false

[auth.anonymous]
enabled = true
org_name = Main Org.
org_role = Viewer
With this settings i managed that users could browse grafana without login, but login was required for editing the dashboards. In addition it turned off analytics.
I know i can edit the file also within the docker-container but as far as I know, this is not the proper way to do it. is it?
The part that the admin password is set via "Container Variable" is especially confusing for me. Now every username does work, as long as the admin-password is right.!?
Use environment variables in the docker setup to set all of these.
See the docs: https://grafana.com/docs/grafana/latest/installation/configuration/#configure-with-environment-variables
-
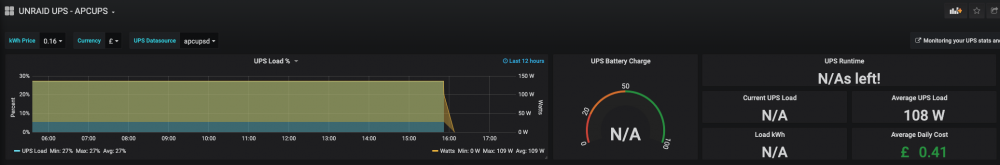
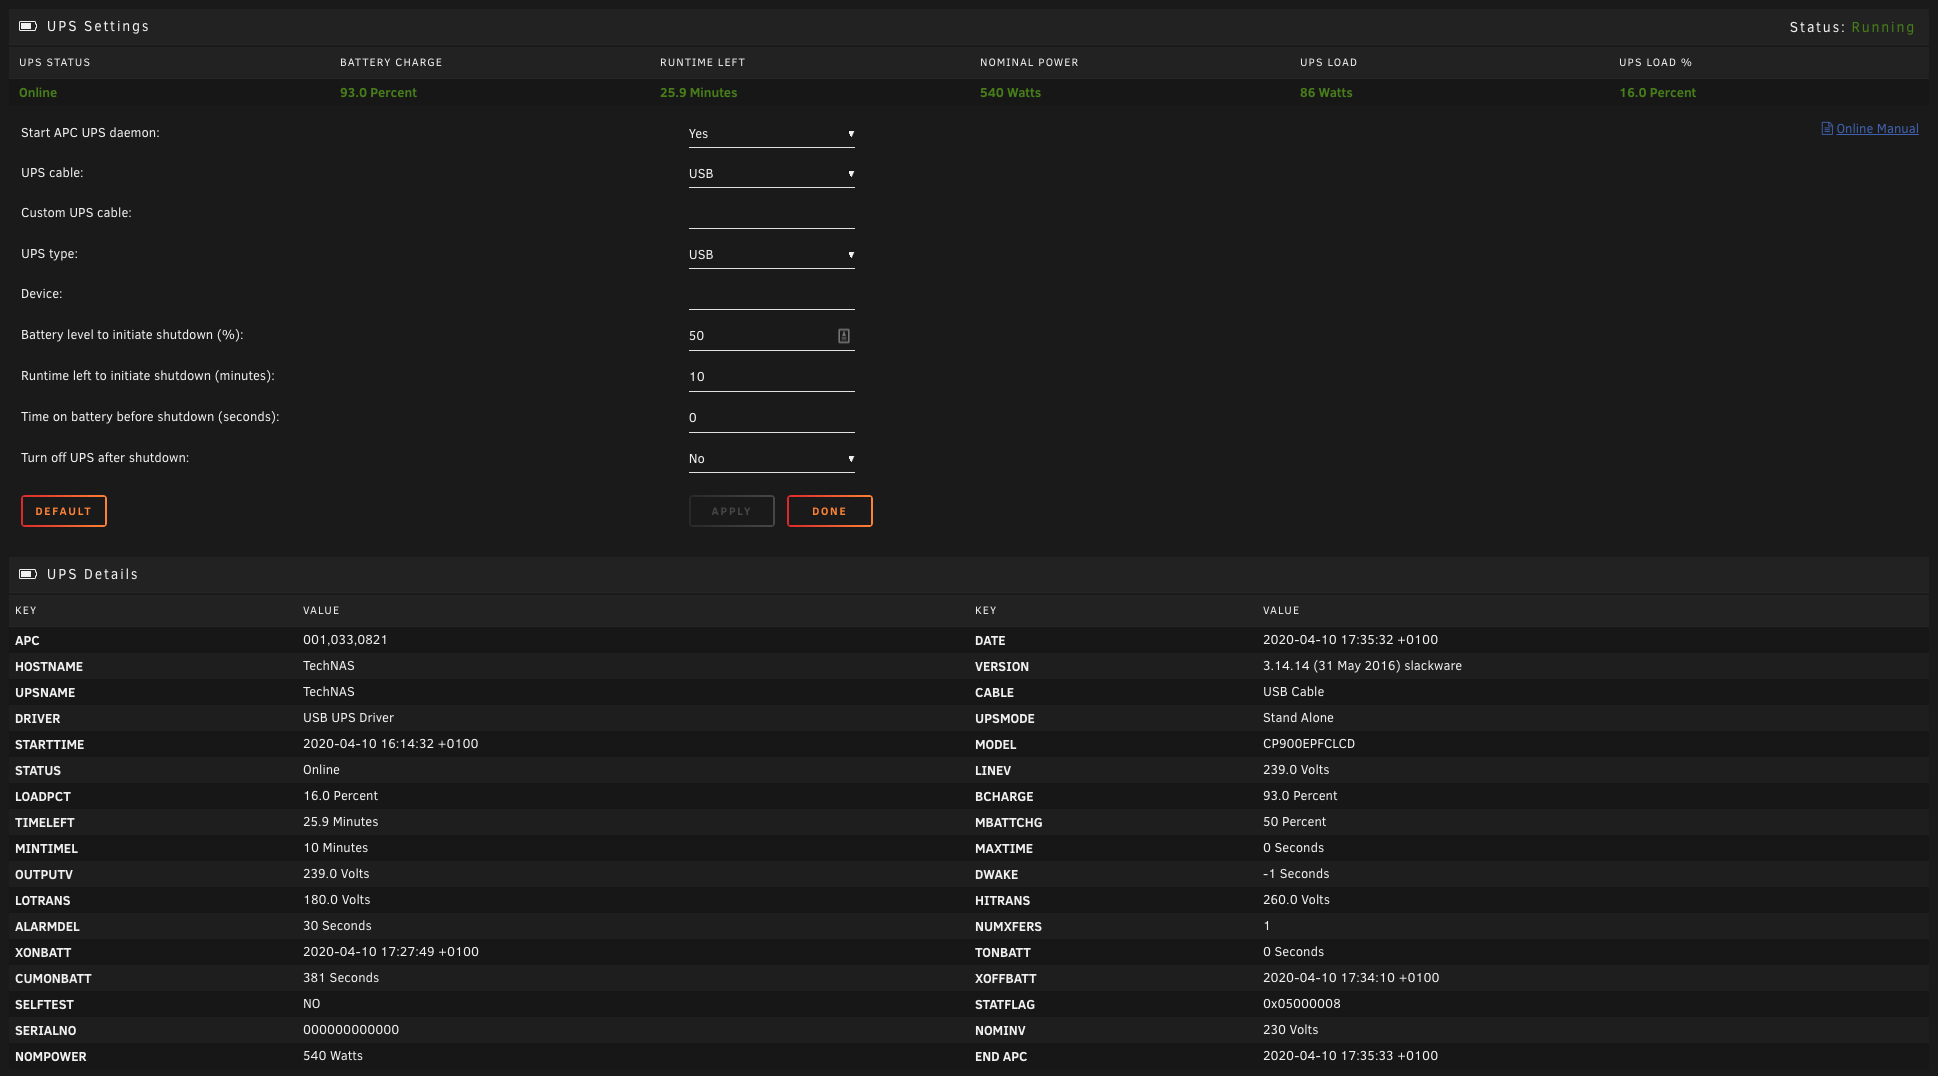
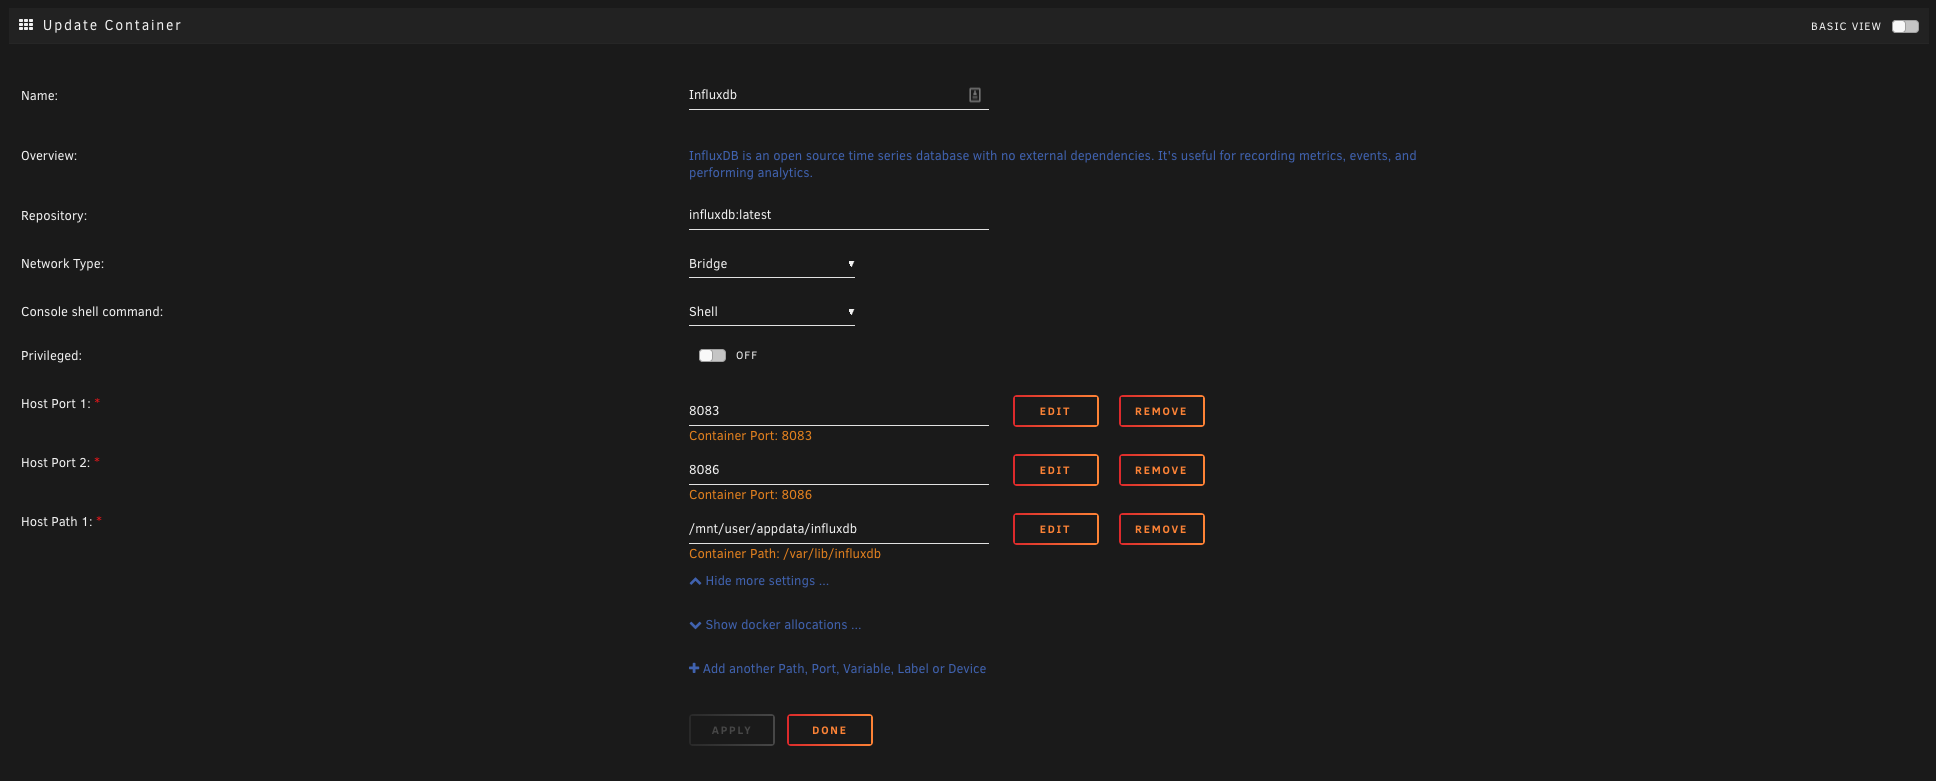
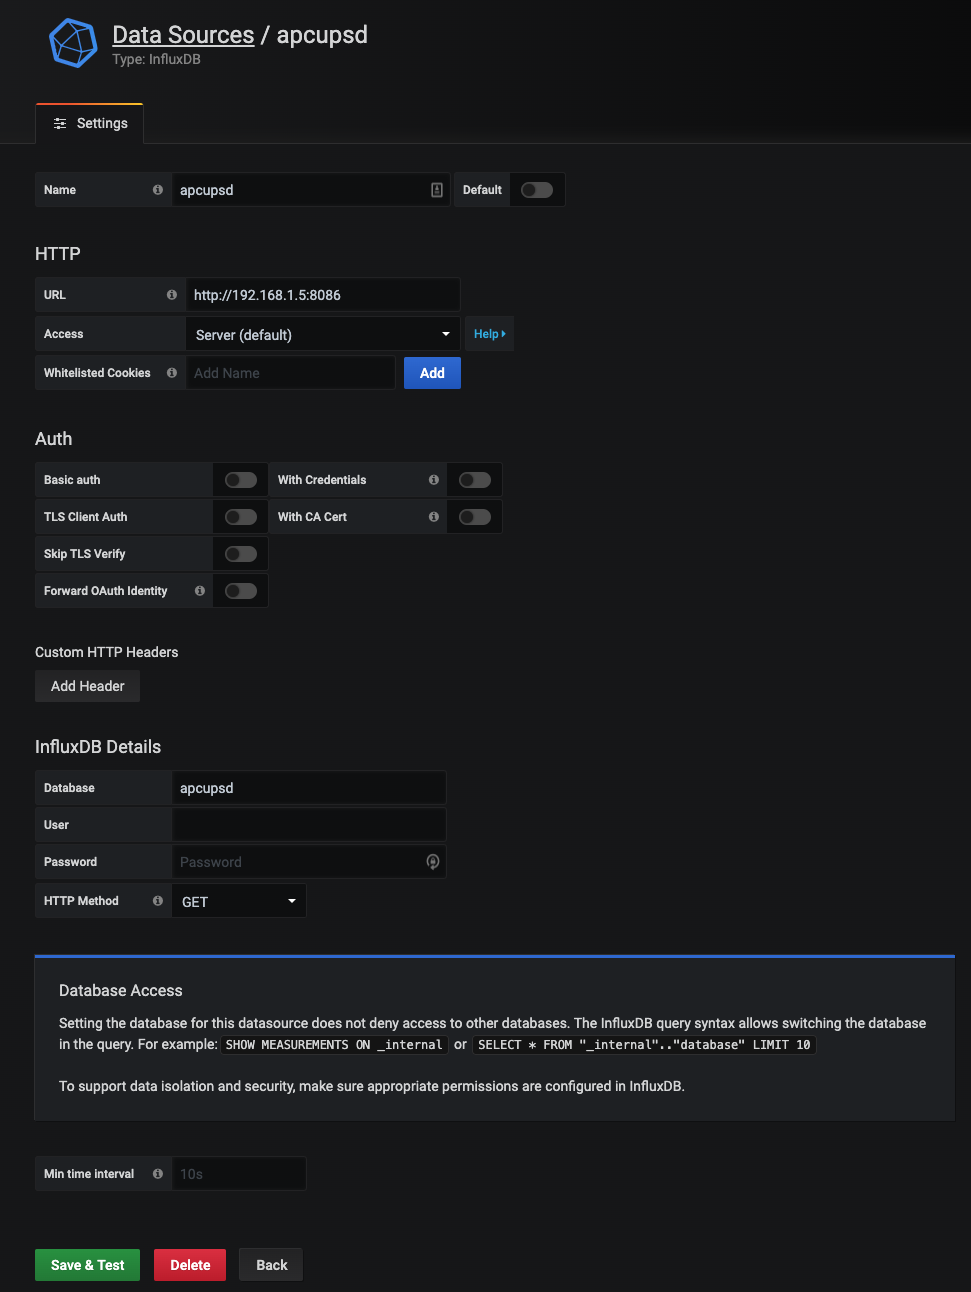
2 hours ago, WannabeMKII said:
I've just replaced my UPS and the new UPS provides information that the old one didn't so Grafana should be more accurate. For example, nompower, loadpct, timeleft etc.
However, something isn't quite right, as Grafana is actually reporting less and I'm thinking it's something to do with apcupsd still reporting the old information from the old UPS and not updating Influx with the new information?
I've added a number of screenshots from what apcupsd shows, Grafana, Influx set up, Influx data sources and if I remove the nompower from the apcupsd-influx-exporter (this UPS reports nompower, the old on didn't), the log file.
Can anyone assist please?Many thanks and stay safe!
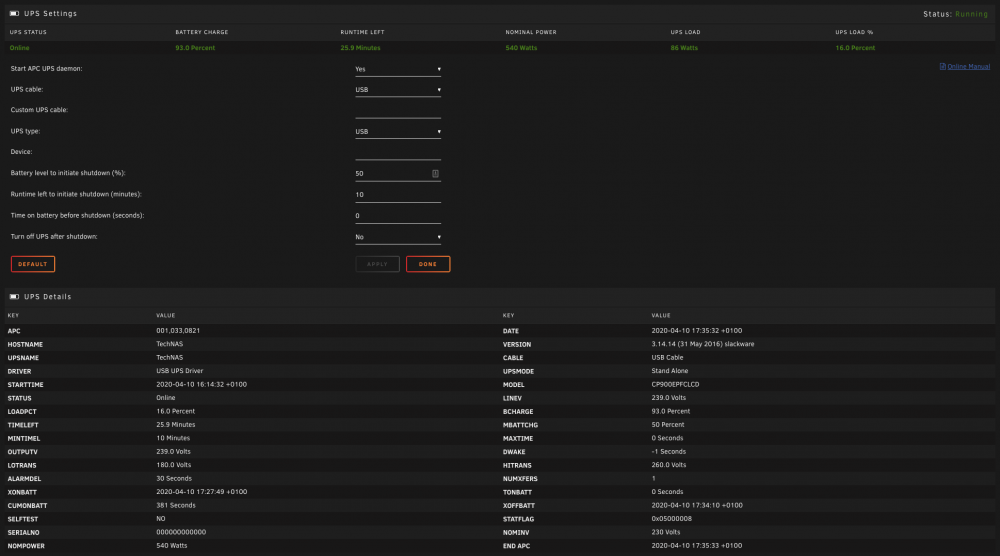
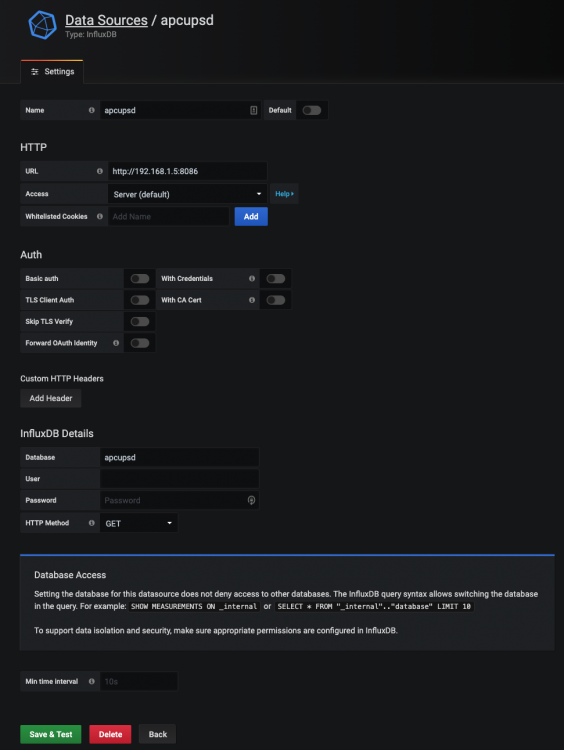
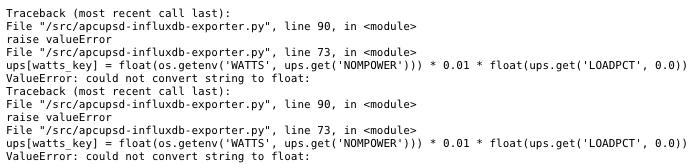
Do you have the WATTS variable set in the apcupsd-influxdb-exporter docker?

-
20 minutes ago, J89eu said:
Hi, for the Telegraf docker, how can I install the input plugin APCUPSD? https://github.com/influxdata/telegraf/tree/master/plugins/inputs/apcupsd
Seems it's part of the standard feature set but I can't see it in the telegraf conf file
Cheers
If you can't find it, just add it.
[[inputs.apcupsd]] # A list of running apcupsd server to connect to. # If not provided will default to tcp://127.0.0.1:3551 servers = ["tcp://127.0.0.1:3551"] ## Timeout for dialing server. timeout = "5s"-
 1
1
-
-
1 hour ago, shaunmccloud said:
If you figure it out, let me know. I want that and smartmontools.
1 hour ago, mordac said:Is there any way to semi-permanently add ipmi-tool to the telegraf docker? I've been manually installing it but obviously that gets trashed on update.
There is an open issue on github for this https://github.com/influxdata/influxdata-docker/issues/118
The solution is probably to make a custom image that uses telegraf as the base image and then adds ipmi-tool. But sadly,
I don't have time for that at the moment.
-
6 minutes ago, Spoonsy1480 said:
Have done that still not starting
Sent from my iPhone using TapatalkWhat is the error message it is giving now?
-
4 hours ago, Spoonsy1480 said:
I have done both of these and still nothing working
Sent from my iPhone using TapatalkYou need to remove the trailing slash from
/mnt/cache/appdata/telegraf/telegraf.conf/ -
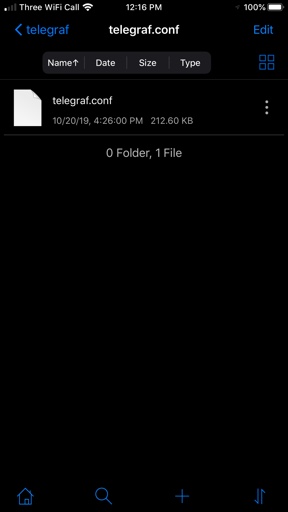
3 minutes ago, Spoonsy1480 said:
I have
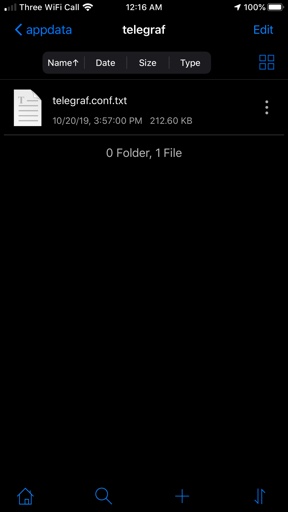
Sent from my iPhone using Tapatalkyou need to rename that to remove the .txt and change the mapping to be /mnt/user/appdata/telegraf/telegraf.conf
-
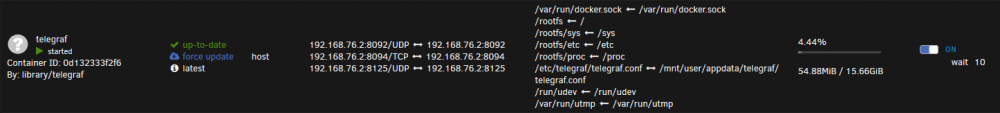
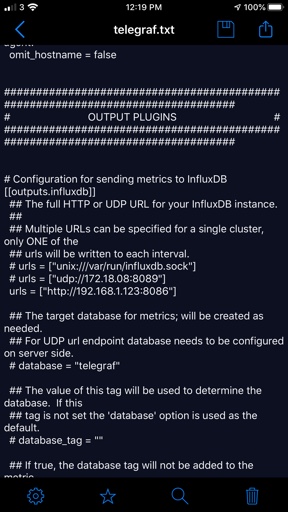
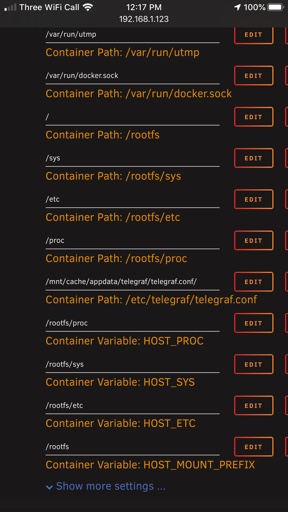
2 minutes ago, Spoonsy1480 said:
im having trouble launching telegraf i have srt my telegraf.conf but it does not start i get this
/usr/bin/docker: Error response from daemon: OCI runtime create failed: container_linux.go:346: starting container process caused "process_linux.go:449: container init caused "rootfs_linux.go:58: mounting \"/mnt/user/appdata/telegraf/telegraf.conf\" to rootfs \"/var/lib/docker/btrfs/subvolumes/cd975c47d7167e306f4a430184eb09c7d1c946d8f85bb3516686dfda87e0dc1c\" at \"/var/lib/docker/btrfs/subvolumes/cd975c47d7167e306f4a430184eb09c7d1c946d8f85bb3516686dfda87e0dc1c/etc/telegraf/telegraf.conf\" caused \"not a directory\""": unknown: Are you trying to mount a directory onto a file (or vice-versa)? Check if the specified host path exists and is the expected type..thumb.png.17f320b956db73a73df85c4b6ce31436.png)
You need to create that path and put the file telegraf.conf in the folder and then map to just the file. Find the file on the telegraf github.
-
10 hours ago, Alphacosmos said:
I have searched everywhere and I cant seem to access or find my Grafana.ini file. I need to edit it so i can set disable_sanitize_html to true for embedded links. Has anyone dont this or can get me a quick guide. Nothing i have looked up or tried has worked. Apparently I can edit the variable to make this work but im not sure what im doing in regards to it.
https://grafana.com/docs/installation/docker/
Just add an environment variable that corresponds to the setting you want to change. In that url they use
-e "GF_SERVER_ROOT_URL=http://grafana.server.name"So in unRAID just edit the container, hit add variable and add the variable that changes what you want.
-
1 hour ago, axipher said:
What would be the easiest way to get NUT-Client integrated in to a running Telegraf Docker so that I can have Telegraf also relay UPS statistics to InfluxDB?
The eventual goal is having UPS stats from NUT-Settings Plugin in a Grafana Dashboard from here: https://technicalramblings.com/blog/setting-grafana-influxdb-telegraf-ups-monitoring-unraid/
I found these sites for reference for NUT and Telegraf:
https://blog.lbdg.me/n-u-t-ups-monitoring-via-pfsense-grafana/
https://yegor.pomortsev.com/post/monitoring-everything/
In the first site they have telegraf running on pfsense (where NUT is installed) and they are running a shell script to gather up the data, and that telegraf instance sends the data to influxdb. You could do something like that.
-
6 minutes ago, repomanz said:
MineOS / forge / mod question.
generator-options={"profile"\:"rarecities"}Does anyone know how to work around the \ being inserted in this server.properties upon start up? This is messing up a mod from properly running. Obviously the : needs to be escaped but in doing so mod doesn't load the profile.
Seen this before?No idea.
-
19 minutes ago, Saldash said:
I'd like to set up email alerts from Grafana but the settings page is read only.
There's a banner that states that the settings are defined in grafana.ini or custom.ini or set as ENV variables.
I've tried looking in the appdata folder for Grafana but I can't see either of the name files.
I've also tried setting up a variable in the docker edit page and restarting the app but it doesn't work.
How do I go about changing the settings for Grafana?
Thanks,
Use environment variables. See https://grafana.com/docs/installation/docker/
-
1 minute ago, atribe said:
I made the docker container because the original creator hadn't made one. so no, there isn't a docker container for his repo.
There I just merged his latest into the mine. The docker container will auto build and be ready soon.
-
1 hour ago, Gizmotoy said:
Thanks for the insight. I'm not super-knowledgable on underlying Docker stuff: can I just change the "Repository" field in my existing container? Or is it more complex than that?
I made the docker container because the original creator hadn't made one. so no, there isn't a docker container for his repo.
-
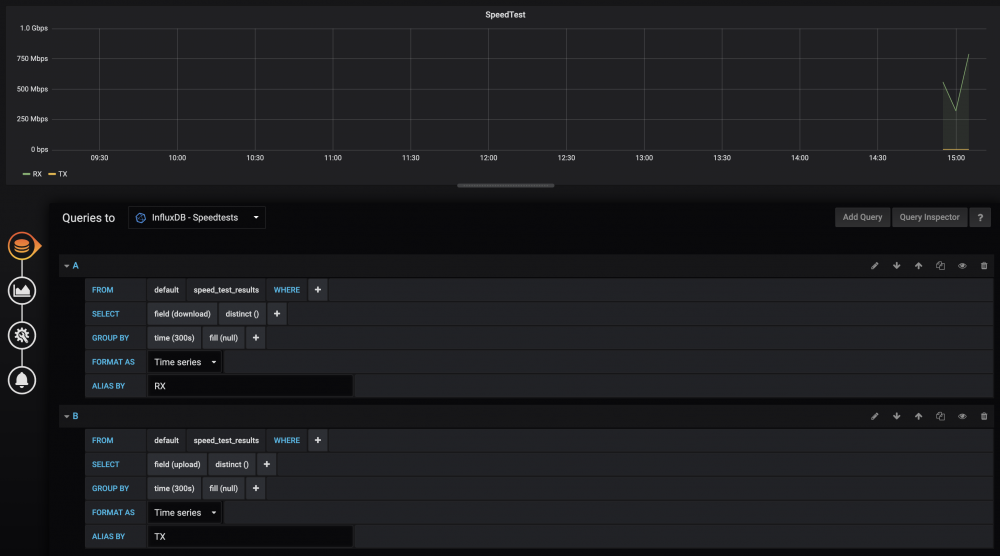
51 minutes ago, Gizmotoy said:
These are fantastic! Thanks!
I'm using the Speedtestforinfluxdb and getting some unusual results, though. I have symmetrical gigabit fiber, and show Speedtests in the neighborhood of 800Mbps down, 4Mbps up. I could maybe believe the down (though it's about 940 Mbps when tested manually), but the upstream seems straight wrong (also 940Mbps when tested manually). I'm also seeing pings in the 25ms range ("0" to 2 ms is typical manually).
Any thoughts on what might be wrong? I assume I've misconfigured something, but I'm not sure what.
[GENERAL]
Delay = 300

[INFLUXDB]
Address = <my_actual_ip_was_here>
Port = 8086
Database = speedtests
Username =
Password =
Verify_SSL = False

[SPEEDTEST]
# Leave blank to auto pick server
Server =

[LOGGING]
# Valid Options: critical, error, warning, info, debug
Level = info
I'd go to the github repo for this, he helps out and I think may have already fixed this issue.
https://github.com/barrycarey/Speedtest-for-InfluxDB-and-Grafana
I may need to pull his branch into mine so I can get the latest changes he has.
-
On 2/1/2019 at 4:51 PM, Tybio said:
I'll put it in, but stick to using the script for now
")
The script should work for you now. If you have any more issues let me know.
-
On 2/26/2019 at 6:11 PM, DoomBot5 said:
I took you up on that offer after running into a similar issue. Pull request sent.
Thanks for the PR. I also just pushed a change to apcupsd-influx-exporter that doesn't hard code any outputs from apcupsd. This should handle all configurations now. It also adds a few more tags and cleans up the code in general.
-
43 minutes ago, BelgarionNL said:
I guess my APS ups is also not supported? bummer because I'd love it if we got this to work.
getting the following error:
Traceback (most recent call last):
File "/src/apcupsd-influxdb-exporter.py", line 37, in <module>
'OUTPUTV': float(ups['OUTPUTV']),
KeyError: 'OUTPUTV'
Traceback (most recent call last):
File "/src/apcupsd-influxdb-exporter.py", line 37, in <module>
'OUTPUTV': float(ups['OUTPUTV']),
KeyError: 'OUTPUTV'
my UPS details:
APC001,036,0879DATE2019-02-12 21:32:40 +0100
HOSTNAMESERVERPRIMEVERSION3.14.14 (31 May 2016) slackware
UPSNAMESERVERPRIMECABLEUSB Cable
DRIVERUSB UPS DriverUPSMODEStand Alone
STARTTIME2019-02-12 16:48:47 +0100MODELBack-UPS XS 1400U
STATUSOnlineLINEV224.0 Volts
LOADPCT9.0 PercentBCHARGE100.0 Percent
TIMELEFT72.5 MinutesMBATTCHG50 Percent
MINTIMEL5 MinutesMAXTIME0 Seconds
SENSEMediumLOTRANS155.0 Volts
HITRANS280.0 VoltsALARMDEL30 Seconds
BATTV27.1 VoltsLASTXFERNo transfers since turnon
NUMXFERS0TONBATT0 Seconds
CUMONBATT0 SecondsXOFFBATTN/A
SELFTESTNOSTATFLAG0x05000008
SERIALNO4B1825P00963BATTDATE2018-06-18
NOMINV230 VoltsNOMBATTV24.0 Volts
NOMPOWER700 WattsFIRMWARE926.T2 .I USB FW:T2
END APC2019-02-12 21:32:48 +0100
Not at the moment. I have a solution in the works, but no ETA.
-
4 minutes ago, Tybio said:
Hey, quick question.
I just added the apcupsd exporter and I'm getting an error. Not sure if this is because I'm using a cyberpower UPS or what:
Traceback (most recent call last):
File "/src/apcupsd-influxdb-exporter.py", line 36, in <module>
'BATTV': float(ups['BATTV']),
KeyError: 'BATTV'
This is what I have in my apcaccess if that matters:
root@Storage:/mnt/user/AppData/Config/scripts# apcaccess
APC      : 001,033,0821
DATE     : 2019-02-01 15:40:38 -0800
HOSTNAME : Storage
VERSION  : 3.14.14 (31 May 2016) slackware
UPSNAME  : Storage
CABLE    : USB Cable
DRIVER   : USB UPS Driver
UPSMODE  : Stand Alone
STARTTIME: 2019-01-27 04:40:04 -0800
MODEL    : OR1500PFCLCD
STATUS   : ONLINE
LINEV    : 120.0 Volts
LOADPCT  : 11.0 Percent
BCHARGE  : 100.0 Percent
TIMELEFT : 68.0 Minutes
MBATTCHG : 10 Percent
MINTIMEL : 10 Minutes
MAXTIME  : 600 Seconds
OUTPUTV  : 120.0 Volts
DWAKE    : -1 Seconds
LOTRANS  : 100.0 Volts
HITRANS  : 132.0 Volts
ALARMDEL : No alarm
NUMXFERS : 1
XONBATT  : 2019-01-30 05:02:27 -0800
TONBATT  : 0 Seconds
CUMONBATT: 8 Seconds
XOFFBATT : 2019-01-30 05:02:35 -0800
SELFTEST : NO
STATFLAG : 0x05000008
SERIALNO : GX1HS2000054
NOMINV   : 120 Volts
NOMPOWER : 1050 Watts
END APC  : 2019-02-01 15:40:46 -0800
The problem is that the current program is hard coded to some outputs from apcupsd. Your ups doesn't have the battery voltage output, so it is breaking. Your welcome to submit a PR to fix that problem to the github project https://github.com/atribe/apcupsd-influxdb-exporter. Its something I want to do, just don't have the time right now.


.png.f4858f7032712c623074c26ced3f70e9.png)

[Support] for atribe's repo Docker images
in Docker Containers
Posted
Merged. Thank you.