
blade316
-
Posts
73 -
Joined
-
Last visited
blade316's Achievements
")
Rookie (2/14)
2
Reputation
-
@johnwhicker So just an update on my issue, I recently started migrating from XFS to ZFS. This didn't result in any changes to the Mac SMB issue, however I am in a much better place using ZFS instead of XFS for my pools. I have only changed my general cache, docker pool, and VM pool which are on SSD media over to ZFS. Next is to work out how I am going to migrate my array to ZFS. Anyway, during this I also decided to test out Disk Shares, I have never used them before (except for the cache pools), and wouldn't you know it, when accessing a disk share from Macs over SMB is instant, same as windows. What this tells us is that there is something in FUSE that is causing Mac SMB to bug out. Now at the moment because my array is still set up in the old traditional xfs (6.11.x and before, without pool functionality) I only get each disk surfaced as a share, not the pool of disks itself. So once I work out how I want to migrate the data from my array, I will be creating a pool (maybe multiple) for my array disks, which will then be surfaced as a disk share. Accessing a disk share takes FUSE out of the equation, and should hopefully fix this problem moving forward. Now that I have discovered this, I'm wondering if this was also why UnRAID NFS shares didn't work very well on MacOS either, as they would have also be going through FUSE for this. I encourage you to test this yourself as it looks like thats the go. Cheers!
-
 Hey peeps! Nowwwwww I already know there have been a number of threads already about this, however this problem seems to really have no solid answer or solution. So please don't lash out for a new post about it lol 🙂' I'm going to break it down as simply as I can. Unraid 6.11.0 Intel Core i7 32GB RAM Array size: 58TB # of Drives: 8 Parity drives: 1 NIC: Intel Quad Port Gigabit NIC Average Overall Server Load: 10-15% Network Switch: Standard Gigabit Managed switch, no fancy config Wireless: Nothing fancy, standard N & AC wifi Dockers: Nothing fancy, not taxing the hardware at all Devices Mac Mini 2012 (10.15 Catalina) Mac Mini M1 2021 (13.2.1 Ventura) Macbook Pro M2 2022 (13.2.1 Ventura) Multiple Windows 10 machines All machines connected to network via Ethernet & Wireless Affected share type: SMB Is NFS also affected: Sort of, no where near as bad as SMB Symptoms: Both Mac Mini 2012 and Mac Mini M1 - Loading any SMB share takes forever, regardless of how many folders and files are in the share - On average around 5-6 minutes - Copy any files whether it be big single files or lots of small files, goes at around 1MB/s, when it should be around 80MB/s Troubleshooting: - Tested iperf from both macs to unraid - maxes out gigbit connection around 975MB/s, so its not a connection issue - Changed out ethernet cables - Disabled wireless - Changed switch ports - Reset NICs on Mac Mini's - Created brand new test shares with test data Additional info: So to make things more confusing, the Macbook M2 does not have this issue at all. I can access all of the same unraid SMB shares via ethernet or wireless and they load instantly. I can copy files to and from, and it maxes out the connection. Windows 10 machines also have no issues with the same SMB shares and max out the connection. If I use SSH on the Mac Mini devices, its a lot faster, however still not like the M2 or the Windows machines, only achieving around 40MB/s transfer speed. I also have a TrueNAS box, so to throw another spanner in the works, the Mac Mini devices do not have any issues accessing SMB shares on the TrueNAS box. I have set up the TrueNAS SMB shares to be the same as the UnRAID SMB shares for making troubleshooting more accurate. This issue has been going on Unraid for as long as I can remember, and until I got my Macbook M2 recently, I just figured that was something I would just have to deal with using Mac with UnRAID. However, the Macbook M2 working properly blows that theory out of the water. I have tried all sorts of different SMB config options etc, nothing works. The key here is the Macbook M2 is not affected, the Mac Mini's work fine with SMB on TrueNAS, so something in UnRAID is not quite right. Keen to get some insight from people and maybe even the devs as to why SMB seems to be troublesome on UnRAID for MacOS? TIA Daniel
 -
I have had a new error pop up this morning ... the trigger was when I logged back into my Mac Mini, and it was telling me it couldn't reconnect to the nfs shares on my unraid server. Quick check in unraid and all the shares are now missing, obviously due to the error. The only device in the house that uses nfs is my mac, which I have been using with nfs for a long time with unraid. I've not seen this error before, the only thing I can think of that may have led to this is leaving some finder windows open with those nfs shares overnight. Here is the syslog portion: ar 25 05:21:59 unRAID CA Backup/Restore: ####################### Mar 25 05:21:59 unRAID CA Backup/Restore: appData Backup complete Mar 25 05:21:59 unRAID CA Backup/Restore: ####################### Mar 25 05:21:59 unRAID CA Backup/Restore: Backup / Restore Completed Mar 25 07:00:01 unRAID root: mover: started Mar 25 07:00:02 unRAID root: mover: finished Mar 25 08:12:40 unRAID autofan: Highest disk temp is 40C, adjusting fan speed from: 112 (43% @ 771rpm) to: 135 (52% @ 713rpm) Mar 25 10:27:43 unRAID shfs: shfs: ../lib/fuse.c:1450: unlink_node: Assertion `node->nlookup > 1' failed. Mar 25 10:27:44 unRAID kernel: ------------[ cut here ]------------ Mar 25 10:27:44 unRAID kernel: nfsd: non-standard errno: -107 Mar 25 10:27:44 unRAID kernel: WARNING: CPU: 6 PID: 7793 at fs/nfsd/nfsproc.c:889 nfserrno+0x45/0x51 [nfsd] Mar 25 10:27:44 unRAID kernel: Modules linked in: veth nvidia_uvm(PO) xt_nat macvlan xt_CHECKSUM ipt_REJECT nf_reject_ipv4 xt_tcpudp ip6table_mangle ip6table_nat iptable_mangle vhost_net tun vhost vhost_iotlb tap xt_conntrack xt_MASQUERADE nf_conntrack_netlink nfnetlink xfrm_user xfrm_algo xt_addrtype iptable_nat nf_nat nf_conntrack nf_defrag_ipv6 nf_defrag_ipv4 br_netfilter xfs nfsd auth_rpcgss oid_registry lockd grace sunrpc md_mod it87 hwmon_vid efivarfs ip6table_filter ip6_tables iptable_filter ip_tables x_tables bridge stp llc ipv6 nvidia_drm(PO) x86_pkg_temp_thermal intel_powerclamp nvidia_modeset(PO) coretemp i915 kvm_intel iosf_mbi drm_buddy ttm nvidia(PO) kvm drm_display_helper drm_kms_helper crct10dif_pclmul crc32_pclmul crc32c_intel ghash_clmulni_intel aesni_intel crypto_simd cryptd rapl intel_gtt mxm_wmi drm intel_cstate agpgart mpt3sas igb i2c_i801 ahci i2c_algo_bit i2c_smbus syscopyarea intel_uncore sysfillrect raid_class libahci sysimgblt atl1c i2c_core scsi_transport_sas fb_sys_fops video Mar 25 10:27:44 unRAID kernel: wmi thermal fan backlight button unix Mar 25 10:27:44 unRAID kernel: CPU: 6 PID: 7793 Comm: nfsd Tainted: P O 5.19.9-Unraid #1 Mar 25 10:27:44 unRAID kernel: Hardware name: Gigabyte Technology Co., Ltd. To be filled by O.E.M./Z77MX-D3H, BIOS F17b 01/06/2014 Mar 25 10:27:44 unRAID kernel: RIP: 0010:nfserrno+0x45/0x51 [nfsd] Mar 25 10:27:44 unRAID kernel: Code: c3 cc cc cc cc 48 ff c0 48 83 f8 26 75 e0 80 3d cc 47 05 00 00 75 15 48 c7 c7 0f 34 ef a2 c6 05 bc 47 05 00 01 e8 06 99 90 de <0f> 0b b8 00 00 00 05 c3 cc cc cc cc 48 83 ec 18 31 c9 ba ff 07 00 Mar 25 10:27:44 unRAID kernel: RSP: 0018:ffffc900009a3e30 EFLAGS: 00010286 Mar 25 10:27:44 unRAID kernel: RAX: 0000000000000000 RBX: ffff8881c1490000 RCX: 0000000000000027 Mar 25 10:27:44 unRAID kernel: RDX: 0000000000000001 RSI: ffffffff81ec827f RDI: 00000000ffffffff Mar 25 10:27:44 unRAID kernel: RBP: ffff888103d64000 R08: 0000000000000000 R09: ffffffff82044990 Mar 25 10:27:44 unRAID kernel: R10: 0000000000000000 R11: ffffffff8264afbe R12: ffff8881c1490008 Mar 25 10:27:44 unRAID kernel: R13: ffff8881c1488000 R14: ffffffffa2f12600 R15: ffffffffa2eeda98 Mar 25 10:27:44 unRAID kernel: FS: 0000000000000000(0000) GS:ffff888810380000(0000) knlGS:0000000000000000 Mar 25 10:27:44 unRAID kernel: CS: 0010 DS: 0000 ES: 0000 CR0: 0000000080050033 Mar 25 10:27:44 unRAID kernel: CR2: 0000153ca414d638 CR3: 000000000500a002 CR4: 00000000001726e0 Mar 25 10:27:44 unRAID kernel: Call Trace: Mar 25 10:27:44 unRAID kernel: <TASK> Mar 25 10:27:44 unRAID kernel: nfsd3_proc_getattr+0xaf/0xd7 [nfsd] Mar 25 10:27:44 unRAID kernel: nfsd_dispatch+0x194/0x24d [nfsd] Mar 25 10:27:44 unRAID kernel: svc_process+0x3f1/0x5d6 [sunrpc] Mar 25 10:27:44 unRAID kernel: ? nfsd_svc+0x2b6/0x2b6 [nfsd] Mar 25 10:27:44 unRAID kernel: ? nfsd_shutdown_threads+0x5b/0x5b [nfsd] Mar 25 10:27:44 unRAID kernel: nfsd+0xd5/0x155 [nfsd] Mar 25 10:27:44 unRAID kernel: kthread+0xe7/0xef Mar 25 10:27:44 unRAID kernel: ? kthread_complete_and_exit+0x1b/0x1b Mar 25 10:27:44 unRAID kernel: ret_from_fork+0x22/0x30 Mar 25 10:27:44 unRAID kernel: </TASK> Mar 25 10:27:44 unRAID kernel: ---[ end trace 0000000000000000 ]--- Diagnostic files attached: unraid-diagnostics-20230325-1311.zip Would be great if anyone could shed some light on this one, and where I can start looking. Also side note: other than a reboot or restarting the array, nothing seems to bring the shares back ... unless there is a command I can run that will export all the array shares again?
-
blade316 changed their profile photo
-
@JorgeB yeah I know, unfortunately when the pre-clear failed, I can't see the drive in unassigned devices, can only see it mounted to /dev/sdd ... but with the weird 16GB tmpfs, so I don't have any data .... thats why I grabbed what I could out of syslog just in case and put it on pastebin ... I will have to wait until the other WD Red finishes its pre-clear before I reboot and try and get the smart data for the the failed one.
-
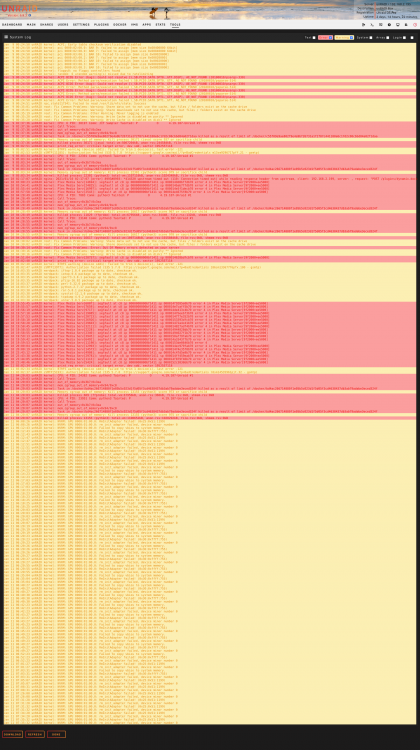
Been using UnRAID since around 2010, first time ever pre-clearing a drive and it fails! haha ... I am doing two WD 8TB at the same time, one is standard WD RED the other is WD RED+ .. and the RED+ failed... failed on the Zeroing step, pre-read seemed to be fine. I have create a log just with the pre-clear and disk error details Logs link: https://pastebin.com/kG3fvXXW For some reason the drive is no longer showing in unassigned devices, however I can see it under /dev/sdd, but the weird thing is its showing 16GB devtmpfs. I have both the new WD drives, and my array drives connected via LSI 9211-8i - array drives are fine, and the other new WD RED is currently 50% through the zeroing stage. Looking at the logs, I am seeing stuff I do not like at all! ... I'm thinking either a bad cable, or indeed a bad drive ... I am hesitant to think its the card as the 2 new WD drives are connected to P3 and P4 on the same connector for the LSI card .... I actually have some spare breakout cables arriving this week, along with an additional LSI 9300-8i, so I can always swap the card out as well and test again, but I don't think its the card. However as this is my first pre-clear, I thought I would throw it to the masses and get your thoughts. My other side question is regarding returning the drive ... I have never had to return a drive under warranty - I purchased it from Amazon, I have checked the serial on WD warranty site and its in warranty ... would you recommend I return via Amazon, or go directly through WD? Also here is my unraid diagnostics - Any advice would be appreciated unraid-diagnostics-20210124-1200.zip
-
print_req_error: critical target error, dev sdg
blade316 replied to blackf0rk's topic in General Support
hey mate, do you know why TRIM doesn't work when the SSD drives are connected to a SAS controller? Whats the reason they have to be connected to the onboard SATA ports? -
unfortunately limit the docker containers memory limit has not fixed the issue, if anything it looks to have made it worse. The RmInitAdapter failed errors have also returned which I believe is also because the system is running out of memory .... *sigh*
-
just a quick update, it was suggested elsewhere that I limit the memory usage of my docker containers. Most of my docker containers are limited between 256M - 4G depending on their requirements. Except for Plex and Emby containers. So I have now limited those both to 4GB of memory, to see if that helps.
-
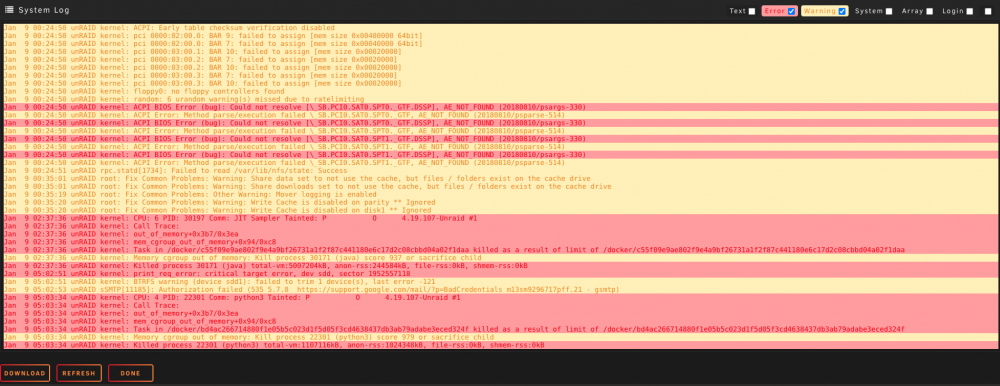
Hey guys, I'll keep this one short and to the point. Overnight I have received some kernel, PCI and memory errors. I had 24GB RAM in the server, 2x8GB + 2x4GB Last night I swapped out the 2x4GB with 2x8GB sticks (exact same model as my other 2x8GB sticks already in the box) to give it 32GB Nothing else has changed. Then this morning I woke up to these errors. (disregard the data and downloads share and cache entries, I will fix them after - unrelated) The box is still functioning fine, but obviously I would like to try and get a handle on where these errors are coming from. Here is my server diags: unraid-diagnostics-20210109-1317.zip I have not run a memtest yet, I just wanted to see if the community had some information on things I can check prior to taking my server offline for a memtest. Any help would be great
-
New Gpu is giving me odd errors, Log attached.
blade316 replied to deaerator's topic in General Support
nope haven't seen any resolution to this as of yet ... however I ended up taking my server RAM from 24GB to 32GB, and it seems those errors have not returned for me ... so maybe I was running out of memory like my video was leaning towards... -
New GPU - errors in logs RmInitAdapter failed
blade316 replied to blade316's topic in General Support
posted in Nvidia thread too -
[Plugin] Linuxserver.io - Unraid Nvidia
blade316 replied to linuxserver.io's topic in Plugin Support
I installed a new GPU recently into my unraid server, and I have been getting hundreds of these errors in the system log: NVRM: GPU - RmInitAdapter failed! NVRM: GPU - rm_init_adapter failed, device minor number 0 NVRM: GPU - Failed to copy vbios to system memory New GPU is a GTX 1660Ti Running Nvidia UnRaid 6.8.3 with Nvidia 440.59 drivers I was not having any of these errors with my previous GPU, and I do not have any issues with my new GPU in another two machines when I tested From what I have been able to see during troubleshooting, is the GPU keeps going online and offline, and as per the video it seems to be when the cached memory in unraid gets all used up, due to file transfers happening. Perhaps there is a tunable of some sort to prevent all the memory from getting used? I did a screen capture when it was happening, its boring AF but it does show the device going offline and online when the cached memory goes up and down. Keep an eye on the memory usage and the green available sliver at the top. There seems to be a number of other posts about this, but can't really see that its been resolved. Any help or suggestions would be appreciated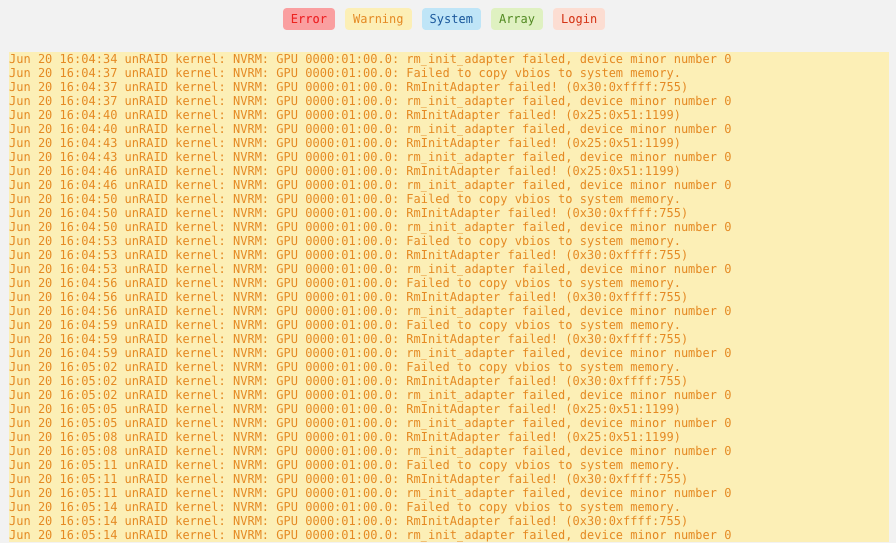
-
New GPU - errors in logs RmInitAdapter failed
blade316 replied to blade316's topic in General Support
no worries mate, thanks for the tip


