
LateNight
-
Posts
103 -
Joined
-
Last visited
Content Type
Profiles
Forums
Downloads
Store
Gallery
Bug Reports
Documentation
Landing
Posts posted by LateNight
-
-
7 minutes ago, parisv said:
If I wanted to pair 2 nics is that possible? I have a switch where I can set an lacp trunk.
Yes, I've had it that way since installing it.

-
9 hours ago, itimpi said:
Thanks for the information. Glad to hear that going through the settings screen seems to have fixed the issue.There was an internal change to the way that the configuration information was stored. I can see that the .cfg file you posted is still in the old format. I thought I had put in place the code that migrated old format to new one but it looks like I missed an entry that affects the generation of the cron entries. Using the information you have provided I can fix this but hopefully it is a short term issue.
Going in and saving again, without making changes, fixed the issue. No log entries overnight. Thank you.
-
Quote
It is regenerated any time you make a change in the plugin’s settings to be appropriate for the current settings so it might be worth doing that to see if it magically ‘cures’ the problem.
Just went into settings again and saved (no changes). New parity.check.tuning.cron:
# Generated schedules for parity.check.tuning
0 23 * * * /usr/local/emhttp/plugins/parity.check.tuning/parity.check.tuning.php "resume" &> /dev/null
0 7 * * * /usr/local/emhttp/plugins/parity.check.tuning/parity.check.tuning.php "pause" &> /dev/null
*/7 * * * * /usr/local/emhttp/plugins/parity.check.tuning/parity.check.tuning.php "monitor" &>/dev/null
I'm guessing that fixed the issue - will check in the morning.
-
Log:
Feb 8 23:04:02 DeathStar crond[2219]: failed parsing crontab for user root: /usr/local/emhttp/plugins/parity.check.tuning/parity.check.tuning.php "resume" &> /dev/null
Feb 8 23:04:02 DeathStar crond[2219]: failed parsing crontab for user root: /usr/local/emhttp/plugins/parity.check.tuning/parity.check.tuning.php "pause" &> /dev/null
Feb 8 23:19:01 DeathStar crond[2219]: failed parsing crontab for user root: /usr/local/emhttp/plugins/parity.check.tuning/parity.check.tuning.php "resume" &> /dev/null
Feb 8 23:19:01 DeathStar crond[2219]: failed parsing crontab for user root: /usr/local/emhttp/plugins/parity.check.tuning/parity.check.tuning.php "pause" &> /dev/null
Feb 8 23:34:01 DeathStar crond[2219]: failed parsing crontab for user root: /usr/local/emhttp/plugins/parity.check.tuning/parity.check.tuning.php "resume" &> /dev/null
Feb 8 23:34:01 DeathStar crond[2219]: failed parsing crontab for user root: /usr/local/emhttp/plugins/parity.check.tuning/parity.check.tuning.php "pause" &> /dev/null
Feb 8 23:48:02 DeathStar crond[2219]: failed parsing crontab for user root: /usr/local/emhttp/plugins/parity.check.tuning/parity.check.tuning.php "resume" &> /dev/null
Feb 8 23:48:02 DeathStar crond[2219]: failed parsing crontab for user root: /usr/local/emhttp/plugins/parity.check.tuning/parity.check.tuning.php "pause" &> /dev/null
Feb 9 00:03:02 DeathStar crond[2219]: failed parsing crontab for user root: /usr/local/emhttp/plugins/parity.check.tuning/parity.check.tuning.php "resume" &> /dev/null
parity.check.tuning.cron
# Generated schedules for parity.check.tuning
 /usr/local/emhttp/plugins/parity.check.tuning/parity.check.tuning.php "resume" &> /dev/null
 /usr/local/emhttp/plugins/parity.check.tuning/parity.check.tuning.php "pause" &> /dev/null
*/7 * * * * /usr/local/emhttp/plugins/parity.check.tuning/parity.check.tuning.php "monitor" &>/dev/null
parity.tuning.cfg
parityTuningIncrements="yes" parityTuningFrequency="daily" parityTuningResumeCustom="" parityTuningResumeHour="23" parityTuningResumeMinute="0" parityTuningPauseCustom="" parityTuningPauseHour="7" parityTuningPauseMinute="0" parityTuningUnscheduled="yes" parityTuningRecon="no" parityTuningClear="no" parityTuningNotify="no" parityTuningHeat="yes" parityTuningHeatHigh="2" parityTuningHeatLow="10" parityTuningHeatNotify="yes" parityTuningDebug="no" parityTuningHeatShutdown="yes" parityTuningHeatCritical="1" -
Now showing every 15 minutes in my log:
failed parsing crontab for user root: /usr/local/emhttp/plugins/parity.check.tuning/parity.check.tuning.php "pause" &> /dev/nullUnraid Version: 6.8.3
-
 1
1
-
-
Repeated messages in log, every seven minutes:
crond[2212]: exit status 126 from user root /usr/local/emhttp/plugins/parity.check.tuning/parity.check.tuning.php "monitor" &>/dev/null
-
I've had Turbo disabled but decided to re-enable it again last night. Server crashed overnight. I wasn't running anything that should stress the server.
¯\_(ツ)_/¯
 Quote
Quote<13>Oct 29 20:17:58 DeathStar tips.and.tweaks: Tweaks Applied
<4>Oct 29 20:46:26 DeathStar kernel: mdcmd (237): spindown 4
<4>Oct 29 20:46:36 DeathStar kernel: mdcmd (238): spindown 0
<4>Oct 29 20:46:37 DeathStar kernel: mdcmd (239): spindown 2
<4>Oct 29 20:46:38 DeathStar kernel: mdcmd (240): spindown 3
<4>Oct 29 20:46:38 DeathStar kernel: mdcmd (241): spindown 5
<4>Oct 29 20:46:39 DeathStar kernel: mdcmd (242): spindown 6
<4>Oct 29 20:46:40 DeathStar kernel: mdcmd (243): spindown 8
<4>Oct 29 21:01:01 DeathStar kernel: mdcmd (244): spindown 1
<4>Oct 29 21:36:33 DeathStar kernel: mdcmd (245): spindown 7
<4>Oct 29 22:53:26 DeathStar kernel: mdcmd (246): spindown 1
<4>Oct 29 23:28:42 DeathStar kernel: mdcmd (247): spindown 7
<4>Oct 29 23:56:41 DeathStar kernel: mdcmd (248): spindown 6
<6>Oct 30 00:10:36 DeathStar kernel: veth983241a: renamed from eth0
<6>Oct 30 00:10:36 DeathStar kernel: docker0: port 2(vethca62111) entered disabled state
<6>Oct 30 00:10:36 DeathStar kernel: docker0: port 2(vethca62111) entered disabled state
<6>Oct 30 00:10:36 DeathStar kernel: device vethca62111 left promiscuous mode
<6>Oct 30 00:10:36 DeathStar kernel: docker0: port 2(vethca62111) entered disabled state
<6>Oct 30 00:10:37 DeathStar kernel: docker0: port 2(veth5dc5130) entered blocking state
<6>Oct 30 00:10:37 DeathStar kernel: docker0: port 2(veth5dc5130) entered disabled state
<6>Oct 30 00:10:37 DeathStar kernel: device veth5dc5130 entered promiscuous mode
<6>Oct 30 00:10:37 DeathStar kernel: IPv6: ADDRCONF(NETDEV_UP): veth5dc5130: link is not ready
<6>Oct 30 00:10:37 DeathStar kernel: docker0: port 2(veth5dc5130) entered blocking state
<6>Oct 30 00:10:37 DeathStar kernel: docker0: port 2(veth5dc5130) entered forwarding state
<6>Oct 30 00:10:37 DeathStar kernel: docker0: port 2(veth5dc5130) entered disabled state
<6>Oct 30 00:10:37 DeathStar kernel: eth0: renamed from vethba80b6a
<6>Oct 30 00:10:37 DeathStar kernel: IPv6: ADDRCONF(NETDEV_CHANGE): veth5dc5130: link becomes ready
<6>Oct 30 00:10:37 DeathStar kernel: docker0: port 2(veth5dc5130) entered blocking state
<6>Oct 30 00:10:37 DeathStar kernel: docker0: port 2(veth5dc5130) entered forwarding state
<13>Oct 30 01:00:01 DeathStar Plugin Auto Update: Checking for available plugin updates
<13>Oct 30 01:00:03 DeathStar Plugin Auto Update: Community Applications Plugin Auto Update finished
<77>Oct 30 04:00:49 DeathStar crond[2213]: exit status 1 from user root /usr/local/sbin/mover &> /dev/null
<4>Oct 30 04:35:21 DeathStar kernel: mdcmd (249): spindown 0 -
I have the following debug messages every five minutes in my log:
Quoteparity.check.tuning.php: DEBUG: -----------MONITOR start------
parity.check.tuning.php: DEBUG: No drives appear to have reached shutdown threshold
parity.check.tuning.php: DEBUG: No array operation currently in progress
DeathStar parity.check.tuning.php: DEBUG: -----------MONITOR end-------I did verify that I have logging disabled.

This started after the most recent update - 2020.10.23
-
Version: 6.8.3
Could not access my server this morning, requiring a hard reset. I was able to capture some details on the attached syslog.txt. Its appears to be multiple rcu_sched detected stalls on CPUs/tasks. I've also attached the diagnostics after the reboot. Any help is appreciated.syslog.txtdeathstar-diagnostics-20200813-1032.zip
-
Sorry, should have linked to the second response and not the thread.
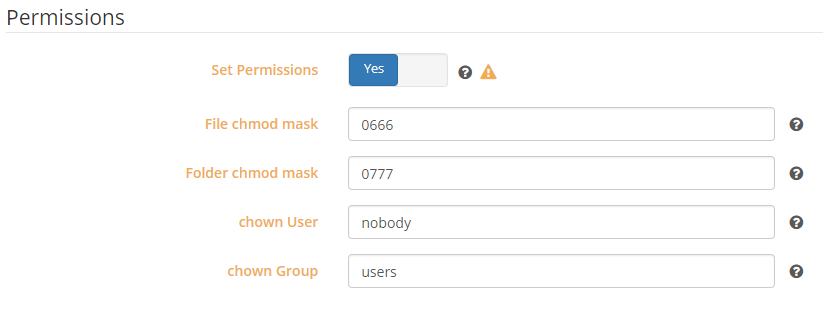
I was also having permission issues until I enabled the Set Permissions option. I did change the chown User to 99, and chown Group to 100 but it appears either works.
-
@unRAIDuser7 @TexasUnraid have you tried the "Set Permissions" option in Sonarr, as explained at:
-
Had this error occur overnight. I had added a headphones docker. Unfortunately, I turned off my syslog server and the logs weren't saved after reboot.

-
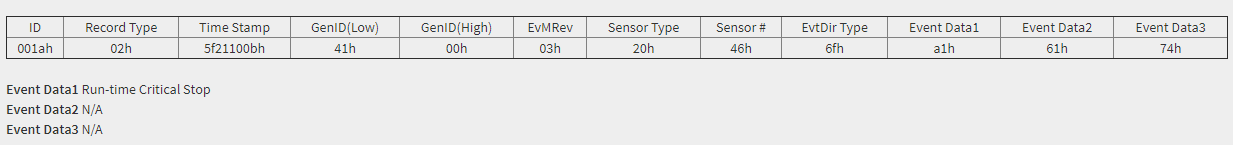
This is listed in the manual: Clear CMOS - 1 (short pin), but I don't see it in their diagram. Pulling the battery should work.
-
 1
1
-
-
4 minutes ago, creon said:
Just received my mother board cpu and memory
Installed all pressed the power button
Error 11 on the motherboard display
Can't find how to
Also can't find the meaning of the code 11
Can someone help me?
-
12 hours ago, JM2005 said:
@LateNight hows your troubleshooting coming along with William? Any news to report?
@JM2005 - he asked some clarifying questions, mostly about my BIOS settings, but no word today.
-
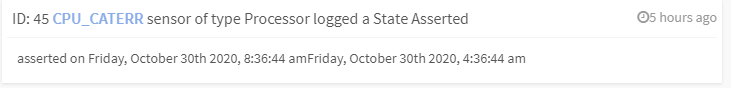
Interesting. I have already been in contact with William at ASRock and he's walking me through the steps of eliminating other devices in my system (10GB card and flashed IBM m1015). Are you seeing the same output when clicking on the CU_CATERR event in the log?
-
50 minutes ago, JM2005 said:
I have started getting lockup’s on my setup as well. I checked the IPMI logs and it had “CPU_CATERR” as well. My temps are idling now are around 39c to 42c. I just now disabled turbo boost. Hopefully this will help until I get my case temps down.
@JM2005 - when you click on that entry in the IPMI log what does it show? On my system it shows:
-
Thank you @Hoopster. I read earlier in the thread that you had disabled Turbo Boost but wrote it off as it seemed it was temperature related. I have not seen anything in my system reach over 40°C (except that MB sensor showing 85°C), and watching most of the parity check the CPU never went above 38°C. However after disabling Turbo Boost, I was able to complete a parity check.
-
Thank you @Hoopster for this deal/thread. I upgraded my almost 9 year old server.
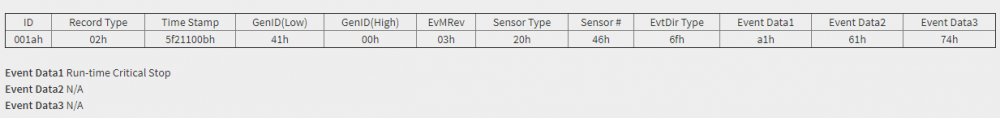
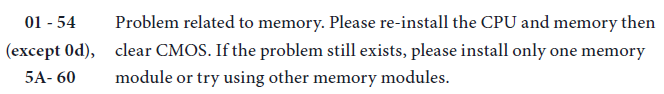
I'm running into an odd issue and trying to determine if it's hardware or software. My system runs fine until I start a parity check. During the parity check unRaid freezes but I am still able to reach the IPMI interface. I'm using BMC Firmware 1.80.00 and BIOS Firmware L2.21A. From my IPMI event log it shows CPU_CATERR.
3 | 07/04/2020, 08:34:35 | CPU_CATERR | Processor | State Asserted - AssertedI ran a syslog server but I don't see anything related.
<30>Jul  4 02:46:03 DeathStar ool www[17368]: /usr/local/emhttp/plugins/dynamix/scripts/rsyslog_config    192.168.1.5    04/07 02:46:03.013
<46>Jul  4 02:46:06 DeathStar rsyslogd: [origin software="rsyslogd" swVersion="8.1908.0" x-pid="17979" x-info="https://www.rsyslog.com"] start    192.168.1.5    04/07 02:46:05.473
<4>Jul  4 02:46:32 DeathStar kernel: mdcmd (88): spindown 3    192.168.1.5    04/07 02:46:31.123
<4>Jul  4 02:46:32 DeathStar kernel: mdcmd (89): spindown 6    192.168.1.5    04/07 02:46:32.001
<4>Jul  4 02:46:34 DeathStar kernel: mdcmd (90): spindown 4    192.168.1.5    04/07 02:46:33.832
<4>Jul  4 02:46:35 DeathStar kernel: mdcmd (91): spindown 5    192.168.1.5    04/07 02:46:34.483
<4>Jul  4 02:46:45 DeathStar kernel: mdcmd (92): check     192.168.1.5    04/07 02:46:44.087
<4>Jul  4 02:46:45 DeathStar kernel: md: recovery thread: check P ...    192.168.1.5    04/07 02:46:44.087
<13>Jul  4 03:00:01 DeathStar Recycle Bin: Scheduled: Files older than 7 days have been removed    192.168.1.5    04/07 03:00:00.645
<77>Jul  4 03:40:21 DeathStar crond[2295]: exit status 1 from user root /usr/local/sbin/mover &> /dev/null    192.168.1.5    04/07 03:40:20.584
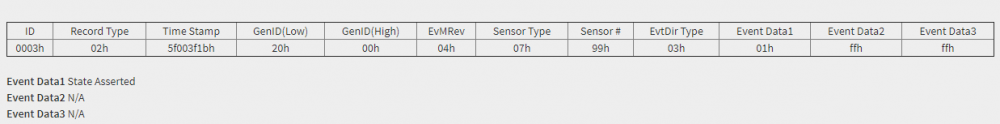
I also downloaded the MCA Log (attached). It looks like the CPU may be defective, but I've never seen anything like it.
CPU1 Do not Present!!
Get CPU0 MCA Error Source Log failed: CC = 0x81
Get CPU core number failed: CC = 0x81. Default catch 28 cores.
Diagnostics also attached, run just after rebooting.
Any help is appreciated, and can move this to its own topic if needed.
-
I love unRaid's flexibility and ease of use.
Wishlist: native ZFS
-
Fixed.
I was able to boot to GUI mode without plugins then update unRaid from 6.4.1 to 6.5.1 which took care of the issue.
-
Went to watch something on Plex but it wouldn't connect to my Plex Server which is a docker on my Unraid machine. Tried browsing to tower/dashboard and it fails to load in any browser or device. Tried direct ip and still a no go. I can browse via file explorer on Win10 and can ssh in. Tried a reboot but that didn't fix the problem. Attached is the diagnostic zip. Thank you for any help.
-
ntlm auth = yes seems to have fixed my problem.

-
I'm having a similar issue trying to connect with Windows 10. No issues before the upgrade. Since the upgrade I cannot access files using my user account. I can access shares using a guest account but it does not have write access. My username and password are the same in both Windows and Unraid.


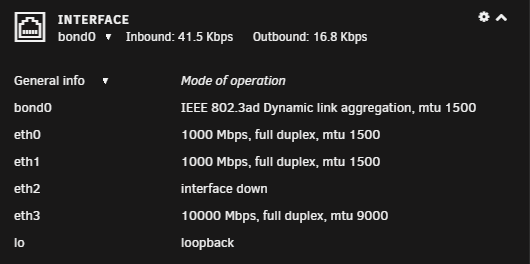
Intel Socket 1151 Motherboards with IPMI AND Support for iGPU
in Motherboards and CPUs
Posted
The E3C246D4U has a dedicated LAN port in addition to the two Intel ports. I've also added a 10G card.