





Cull2ArcaHeresy
Members
-
Joined
-
Last visited
Everything posted by Cull2ArcaHeresy
-
one thing is that # comments out the line, so if you know that is the right range then remove the #
-
they switched it to switzerland basically it seems
-
Have had a few issues with seedbox where rutorrent crashes and rtorrent gets stuck, so had to kill and start instead of restart. With this container the few times i have crashed rutorrent it did a similar thing so i had to stop container and then start it again and wait for a longer start time (was like 20 minutes). Monitoring the supervisor log showed that it was working on it tho. Main thing that ive done that has caused crashes so far is dumping too many torrent files into the watch dir at the same time.
-
PIA (Switzerland) connects and ip confirmed to be there. When rutorrent saying port open does not seem to have an impact on speed, but most the time it has port open. My internet is 200/20, so rtorrent config has bandwith limited to 100 down/10 up (12500/1250). In waves ill have full connections at limits, but most the time up/down is less than 1 MB (50+ active torrents or 2). Seeing stuff about PIA transitioning and udp problems, but i have connections (most the time) just speed is almost always minuscule. In the case that this is a disk IO issue, im planning on adding 2 user shares to the container with 1 being cache only (downloading) and the other being normal both (seeding). Have not started this yet because it seems less likely to be the issue.
-
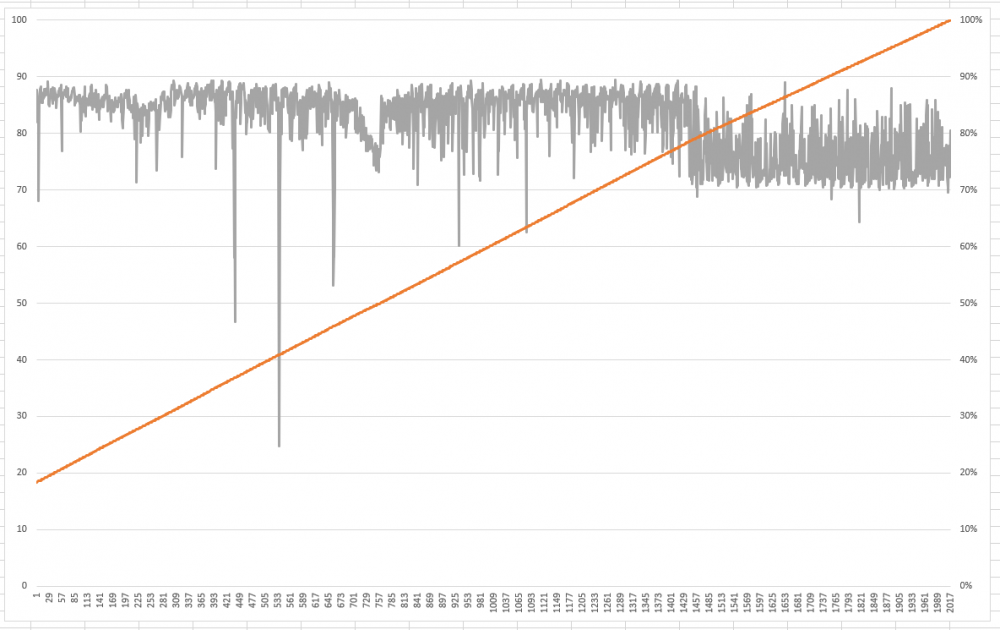
The drop at 80% is weird, but should have a full picture in a week when full run is recorded. Almost 2 days is slow (1d 19h), but tolerable compared to 3.5 days. Since it looks like the slowdown is a 6.8.x issue, ill mark this as solved.
-
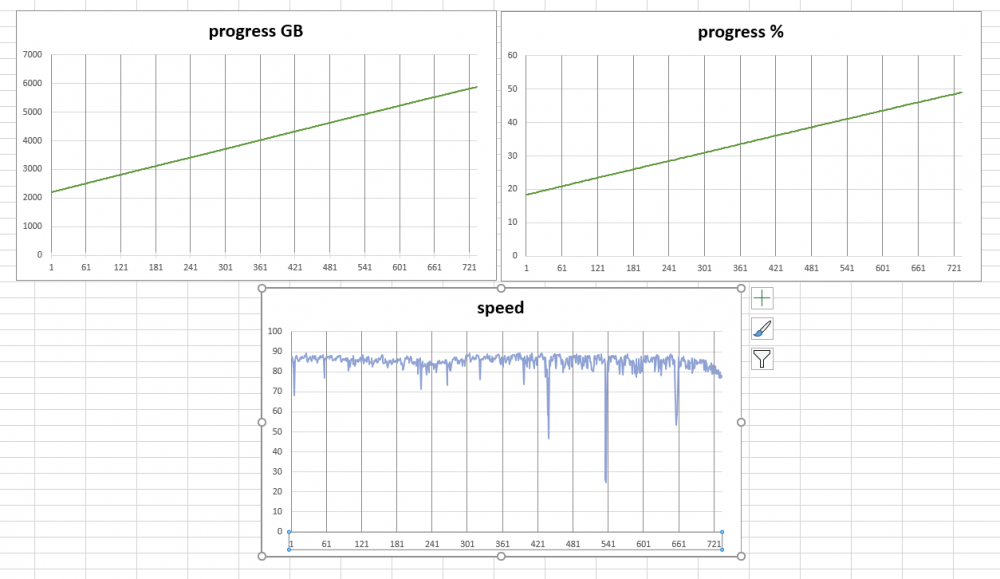
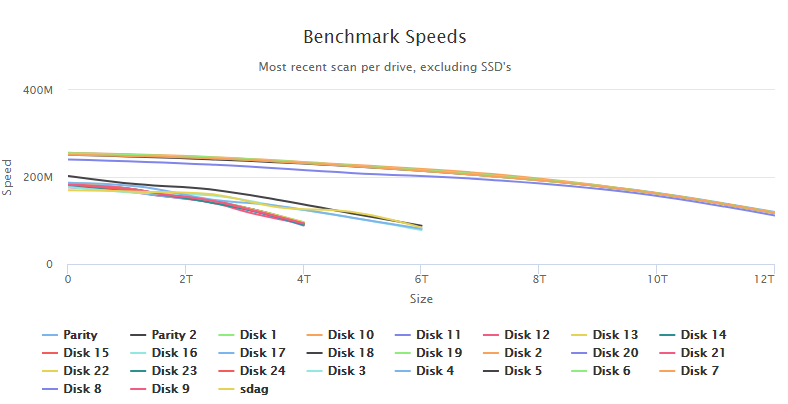
Excel was not cooperating with how was trying to graph, so 3 graphs (left out time left). Stat are grabbed every minute and parsed after from text file since this was thrown in quickly. Will have it fixed and grab the whole run when monthly runs on the 1st and then will add to the linked post. The old config of 8 disk array did at least 1 or 2 parity checks after updating to 6.8.3. Being as there was a check on 5-20 & 5-28, 3 or 4+ checks have happened on 6.8.3 and the many others in the 6.8.X range (i tend to update 1 to 3 months after an update is out as that requires a restart). Currently at 6.03 tb (50.2%), and only reading from the 5 array 12 tb disks (and 2 parity) is still at ~80 (def better than 30/40). Guess I crossed some threshold of disk count to cause slowness in 6.8, probably.
-
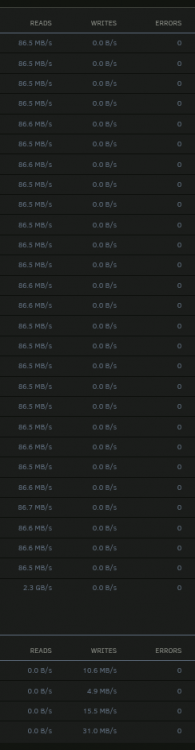
when mover ran (< 1 gig of files) reads dipped a bit but bounced back and have maintained 75 to 88. Still quite a bit slower than used to be. Position is 2.14 tb (17.8%). After it passes the 4tb mark ill update as thats the only main variable left then. Gonna script something to grab the speeds as it goes to be able to see a graph over time and correlations with disk speed graph.
-
i thought i forgot something raza-diagnostics-20200723-1214.zip
-
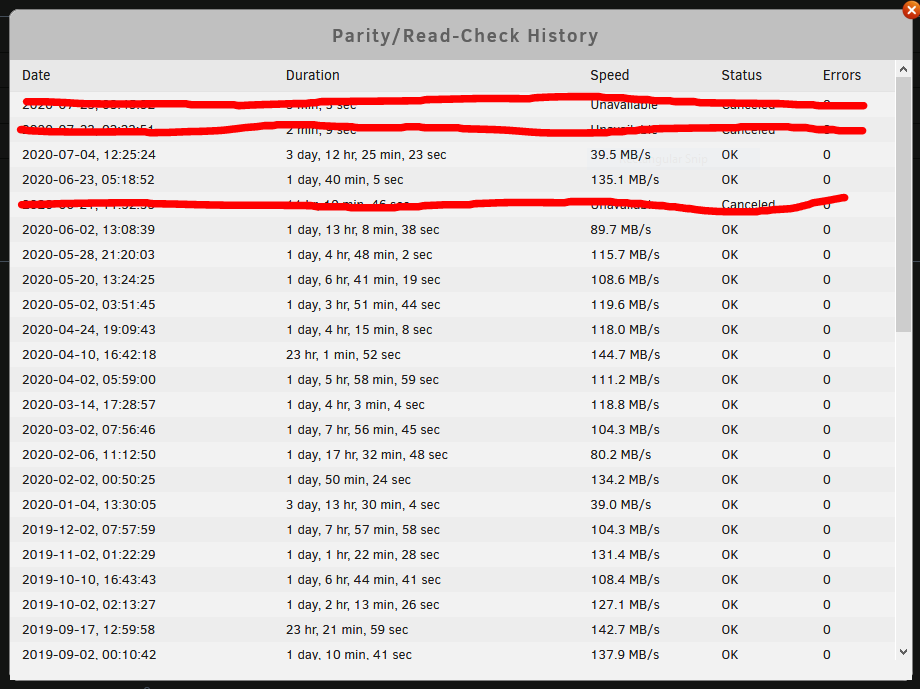
TLDR: why is my parity check speed down to 40 from 100+ ranges? Had 8 data disks (12tb and 6tb) previously. Added 16 4tb drives and everything seemed fine, but when monthly parity check came it took 3.5 days instead of about 1. Duration correlates to speed staying around 40. Altho currently at 1.48tb (12.4%) and getting 70, but that is still way less. Does the parity calculation get exponentially more difficult and makes it slower or i something else going on? The disk speed docker test does not have the 4tb disks capped at 40. A 6tb seagate barracuda (shucked) was added since the first slow check. Being as everything else seems fine I haven't worried about that issue thinking at the next monthly check if it does the same thing then I'll post. I had to perform an unclean shutdown earlier which triggered the check, but canceled it to add the 6tb disk and restarted the check. Note: the 89.7 one i when i was doing alot of IO
-
Today the "Preclear Disk Send Anonymous Statistics" never finishes. Open a new window/tab/refresh and it pops up again. Dismiss does make it go away tho. sending reports again
-
For me the latest update will have preclear saying it is done, but unraid never sees it being done (didn't try a restart). Going back and telling it to preclear the drive again, but with skip post read checked, unraid would be ok with it. Been meaning to come post about it here assuming there might be a bug.
-
I would love to run 3+ cycles, but I kinda need the space sooner than in 2 weeks. It looks like preread and zero are going at the same speed, and thus are each going to take ~16 hours. If I am reading it correctly, it does preread, zero, preread, zero, postread, zero, postread-so 7 steps that all take about the same amount of time, so like 4.7 days per cycle. Definitely going to run multiple cycles on older questionable drives, but they are also 250/500 gigs. Would there be any harm in me stopping the preclears running and starting them again with just 1 cycle? Assuming that math is right, my drives will then be free almost 4 days sooner. I ended up canceling it and it restarting it and it took about 51 hours per drive, so not linear however it works. Thanks for all the help @gfjardim
-
That explains the speed of their runs. I do not see the testing option anymore, but the first time I left it on because it was enabled by default. Since those 2 need to be redone and were part of an array, I assume "erase and clear" is better than just "clear" for operation? And is there any reason for more than 1 cycle (these are new drives, like arrived from amazon and stuck into server)?
-
12tb x 2 and 250gb x 1 claimed they finished. The 12tb x 2 still running taking so much longer are concerning me that there might be a problem. I am getting close to being 24 hours in with the first preclear not yet done, so also trying to figure out how I can start using my storage sooner. RAZA-preclear.disk-20181009-1941.zip
-
My first 2 12tb drives precleared in less than 6 hours last week. I added 2 more yesterday (so I have a full 2 parity drives) and started preclear. Just the pre-read took over 12 hours. The cleared drives currently in there are sitting idle with the array stopped (had started to move files but then decided to finish redundancy first). Now 8 hours in with 54%/56% done at 233/236 MB/s of zeroing (1 of 2) step. Since the first 2 drives are on the left backpane I put these 2 on the right one so both SAS cables are used figuring it would be better distribution. Between the first set of drives and the new 2, there was an update to the preclear app/plugin and the preclear code (system side), if that is the problem. Do I need to be concerned about my first preclear drives because that was too fast? Are these slower than they should be so I should investigate if the backpane has a problem? And I had told it to do 2 rounds of preclear...so am I just SOL for the next few days?




