

jsmj
-
Posts
25 -
Joined
-
Last visited
Content Type
Profiles
Forums
Downloads
Store
Gallery
Bug Reports
Documentation
Landing
Posts posted by jsmj
-
-
I ran a rename command, but got
No space left on deviceHowever I believe I have enough space to get by on. Here are some screenshots and diagnostics are attache. I appreciate any insight.
-
On 9/29/2021 at 12:43 AM, JorgeB said:
Check filesystem on disk3.
Here are the results. Not sure if I should run xfs_repair or not?
Phase 1 - find and verify superblock... - block cache size set to 1449928 entries Phase 2 - using internal log - zero log... zero_log: head block 1279253 tail block 1269441 ALERT: The filesystem has valuable metadata changes in a log which is being ignored because the -n option was used. Expect spurious inconsistencies which may be resolved by first mounting the filesystem to replay the log. - scan filesystem freespace and inode maps... agi unlinked bucket 58 is 29059834 in ag 10 (inode=21503896314) agf_freeblks 53026618, counted 53026614 in ag 6 agi unlinked bucket 15 is 391628815 in ag 13 (inode=28308916239) sb_ifree 11940, counted 13423 sb_fdblocks 151, counted 536381294 - found root inode chunk Phase 3 - for each AG... - scan (but don't clear) agi unlinked lists... - process known inodes and perform inode discovery... - agno = 0 - agno = 1 - agno = 2 - agno = 3 - agno = 4 - agno = 5 - agno = 6 - agno = 7 - agno = 8 - agno = 9 - agno = 10 - agno = 11 - agno = 12 - agno = 13 - agno = 14 - agno = 15 - process newly discovered inodes... Phase 4 - check for duplicate blocks... - setting up duplicate extent list... free space (6,26134123-26134124) only seen by one free space btree free space (6,26135323-26135324) only seen by one free space btree - check for inodes claiming duplicate blocks... - agno = 2 - agno = 1 - agno = 9 - agno = 3 - agno = 5 - agno = 0 - agno = 4 - agno = 8 - agno = 12 - agno = 10 - agno = 6 - agno = 11 - agno = 13 - agno = 14 - agno = 7 - agno = 15 No modify flag set, skipping phase 5 Phase 6 - check inode connectivity... - traversing filesystem ... - agno = 0 - agno = 1 would fix ftype mismatch (2/1) in directory/child inode 2167331754/19334723627 - agno = 2 - agno = 3 - agno = 4 - agno = 5 - agno = 6 - agno = 7 - agno = 8 - agno = 9 - agno = 10 - agno = 11 - agno = 12 - agno = 13 - agno = 14 - agno = 15 - traversal finished ... - moving disconnected inodes to lost+found ... disconnected inode 21503896314, would move to lost+found disconnected dir inode 21505459514, would move to lost+found disconnected inode 28308916239, would move to lost+found Phase 7 - verify link counts... would have reset inode 2167331754 nlinks from 79 to 78 would have reset inode 19334723627 nlinks from 1 to 2 would have reset inode 21503896314 nlinks from 0 to 1 would have reset inode 28308916239 nlinks from 0 to 1 No modify flag set, skipping filesystem flush and exiting. XFS_REPAIR Summary Thu Sep 30 10:10:12 2021 Phase Start End Duration Phase 1: 09/30 10:09:44 09/30 10:09:44 Phase 2: 09/30 10:09:44 09/30 10:09:47 3 seconds Phase 3: 09/30 10:09:47 09/30 10:10:08 21 seconds Phase 4: 09/30 10:10:08 09/30 10:10:08 Phase 5: Skipped Phase 6: 09/30 10:10:08 09/30 10:10:12 4 seconds Phase 7: 09/30 10:10:12 09/30 10:10:12 Total run time: 28 seconds -
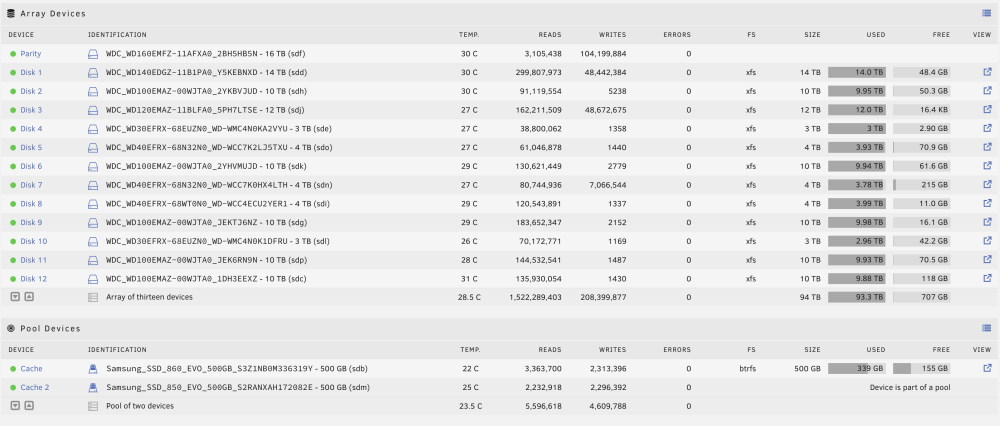
I've got an unmountable disk present that has persisted after reboots and cabling checks. It's a relatively new drive (in the past year). It began life as an easystore. I was low on space so I replaced a small drive while I was checking cabling, so there is a data rebuild going on if you notice that in my logs. Probably frowned upon, I know. Please let me know if you see anything in the logs relating to the unmountable disk. Thanks in advance
-
Just now, OFark said:
How did you find that out? As in how can I find out if my motherboard does that?
The biggest clue for me was that I had symmetrical gigabit speeds when the array was stopped, but speeds fell off when I started the array
-
4 minutes ago, OFark said:
Did you ever resolve this? I seem to be getting 1Gbps into Unraid but only 480Mbps out.
My Ethernet controller and SATA controller were sharing bandwidth and it was saturated. In the short term I moved the drives off the SATA ports and onto a PCI-e SATA card but eventually upgraded the mobo
-
5 minutes ago, johnnie.black said:
Docker image is on disk1, and disk1 is full.
Nailed it. I love it when it's that simple even if I look like a goober. Thank you
-
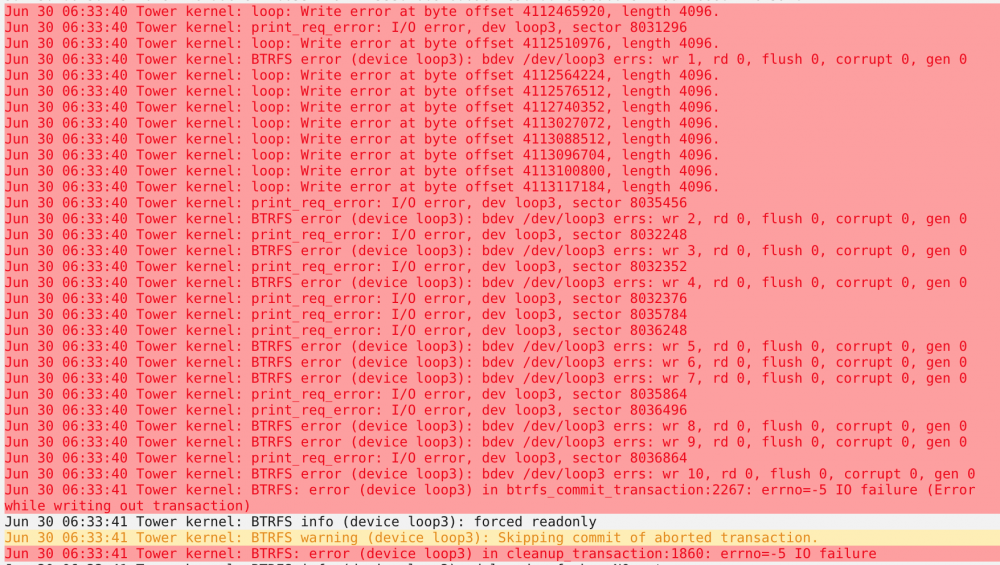
I'm constantly having to delete my docker.img file and reinstall all my dockers. Sometimes even that doesn't work. I get a lot of docker errors saying the file system is read only. At first I thought cache drive, but scrub and check filesystem don't return any errors. My next guess is flash drive? I've attached diagnostics, but let me know if I can provide anything else.
Here's a snippet of logs:
-
2 minutes ago, johnnie.black said:
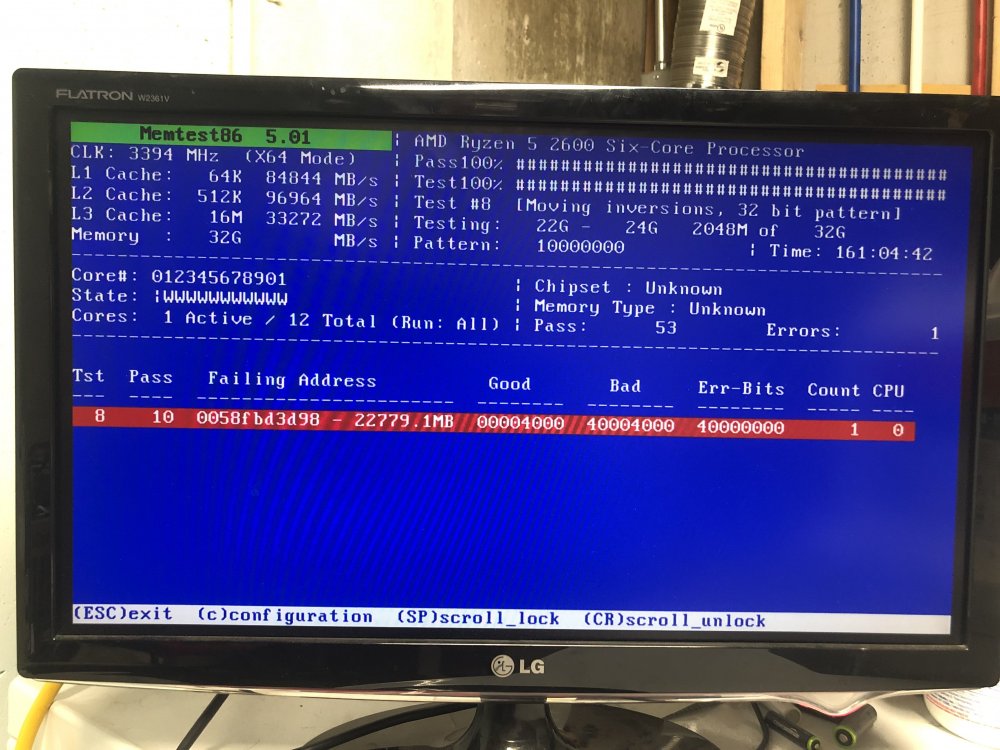
It appears so, so you likely have a bad dimm.
I've reproduced the issue when booting from each individual dimm by itself but I haven't run memtest with a single dimm installed. Is that worth doing?
-
50 minutes ago, johnnie.black said:
Still not acceptable, make sure RAM is not overclocked, it's known to cause issues with some Ryzen systems.
As far as I can tell, memory speeds are unchanged by me and running at 2133. The sticks are rated for 3200. Here's the product page for the memory I'm using.
I've attached the screens for my bios settings
-
Hey guys, sorry I went dark. I was out of town. I started memtest to run over night and forgot to stop it and it ran for 161 hours before I manually shut it down. It accumulated 1 error well after the 24 hour mark.
I tried using a different PCIE GPU and it ran for 3 hours or so before I went to bed with high hopes, but it crashed sometime in the night. When I went to reboot it, it wouldn’t even make it to the boot selector screen before lockup.
This behavior of needing a “rest” after being booted for longer (hour+) periods is super strange to me. The length of time the machine will stay booted seems to be related to the amount of time it’s been powered down. I went out of town and got 3 whole hours of uptime! But if I boot it directly after a crash, it can’t make it long enough to fully boot.
That seems to be a temp issue which I can’t chase down or unraid needing to “forget” something that it did or accumulated in order to cause the crash.
I’d like to make an unraid trial usb and boot from that, but I wanted to check and make sure that’s safe for my data. I wouldn’t start the array.
-
31 minutes ago, Frank1940 said:
Is the case clean of dust and dirt? All cooling fins unclogged? Same for case air intakes and exhausts?
If all of these are OK and if you are running one of the latest versions of Unraid, setup the Syslog Server ( Settings >>> Syslog Server ) to mirror the syslog to your flash drive (turn on Unraid 'Help' for instructions).
EDIT: since this is a brand new system, I would suggest running memtst for 24 hours (unless the memory is ECC).
Next try booting into the 'Safe Mode'.
It's pretty dust free in there. I wouldn't eat out of it, but I've seen far worse. Ventilation shouldn't be a problem. I'll run memtest for 24 hours and see how it goes. Attached is the syslog from the USB after the latest crash and full diagnostics zip
Edit to add: There are 13 files on my flash drive with the name FSCK000*.REC that I don't remember having before. Is this of any significance? I can add my flash backup .zip file as well if that'll help
-
5 hours ago, jonathanm said:
Have you pulled the CPU heatsink off and checked the mounting and redone the paste?
checked the paste today, confirmed the pins aren't bent or anything and redid the paste. No dice. Stayed booted for about 45 minutes, just enough to crush my hopes
-
10 hours ago, Benson said:
Pls try disable C6 state at mainboard BIOS, this a common problem on 1st gen Ryzen ( although you have 2nd gen )
The only setting I found in my BIOS is global C-state, and disabling that didn't solve it
2 hours ago, jonathanm said:Also be sure memory timings are correct. 3200 is way overclocked IIRC.
The RAM settings are unchanged from board default, which is 2133. I tried changing it to 3200 for kicks, and the system won't boot at all that way. I haven't messed with timings or voltage or anything.
This morning I tried a different PSU, which didn't solve anything either. I also ditched the 2 PCI-E 4 port SATA cards for an IBM M1015 HBA in IT mode, which seems to be working properly when the server is running, but I still get the blackouts. I've also noticed that after the machine crashes, subsequent boots only last a couple minutes if it boots at all. If I give it some down time, it'll stay booted for longer, but eventually crashes. I thought this might mean a thermal problem, but I can't find any offending high temps, 40C at the most.
-
I upgraded my mobo and CPU and am having trouble keeping the server booted. Starts up normally, and I can access the GUI over the network. I haven't tried starting the array yet, as I'm worried about the unclean shutdowns. Basically what happens is the server operates normally (as normal as it can without the array mounted) and then falls off the network, and the monitor attached to the machine goes black. Keyboard input does nothing. All I can do is shut it down. I've tried booting from a Ubuntu drive, and I can boot into Ubuntu and noodle around, and it stays booted for a few hours (as long as I've tested), no crash to black screen. I can also run memtest86 from the Unraid flash drive and it runs for hours as well. No crash, but I might have it run again overnight for good measure. Unraid is the only thing that makes it crash so far, and 30 minutes is as long as it'll stay booted. Sometimes it crashes to black sooner or not even get through the boot up process before it crashes to black screen.
Specs:
ASUS ROG Strix B450-F
Ryzen 5 2600
32GB G.Skill 3200 DDR4
Corsair CX600M
MSI GTX 970
Two PCIe 4 port Sata adapters (One is full, the other has one drive attached)
11 Disks (6 on the mobo, 5 on the PCIe SATA cards)
Another thing I've tried is booting UEFI from the flash drive, and this doesn't crash to black. Instead it just will reboot after a few minutes. Logs are attached. Only thing I have yet to try is a new flash drive, and I will as soon as I can keep it booted long enough to download a backup. Can I just copy the contents of the current flash drive onto a new one or is there something special about the backup? I also watched temps in the BIOS for a good while and never saw anything above 40C. BIOS is updated to the current version.
Logs are attached. When I looked through them I ctrl+f'd 'fail' and found a lot, but don't understand them.
Edit: Also tried booting with one stick of RAM and both sticks (16 gb/ea) show the same issue
-
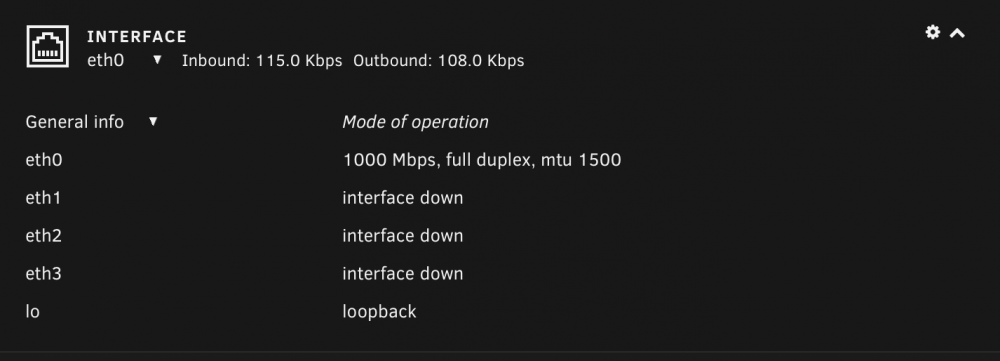
2 hours ago, Tom3 said:
The problem interface appears correct. Depending on age and vendor, some ethernet NICs
had autonegotiation problems. You can turn off autonegotiation for the problem interface and force
1000 full duplex and see if it comes up correctly:
$ ethtool -s eth0 autoneg off speed 1000 duplex full
This is not a 'sticky' setting, it should revert to default on next boot.
-- Tom
Edit: Nevermind, the problem persists. I'm still at 1000 down / 100 up. I get 1G/1G only if the array is offline. If I start the array, the link goes back to 1G/100M 👎
So the bad news, that command took the server off the network completely. I hooked up a monitor to try to do a graceful reboot from the command line, but couldn't get an image, so eventually had to just hard reset it.
The good news is my link is 1G/1G in all directions every which way. No idea why or what or how.The following iperf tests were done with the array offline and result in 1G/1G
iperf3 in both directions for problem server <=> Shield
root@Tower:~# iperf3 -c 192.168.1.208 -i 20
Connecting to host 192.168.1.208, port 5201
[  4] local 192.168.1.101 port 44286 connected to 192.168.1.208 port 5201
[ ID] Interval           Transfer     Bandwidth       Retr  Cwnd
[  4]   0.00-10.00  sec  1.06 GBytes   910 Mbits/sec    0   5.66 KBytes
- - - - - - - - - - - - - - - - - - - - - - - - -
[ ID] Interval           Transfer     Bandwidth       Retr
[  4]   0.00-10.00  sec  1.06 GBytes   910 Mbits/sec    0             sender
[  4]   0.00-10.00  sec  1.06 GBytes   908 Mbits/sec                  receiver

iperf Done.
root@Tower:~# iperf3 -c 192.168.1.208 -i 20 -R
Connecting to host 192.168.1.208, port 5201
Reverse mode, remote host 192.168.1.208 is sending
[  4] local 192.168.1.101 port 44290 connected to 192.168.1.208 port 5201
[ ID] Interval           Transfer     Bandwidth
[  4]   0.00-10.00  sec  1.08 GBytes   932 Mbits/sec
- - - - - - - - - - - - - - - - - - - - - - - - -
[ ID] Interval           Transfer     Bandwidth       Retr
[  4]   0.00-10.00  sec  1.09 GBytes   934 Mbits/sec    0             sender
[  4]   0.00-10.00  sec  1.09 GBytes   932 Mbits/sec                  receiver

iperf Done.
iperf3 in both directions for the other unraid server (server B) A<=>B
root@Tower:~# iperf3 -c 192.168.1.86 -i 20 Connecting to host 192.168.1.86, port 5201 [ 4] local 192.168.1.101 port 42310 connected to 192.168.1.86 port 5201 [ ID] Interval Transfer Bandwidth Retr Cwnd [ 4] 0.00-10.00 sec 1.09 GBytes 935 Mbits/sec 0 5.66 KBytes - - - - - - - - - - - - - - - - - - - - - - - - - [ ID] Interval Transfer Bandwidth Retr [ 4] 0.00-10.00 sec 1.09 GBytes 935 Mbits/sec 0 sender [ 4] 0.00-10.00 sec 1.09 GBytes 934 Mbits/sec receiver iperf Done. root@Tower:~# iperf3 -c 192.168.1.86 -i 20 -R Connecting to host 192.168.1.86, port 5201 Reverse mode, remote host 192.168.1.86 is sending [ 4] local 192.168.1.101 port 42314 connected to 192.168.1.86 port 5201 [ ID] Interval Transfer Bandwidth [ 4] 0.00-10.00 sec 1.10 GBytes 941 Mbits/sec - - - - - - - - - - - - - - - - - - - - - - - - - [ ID] Interval Transfer Bandwidth Retr [ 4] 0.00-10.00 sec 1.10 GBytes 943 Mbits/sec 0 sender [ 4] 0.00-10.00 sec 1.10 GBytes 941 Mbits/sec receiver iperf Done. -
7 minutes ago, Tom3 said:
Ok. I misunderstood the original post problem directionality.
Check the interface setting on the problem Unraid server using the CLI ethtool command.
Here's mine for the problem server. Looks slightly different from yours. Particularly the bits about "Supported pause frame use: Symmetric Receive-only" and the port being MII while yours is "twisted pair". PHYAD is different as well
root@Tower:~# ethtool eth0
Settings for eth0:
	Supported ports: [ TP MII ]
	Supported link modes:   10baseT/Half 10baseT/Full
	                        100baseT/Half 100baseT/Full
	                        1000baseT/Half 1000baseT/Full
	Supported pause frame use: Symmetric Receive-only
	Supports auto-negotiation: Yes
	Supported FEC modes: Not reported
	Advertised link modes:  10baseT/Half 10baseT/Full
	                        100baseT/Half 100baseT/Full
	                        1000baseT/Half 1000baseT/Full
	Advertised pause frame use: Symmetric Receive-only
	Advertised auto-negotiation: Yes
	Advertised FEC modes: Not reported
	Link partner advertised link modes:  10baseT/Half 10baseT/Full
	                                     100baseT/Half 100baseT/Full
	                                     1000baseT/Full
	Link partner advertised pause frame use: Symmetric Receive-only
	Link partner advertised auto-negotiation: Yes
	Link partner advertised FEC modes: Not reported
	Speed: 1000Mb/s
	Duplex: Full
	Port: MII
	PHYAD: 0
	Transceiver: internal
	Auto-negotiation: on
	Supports Wake-on: pumbg
	Wake-on: g
	Current message level: 0x00000033 (51)
			       drv probe ifdown ifup
	Link detected: yes
root@Tower:~#
And here's the output from the other server that has a working 1G/1G link.
Settings for eth0:
	Supported ports: [ TP ]
	Supported link modes:   10baseT/Half 10baseT/Full
	                        100baseT/Half 100baseT/Full
	                        1000baseT/Full
	Supported pause frame use: No
	Supports auto-negotiation: Yes
	Supported FEC modes: Not reported
	Advertised link modes:  10baseT/Half 10baseT/Full
	                        100baseT/Half 100baseT/Full
	                        1000baseT/Full
	Advertised pause frame use: No
	Advertised auto-negotiation: Yes
	Advertised FEC modes: Not reported
	Speed: 1000Mb/s
	Duplex: Full
	Port: Twisted Pair
	PHYAD: 1
	Transceiver: internal
	Auto-negotiation: on
	MDI-X: off
	Supports Wake-on: g
	Wake-on: d
	Link detected: yes
-
11 minutes ago, Tom3 said:
If the link comes up at 1G in one direction, then it's unlikely to be a cable problem.
1G uses all 4 pairs full-duplex. If they work one-way then the cable is good with high
probability.
You may want to try a different client device. The symptoms suggest that the client is not
auto-negotiating a 1G link, but the server is. This could be due to settings on the client,
or a defect in the client.
-- Tom
I'm testing using two clients: another Unraid server (call it server B), and an Nvidia Shield. The Shield has an app that allows it to host an iperf3 connection. I get 1Gbps/1Gbps in both directions on both those machines when testing between them. So they are both negotiating a 1G link. It's only when I test either of those clients against the problem Unraid server (call it server A).
A => B = <100 Mbps
A => Shield = <100 Mbps
Shield => A = 1000 Mbps
B => A = 1000 Mbps
B <=> Shield = 1000 Mbps
Here are the iperfs between B and Shield in both directions, but to summarize, they are both able to negotiate a 1Gbps link both ways
Connecting to host 192.168.1.208, port 5201
[  4] local 192.168.1.86 port 53388 connected to 192.168.1.208 port 5201
[ ID] Interval           Transfer     Bandwidth       Retr  Cwnd
[  4]   0.00-10.00  sec  1.04 GBytes   889 Mbits/sec    0   5.66 KBytes
- - - - - - - - - - - - - - - - - - - - - - - - -
[ ID] Interval           Transfer     Bandwidth       Retr
[  4]   0.00-10.00  sec  1.04 GBytes   889 Mbits/sec    0             sender
[  4]   0.00-10.00  sec  1.03 GBytes   887 Mbits/sec                  receiver

iperf Done.
root@TwoTower:~# iperf3 -c 192.168.1.208 -i 20 -R
Connecting to host 192.168.1.208, port 5201
Reverse mode, remote host 192.168.1.208 is sending
[  4] local 192.168.1.86 port 53394 connected to 192.168.1.208 port 5201
[ ID] Interval           Transfer     Bandwidth
[  4]   0.00-10.00  sec  1.01 GBytes   867 Mbits/sec
- - - - - - - - - - - - - - - - - - - - - - - - -
[ ID] Interval           Transfer     Bandwidth       Retr
[  4]   0.00-10.00  sec  1.01 GBytes   869 Mbits/sec    0             sender
[  4]   0.00-10.00  sec  1.01 GBytes   867 Mbits/sec                  receiver

iperf Done.
-
Best I can tell, MTU is set to 1500 on the two Unraid machines I am testing between. The other device I'm using is an Nvidia Shield and I don't believe there's a way to set MTU without rooting it

-
11 minutes ago, jsmj said:
I've changed cables, tested cables, changed ports on the switch and router, and I'm out of ideas
That was the first thing I tried. Was really hoping it'd be something simple like that
-
Hey guys, I'm trouble shooting an asymmetrical network link. I get gigabit speeds when going from client -> unraid server, but 100 Mbits/sec (at best) when testing from Unraid -> client. I've changed cables, tested cables, changed ports on the switch and router, and I'm out of ideas. The lights on the switch show full duplex 1000 link, as does Unraid on the dashboard. Here are a couple iperf3 results with the server acting as client (sending):
root@Tower:~# iperf3 -c 192.168.1.86 -i 20
Connecting to host 192.168.1.86, port 5201
[  4] local 192.168.1.101 port 40006 connected to 192.168.1.86 port 5201
[ ID] Interval           Transfer     Bandwidth       Retr  Cwnd
[  4]   0.00-10.00  sec  36.6 MBytes  30.7 Mbits/sec  24588   79.2 KBytes
- - - - - - - - - - - - - - - - - - - - - - - - -
[ ID] Interval           Transfer     Bandwidth       Retr
[  4]   0.00-10.00  sec  36.6 MBytes  30.7 Mbits/sec  24588             sender
[  4]   0.00-10.00  sec  34.5 MBytes  29.0 Mbits/sec                  receiver

iperf Done.
root@Tower:~# iperf3 -c 192.168.1.208 -i 20
Connecting to host 192.168.1.208, port 5201
[  4] local 192.168.1.101 port 47854 connected to 192.168.1.208 port 5201
[ ID] Interval           Transfer     Bandwidth       Retr  Cwnd
[  4]   0.00-10.00  sec  94.8 MBytes  79.5 Mbits/sec  65838   67.9 KBytes
- - - - - - - - - - - - - - - - - - - - - - - - -
[ ID] Interval           Transfer     Bandwidth       Retr
[  4]   0.00-10.00  sec  94.8 MBytes  79.5 Mbits/sec  65838             sender
[  4]   0.00-10.00  sec  93.6 MBytes  78.5 Mbits/sec                  receiver

iperf Done.
And here are a couple more with the -R flag to show I get 1Gps in the other direction (receiving):
root@Tower:~# iperf3 -c 192.168.1.86 -i 20 -R
Connecting to host 192.168.1.86, port 5201
Reverse mode, remote host 192.168.1.86 is sending
[  4] local 192.168.1.101 port 40156 connected to 192.168.1.86 port 5201
[ ID] Interval           Transfer     Bandwidth
[  4]   0.00-10.00  sec  1.07 GBytes   919 Mbits/sec
- - - - - - - - - - - - - - - - - - - - - - - - -
[ ID] Interval           Transfer     Bandwidth       Retr
[  4]   0.00-10.00  sec  1.07 GBytes   920 Mbits/sec    0             sender
[  4]   0.00-10.00  sec  1.07 GBytes   919 Mbits/sec                  receiver

iperf Done.
root@Tower:~# iperf3 -c 192.168.1.208 -i 20 -R
Connecting to host 192.168.1.208, port 5201
Reverse mode, remote host 192.168.1.208 is sending
[  4] local 192.168.1.101 port 48004 connected to 192.168.1.208 port 5201
[ ID] Interval           Transfer     Bandwidth
[  4]   0.00-10.00  sec  1.07 GBytes   923 Mbits/sec
- - - - - - - - - - - - - - - - - - - - - - - - -
[ ID] Interval           Transfer     Bandwidth       Retr
[  4]   0.00-10.00  sec  1.08 GBytes   925 Mbits/sec    0             sender
[  4]   0.00-10.00  sec  1.07 GBytes   923 Mbits/sec                  receiver

iperf Done.
My next thought is replacing the onboard Realtek NIC (8111C), but I'm kind of running out of expansion slots so I want to be sure that's the issue first before I tackle that. Any ideas? Logs are attached
-
Alright, preclear finished over night and I formatted and added the drive to the pool this morning
Rebooted and rootfs warning was gone from FCP
Successfully updated to 6.6.7, rebooted again (new UI looks legit)
FCP is reporting no problems, Plex seems to be working and behaving normally. Best I can tell I'm in the clear. Thanks guys
-
alright I moved the /config mapping to /mnt/user/appdata/plex and when this preclear finishes I'll reboot and see where that gets me. I had to set up the Plex libraries again but I take it the'll stick now that they're on a physical drive

-
Quote
you don't actually have the preclear plugin installed.
I don't. I used to, but I was under the impression that it's no longer needed and that the server will take care of it by default when the array is spun up with a new drive.
QuoteYou have given your docker image 50G
It was set at 10G by default and I was nearing that limit. I wasn't sure a sane value to expand it to and 50G sounded good and I had the storage. This was quite awhile back.
QuoteBut according to your diagnostics, you don't have actually have cache
the only /mnt/cache mapping I can see is Plex /config mapped to /mnt/cache/appdata/Plex. But it's been like this for months. Could it slowly grow to fill rootfs and be finally cropping up? What should it be mapped to if not /mnt/cache/appdata?

-
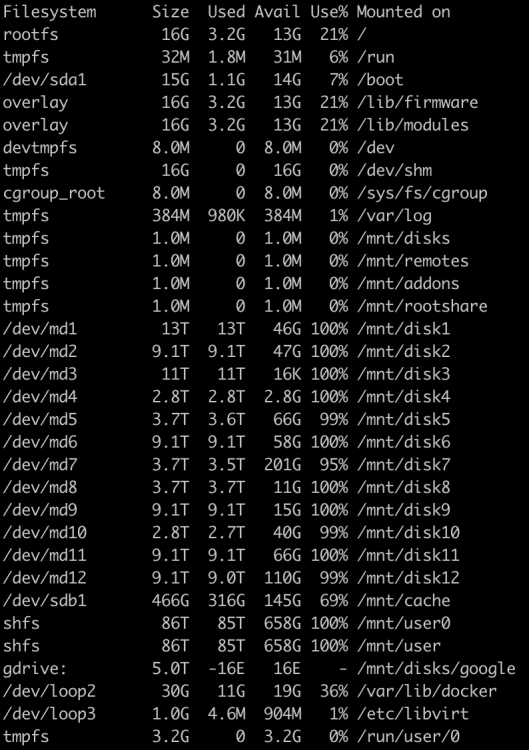
Hey friends. I can't figure this one out. My Fix Common Problems plugin is griping that rootfs is getting full. If I understand it right, something is either writing to /tmp or memory, but best I can tell my dockers all write to /mnt/user or /mnt/disk# or /mnt/cache, but I could have overlooked something.
Possibly related, I can't download the 6.7 update because I get a i/o failure. From googling this is because the gui saves the update to RAM, and mine is full from the rootfs issue. I've attached my diagnostics from Fix Common Problems. Let me know if I can provide anything else.
I'm currently pre-clearing a drive, if that matters. Just trying to include everything I can think of that's going on.


Getting false (I think) "No space left on device" errors when renaming files
in General Support
Posted
I've tried a couple ways. I'm trying to reformat the file names of a batch of 7 .mp3 files with:
find . -iname "*.mp3" -exec rename '[02-0' 2 '{}' \;It worked for 3 of the files before spitting out the "No space left on device" for the other 4. On repeat runs of the command, I just get the "No space left on device" error without any further progress.
But I also tried in macOS (over SMB I presume?) in Finder. Even just making a single change to a single file name generates this error: