falconexe
-
Posts
789 -
Joined
-
Days Won
15
Content Type
Profiles
Forums
Downloads
Store
Gallery
Bug Reports
Documentation
Landing
Everything posted by falconexe
-
Can you try these settings and let me know if it still does that? Change your host to "NAS".

-
Oh wow. Not sure what's going on there. I didn't mess with any of that. You want to see if you can fix it and I can merge it into version 1.3?
-
How did you get around that dynamically? What did you use? Screenshot please...😁
-
@GilbN In fact, I actually made no changes to the variables from your original dashboard. They all worked so great LOL.

-
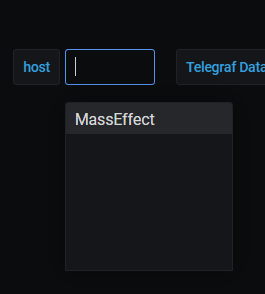
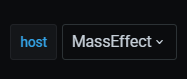
@GilbN For the User0 path, aren't they all the same in that they are "rootfs/mnt/user0"? In that case, why would we need to Regex it? I only hard coded paths where they are the same for all users to my knowledge... "And your host variable is broken. It should list the host in that drop down. " Also, do you mean that the variable in MY version 1.2 is broken? Or his? Mine shows the following: So it appears to be working and picking it up dynamically.

-
OK a lot to unpack here ha ha. #1. Glad to see you see something. Looks like that original issue is resolved. #2. So here is where the fun begins. You need to go into each panel and adjust the queries/overrides to match your exact architecture. So let's start with the array size. That uses mnt/User0. So you should not need to adjust it. Have you tried refreshing manually in the upper right hand corner? Or change the time line to last 5 minutes then back to last 24 hours? Sometimes upon initially loading the database, the GUI will fail to show data. You can also just close your browser, clear your cookies, and try again. #3. On the S.M.A.R.T. dashboard I created, you will need to go in there an adjust he overrides where we are mapping the drive device to the drive name. My kernal mounts will not necessarily match yours (sd*). So you will need to modify the value mappings. Same thing with each of the 4 "Storage" panels.

-
@FreeMan Oh yeah, we had you try to place the path in there as a way to test. Please remove that by commenting it out. My config matches @GilbN's. Just those 2 lines are ON.
-
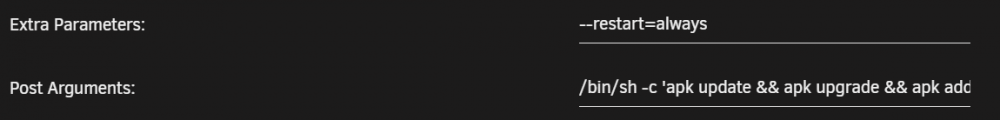
I'll defer to @GilbN on that one. Your syntax appears correct: Mine: /bin/sh -c 'apk update && apk upgrade && apk add ipmitool && apk add smartmontools && telegraf' Yours: /bin/sh -c 'apk update && apk upgrade && apk add ipmitool && apk add smartmontools && telegraf' After running that, my log is clean. You can see it installing/updating each of the plugins. The --restart=always command just tells the docker to restart after a server boot or array stoppage. It is just another way of setting it to restart instead of using the button on the Docker page within the native UNRAID dashboard. Just a style thing. I like the code because I can see it and I know it works 100% of the time.

-
@FreeMan If the above still does not work, you may also need to install the S.M.A.R.T. plugin as it may have never been initially loaded. Right click the Telegraf docker, select Console, and run "apk add smartmontools". Please report back and let us know.
-
Agreed. Added to Install Instructions.
-
@FreeMan Actually add this. It will load both IPMI and S.M.A.R.T. when the docker automatically starts. I believe this is why it was not finding it in your path. Without these extra arguments, you would have to manually bash into the docker and manually load them each time the Docker updates/restarts. /bin/sh -c 'apk update && apk upgrade && apk add ipmitool && apk add smartmontools && telegraf' Report back and let me know if your log is no long spamming pink.
-
You guys ROCK. @GilbN, you were missing the close quote on the end BTW... So this works perfectly: Solved: /bin/sh -c 'apk update && apk upgrade && apk add ipmitool && apk add smartmontools && telegraf' I added this in the topic header under Dependencies so new users know to do this.
-
@Roxedus Thanks again for this tip. So what if you need to do multiple of these? The way I have UUD setup currently is we use both IPMI and Smart. Do you know the syntax to place multiple arguments? I've tried the following. Individually, they both work, but combined, they do not. Docker Post Arguments: Fails: /bin/sh -c 'apk update && apk add ipmitool && telegraf' /bin/sh -c 'apk update && apk add smartmontools && telegraf' /bin/sh -c 'apk update && apk add ipmitool && telegraf', /bin/sh -c 'apk update && apk add smartmontools && telegraf' /bin/sh -c 'apk update && apk add ipmitool && telegraf' 'apk update && apk add smartmontools && telegraf'
-
I have a meeting for actual work ha ha. I'll take a look at this later today. But yes, it appears that it cannot communicate with your UPS. I have an APC 1500 so it does work. Try placing your IP address in the servers line and uncomment it.
-
@FreeMan Add this to your Post Arguments on the Docker Edit Page for Telegraf. /bin/sh -c 'apk update && apk add smartmontools && telegraf' This fixes the issue on my side when testing.
-
Hang tight. I found the fix. Testing now...
-
Agreed if you are getting S.M.A.R.T. reports anywhere, then it is working. Perhaps you need to explicitly tell it the path in the Telegraf config for some reason on your system. Can you try uncommenting this line and ensuring the path for your server is correct? # # Read metrics from storage devices supporting S.M.A.R.T. [[inputs.smart]] # ## Optionally specify the path to the smartctl executable # # path = "/usr/bin/smartctl"
-
I noticed you are still loading HDDTemp. You can comment that out in the config since we will be using S.M.A.R.T. exclusively to pull temps. 20-09-14T18:40:25Z I! Starting Telegraf 1.15.3 2020-09-14T18:40:25Z I! Using config file: /etc/telegraf/telegraf.conf 2020-09-14T18:40:25Z I! Loaded inputs: processes hddtemp netstat disk diskio docker sensors kernel apcupsd net smart cpu swap mem system
-
I added this to the list of plugins to enable in the announcement post. Thanks for catching that. I forgot about that one...
-
Thanks for this tip. That is good to know!
-
I have this line commented out. Try that. # nocheck = "standby" Please also screenshot one of the queries where you are trying to select any drive data. I need to look at how/what it is trying to do. Maybe the Array I/O section or drive temps panel would be a good place to start. In all cases, you will need to correctly pick your drive(s) in these queries. After some other searching, you may have to enable S.M.A.R.T. on your drives explicitly. I found the below command. Where "X" is your correct last drive kernel letter. However, you really shouldn't have to do this as my drives had smart natively within UNRAID. Nothing special had to be done. My guess is that you don't need to do this, but wanted to throw it out there as some people couldn't get S.M.A.R.T. to work until they ran this command (use at your own risk). smartctl -s /dev/sdX
-
RESOURCES: Original Forum Post Where I Initially Developed UUD Versions 1.0 & 1.1: Tutorials: @GilbN's great getting started tutorial: https://technicalramblings.com/blog/how-to-setup-grafana-influxdb-and-telegraf-to-monitor-your-unraid-system/ Telegraf Plugins: https://github.com/influxdata/telegraf/tree/release-1.15/plugins/inputs REGEX: Cheat Sheet: https://www.keycdn.com/support/regex-cheatsheet Online REGEX Tool-Practice-Lab: https://regexr.com/ Another Great REGEX Tool: https://www.regextester.com/ Database Logic / Boolean Operators (AND, OR, NOT, EQUAL, NOT EQUAL, etc.) https://libguides.mit.edu/c.php?g=175963&p=1158594 https://www.w3resource.com/sql/boolean-operator/sql-boolean-operators.php Docker Support: @atribe Docker Repo (Base Dockers):
-
LATEST RELEASE NOTES: Version 1.7 (Current) https://forums.unraid.net/topic/96895-ultimate-unraid-dashboard-uud/?do=findComment&comment=1396860 Previous Release Notes: Version 1.6 Version 1.5 Version 1.4 Version 1.3
-
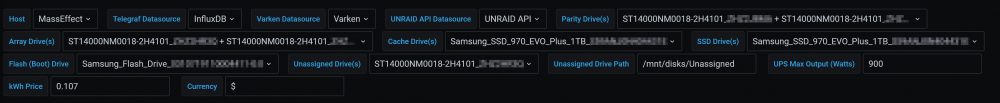
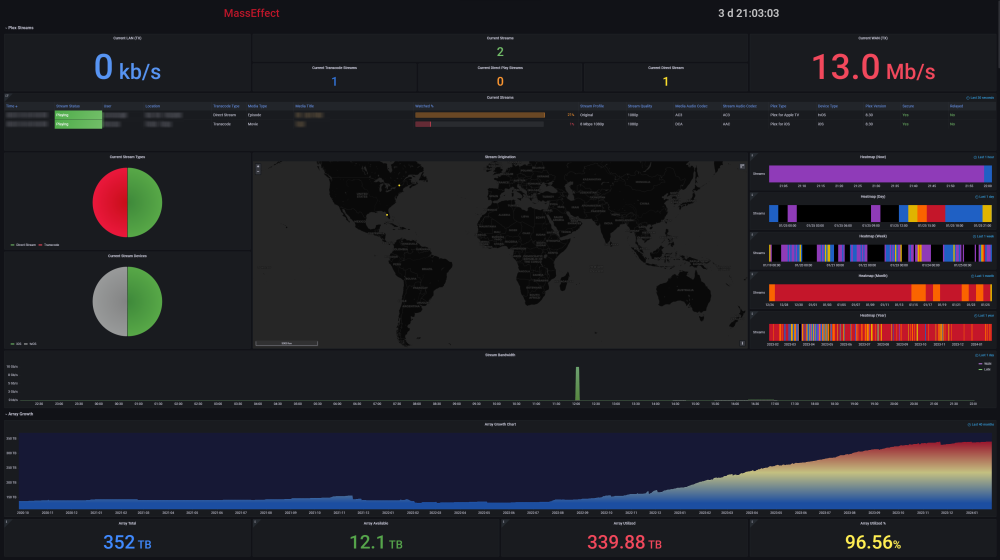
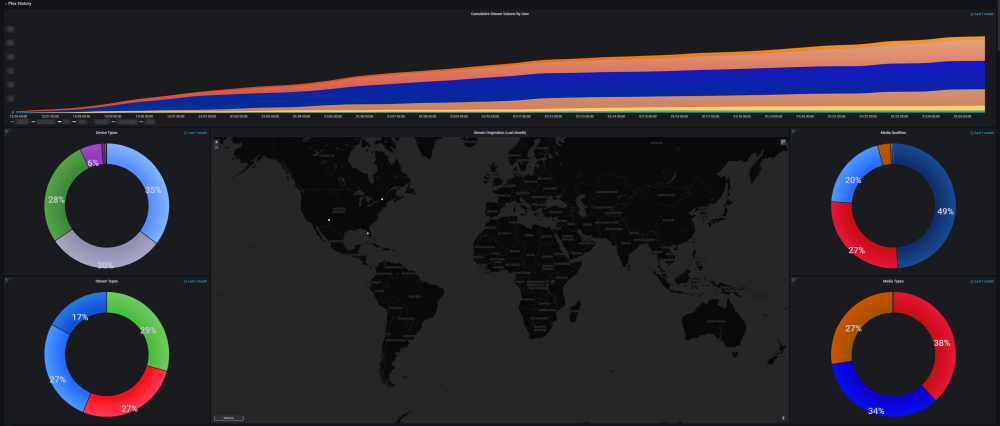
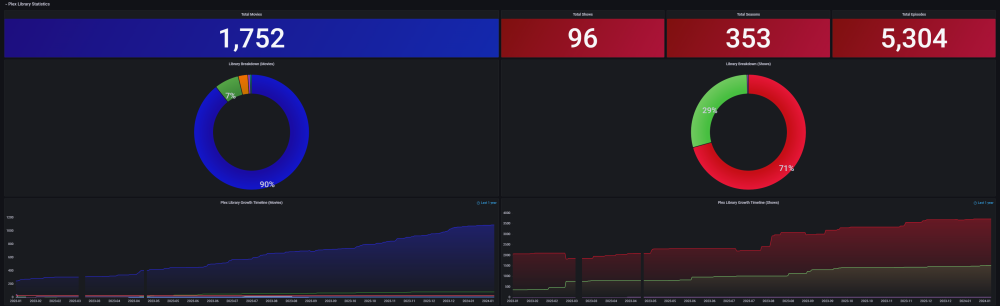
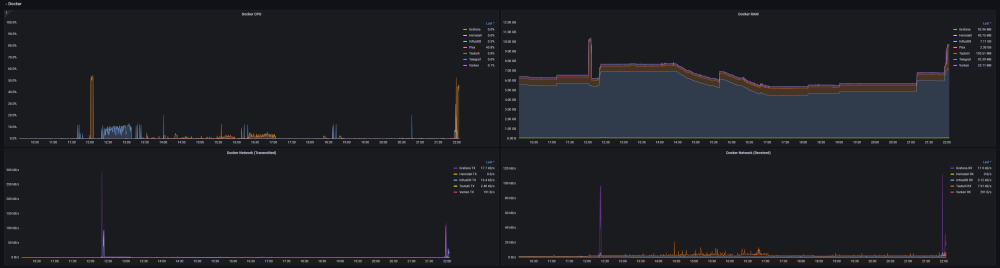
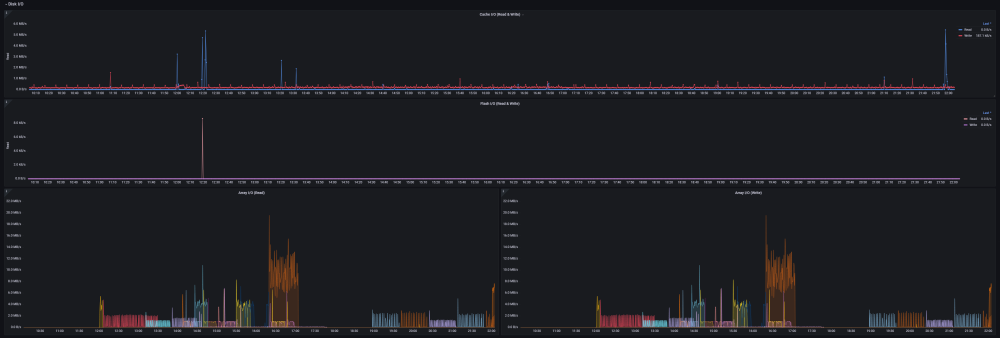
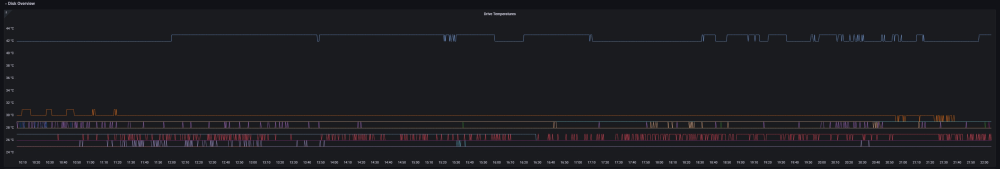
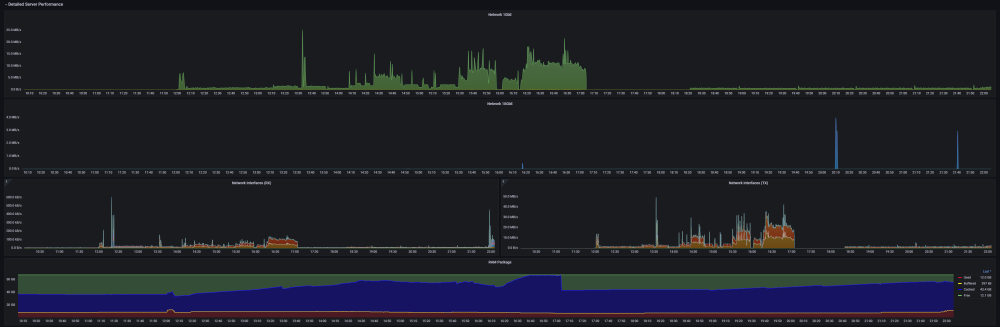
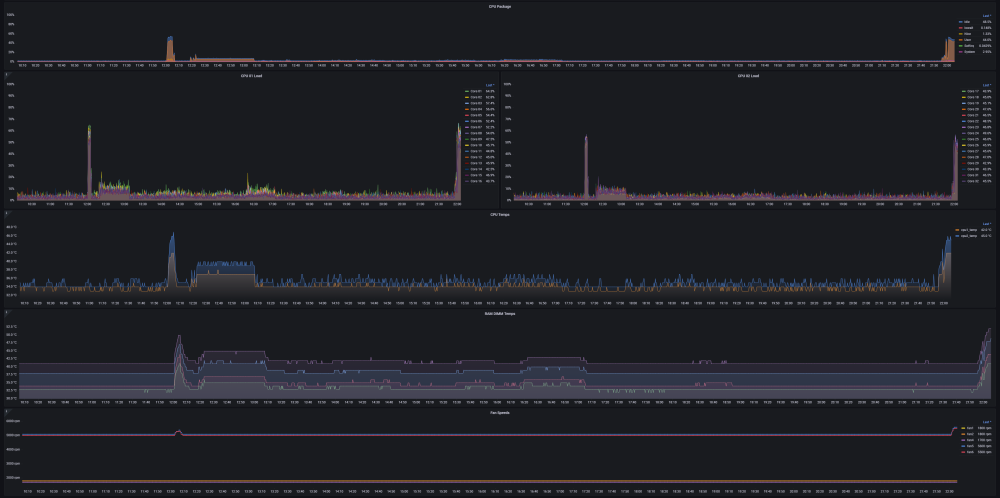
Ultimate UNRAID Dashboard (UUD) Current Release: UUD 1.7 (2024-03-30) UUD NEWS: 2024-03-30: UUD Version 1.7 is Released 2022-06-19: The UUD Forum Topic Reaches 200,000 Views! 👀👀👀 2022-04-17: The UUD Tops 5,000 Unique Downloads 💾💾💾 🎉 2021-05-26: The UUD Forum Topic Reaches 1,000 Replies! 2021-04-17: The UUD Forum Topic Reaches 100,000 Views! 👀👀 2021-03-26: The UUD Tops 2,500 Unique Downloads 💾💾 🎉 2021-03-23: UUD 1.6 is Featured Again in the "Best of the Forum" Blog 🥇🥇 2021-03-21: The UUD Forum Topic Reaches 75,000 Views! 👀 2021-03-20: UUD Version 1.6 is Released 2021-01-19: The UUD Forum Topic Reaches 50,000 Views! 👀 2021-01-11: The UUD Tops 1,000 Unique Downloads 💾 🎉 2021-01-07: UUD is Featured as the FIRST "Best of the Forum" Blog 🥇 2021-01-06: UUD Donations Site is Created 2020-12-31: UUD Version 1.5 is Released 2020-10-09: UUD Version 1.4 is Released 2020-09-28: The UUD is Featured in the Official UNRAID Monthly Newsletter (September 2020)! 2020-09-21: UUD Version 1.3 is Released 2020-09-14: UUD Version 1.2 is Released 2020-09-12: UUD Version 1.1 is Released 2020-09-11: The UUD is Born and Version 1.0 is Released Overview: Welcome to the OFFICIAL UUD forum topic. The UUD is my attempt to develop the Ultimate Grafana/Telegraf/InfluxDB/Plex/Tautulli/Varken dashboard. This entire endeavor started when one of our fellow users @hermy65 posed a simple, but complex question in another forum topic (see post #3). I decided to give it a shot, as I am an IT professional, specifically in enterprise data warehouse/SQL server. After a few days of hard work, UUD version 1.0 was released. We are currently on Version 1.6, and the project is in active development. If you are a Grafana developer, or have had experience building dashboards/panels for UNRAID, please let me know. I would love to collaborate. Version 1.7 Screenshots (Click the Images as They are Very High Resolution): Disclaimer: This is based on my 30 Drive UNRAID Array. So this shows an example of a fully maxed out UNRAID setup with max drives, dual CPUs, Dual NICs, etc. You will/may need to adjust panels & queries to accommodate your individual UNRAID/PLEX architecture. I have spent many hours custom coding new functionality and features based on that original template. Much has been learned and I am excited to see how far this can go in the future. Thanks again! Developers: Primary Developer: @falconexe (USA) UUD Creator | Active Development | Panels | Database Queries | Integration | Look & Feel | GUI | Refinement | Support Developer/Colleague: @GilbN (Europe) Dashboard Examples | Back-end | Dynamics | REGEX | Support | Tutorials Contributors: @hermy65 @atribe @Roxedus @SpencerJ @testdasi @ChatNoir @MammothJerk @FreeMan @danktankk @Dazog @MrLondon @LTM @mattekure @ptchernegovski @caplam @RockDawg @corgan @jbartlett @Hoopster @LTM @skaterpunk0187 @valiente @Agent531C @JudMeherg @Jturner @1471 Dependencies (Last Updated On 2021-03-20) Docker - InfluxDB Docker - Telegraf Docker Network Type: HOST (Otherwise You May Not Get All Server Metrics) 👉 Create Telegraf Configuration File 👈 (DO THIS FIRST!) Create and Place a File into Directory "mnt/user/appdata/YOUR_TELEGRAF_FOLDER" Enable and Install Telegraf Plugins Telegraf Plugin - [[inputs.net]] Enable in telegraf.config Telegraf Plugin - [[inputs.docker]] Enable in telegraf.config Telegraf Plugin - [[inputs.diskio]] Enable in telegraf.config To Use Static Drive Serial Numbers in Grafana (For DiskIO Queries) Do the Following: Edit telegraf.conf > [[inputs.diskio]] > Add device_tags = ["ID_SERIAL"] > Use ID_SERIAL Flag in Grafana Now Upon Booting, You Don't Have to Worry About SD* Mounts Changing (So Your Graphs Don't Get Messed Up!) You Can Also Set Overrides on the Query Fields to Map the Serial Number to a Common Disk Name Like "DISK01" etc. Telegraf Plugin - [[inputs.smart]] Enable in telegraf.config Also Enable "attributes = true" Bash Into Telegraf Docker and Run "apk add smartmontools" Telegraf Plugin - [[inputs.ipmi_sensor]] Enable in telegraf.config Bash Into Telegraf Docker and Run "apk add ipmitool" Telegraf Plugin - [[inputs.apcupsd]] Enable in telegraf.config Telegraf Docker Config Add New Path (NOTE: This path has now been merged into Atribe's Telegraf Docker Image. (Thanks @GilbN & @atribe) Post Arguments "/bin/sh -c 'apk update && apk upgrade && apk add ipmitool && apk add smartmontools && telegraf'" Docker - Grafana Grafana Plugins Pie Chart Panel Run Following Command in Docker: grafana-cli plugins install grafana-piechart-panel World Map Run Following Command in Docker: grafana-cli plugins install grafana-worldmap-panel JSON API Run Following Command in Docker: grafana-cli plugins install marcusolsson-json-datasource Dynamic Image Panel Run Following Command in Docker: grafana-cli plugins install dalvany-image-panel Docker - Tautulli Docker - Varken CA Plugin: IPMI Tools License: GeoLite2 (Free) NON SERVER HARDWARE (If You Cannot Use "IPMI" and Need to Use "Sensors") As an alternate to IPMI to monitor CPU/System/Aux Temps, you can try the Sensors Plugin. Telegraf Plugin - [[inputs.sensors]] Enable in the Telegraf Config (Uncomment It) Bash into the Telegraf Docker and Execute "apk add lm_sensors" Stop All 3 Dockers (Grafana > Telegraf > InfluxDB) If You Want to Keep This Plugin in Perpetuity, You Will Need to Modify Your Telegraf Docker Post Arguments (Adding lm_sensors): "/bin/sh -c 'apk update && apk upgrade && apk add ipmitool && apk add smartmontools && apk add lm_sensors && telegraf'" Start All 3 Dockers (InfluxDB > Telegraf > Grafana) Dashboard Variables (Update These For Your Server): I haven't been this geeked out about my UNRAID server in a very long time. This is the cherry on top for my UNRAID experience going back to 2014 when I built my first server. Thanks everyone! VERSION 1.7 (Current) Ultimate UNRAID Dashboard - Version 1.7 - 2024-03-30 (falconexe).json @SpencerJ


- 1331 replies
-
- 22
-

-

-
WOW. I can't believe this is actually a thing. Hilarious ha ha.