

Majawat
-
Posts
31 -
Joined
-
Last visited
Content Type
Profiles
Forums
Downloads
Store
Gallery
Bug Reports
Documentation
Landing
Posts posted by Majawat
-
-
Much appreciated, itimpi! Is there any way to figure out what's doing the reads/writes?
26 minutes ago, itimpi said:stop whatever (person or application) is doing that array activity.
-
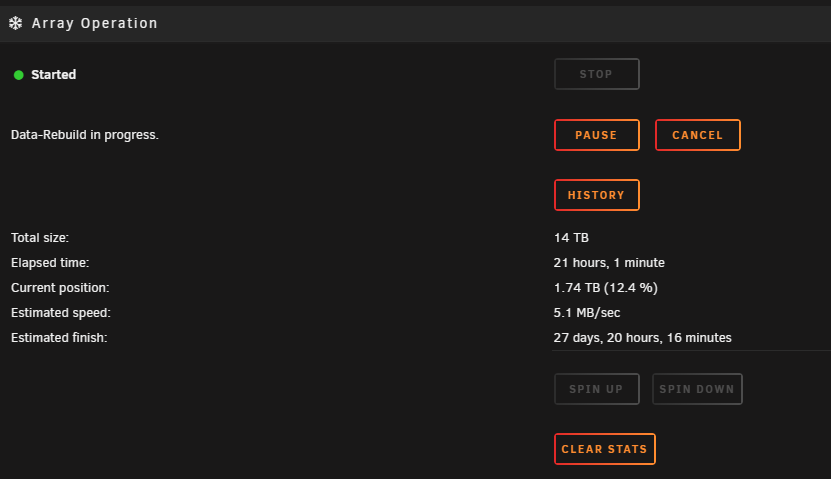
My hard drives filled up (<1TB free), so I replaced an 8TB drive (a shucked WD80EFZX) with a 14TB drive (ST14000NT001 from serverpartdeals.com). I stopped the array, unassigned the device, shut down, replaced drive using the same power and SATA cable, started server, assigned drive, and started the array.
But the parity rebuild is taking forever. Much longer than it has in the past, which would be a few days. But now it's between 30 and 80 days at times; around 3-5Mb/s. I have no idea how to troubleshoot this and I'm concerned I got a bad drive or something.
Is there an issue I'm overlooking? What can I do to speed this rebuild up?
Any help would be greatly appreciated. Thank you. Dignostics attached.
-
45 minutes ago, JonathanM said:
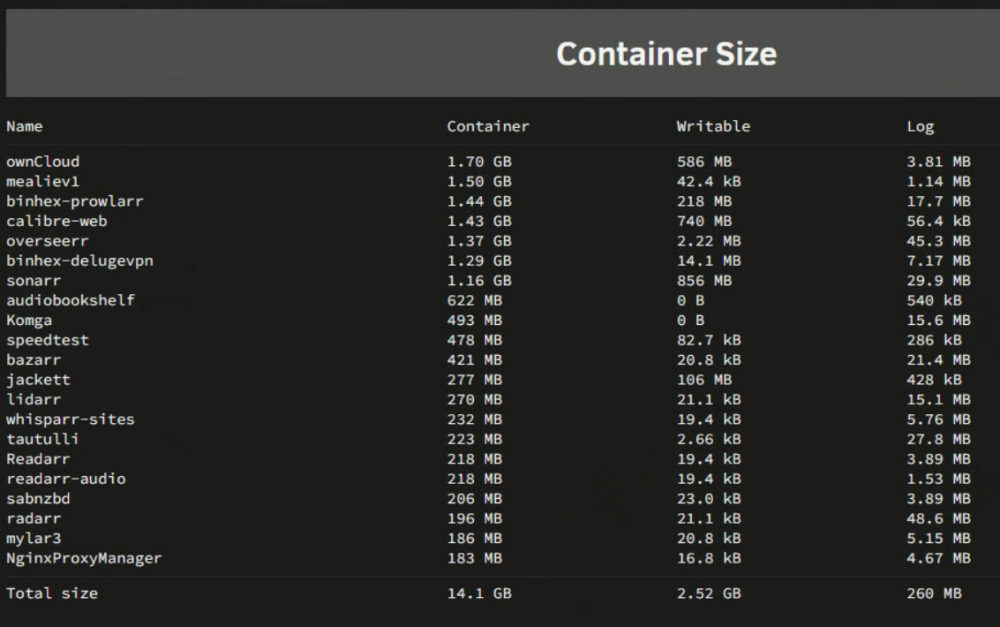
All that said, your screenshot doesn't have anything that jumps out at me as bad, you just have some hefty containers.
That is all a ton of useful information, I greatly appreciate it!
Thanks for the sanity check. I'm pretty sure the internal paths are all ok, so I think You're right on them just being hefty.
-
Here's an image of my Docker Container Size. With how many dockers I have, is this a reasonable size? I keep bumping up against the "warning" amount of 95% at 20GB total then "normal" levels.
I just want to ensure nothing is getting out of hand before I increase the capacity.
Thanks!
-
1 hour ago, strike said:
Have you tried just rebooting? Do you by any chance have wireguard on unraid enabled and/or a VM running?
I had not, but just did and it came up. Weird, but I'll take it.
Not that I know of.
-
40 minutes ago, strike said:
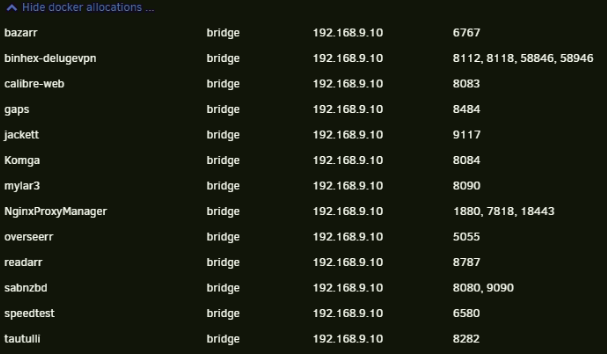
This usually happens when you run another docker container with the same port assignments. Check you docker tab to ensure that no other container is using the same ports. Or maybe the easier way is to click edit on the container, scroll down and click "show docker allocations". If there are multiple containers running on the same port they will be marked in red IIRC. If there are any containers using the same port, change ports on one of them.
I'm not seeing any duplicated ports. And it was fine before my UPS died and shutdown the unRAID hardware. Hasn't come up since power loss.
Attached are my diags as well.
-
My unRAID docker all of a sudden won't start. Just gives `Execution Error: Server Error` message. No logs in log window, and deleting the logs shown here never recreates those logs for some reason.
I've tried changing the PIA OPVN file to Switzerland (from Spain), and also changing the DNS I saw in this thread. I changed it to "1.1.1.1,1.0.0.1,8.8.8.8,192.168.9.1" (cloudflare, cloudfare backup, google (just to test), and home router IPs).
Not sure how to continue troubleshooting, especially if the logs aren't being generated. I wish that error was more specific though.
-
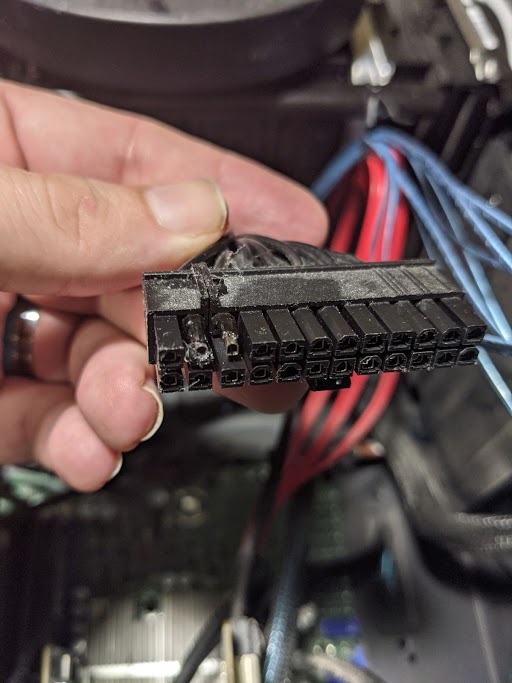
I figured out what is the cause of the server shutting off: https://imgur.com/a/RGSmkJz. Burnt 24 pin connector. Not sure if it's the power supply or the motherboard's fault. But time for some replacement parts. At least motherboard and power supply it seems.
Wonder if I should replace it with some newer hardware, and if so, which...

-
1 hour ago, Squid said:
You need to create a boot stick with the updated one (google search. Licensing prevents LT from including it in the OS)
Is that the one from PassMark or the open source one? Or does it matter?
-
1 minute ago, Squid said:
Your biggest problem is that the docker.img is stored on the array.
During a parity check, coupled with a data transfer to the array, and performance is definitely going to drop precipitously.
Move the image to the cache pool
The performance issues happen without a party check occuring, but I'm guessing to much other stuff is occuring to.
But I agree. I need to move the system share to ssd. That is the Prefer Cache setting, correct?
I also now plan on getting a few extra SSDs and building a docker/vm cache separate from the data ingestion cache.
Thanks everyone
-
1 minute ago, ChatNoir said:
Are you using a single CPU ?
No, dual xeons.
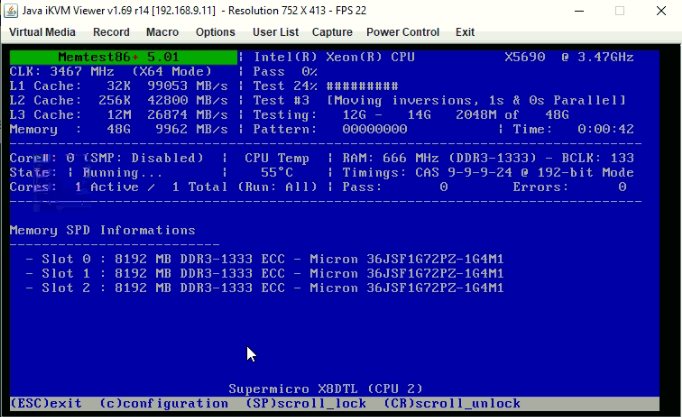
Interestingly, it does at least show the full capacity there: 48gb
-
Ok, couldn't sleep, so I stopped the memtest and got the syslog and timestamps.
Pings showing it went down and when:
 5:27:14.78 Reply from 192.168.9.10: bytes=32 time<1ms TTL=64
 5:27:15.81 Reply from 192.168.9.10: bytes=32 time<1ms TTL=64
 5:27:16.82 Reply from 192.168.9.10: bytes=32 time<1ms TTL=64
 5:27:17.85 Reply from 192.168.9.10: bytes=32 time<1ms TTL=64
 5:27:22.80 Request timed out.
 5:27:32.80 Request timed out.
 ... (truncated)
 5:29:43.29 Request timed out.
 5:29:45.32 Request timed out.
 5:29:47.35 Reply from 192.168.9.10: bytes=32 time<1ms TTL=64
 5:29:49.38 Reply from 192.168.9.10: bytes=32 time=2ms TTL=64
 5:29:51.41 Reply from 192.168.9.10: bytes=32 time<1ms TTL=64
 5:29:53.44 Reply from 192.168.9.10: bytes=32 time<1ms TTL=64
 5:29:55.47 Reply from 192.168.9.10: bytes=32 time<1ms TTL=64
Attached is the syslog. At the time of crash, all I was doing was navigating from the Dashboard to the Main tab. No docker or VMs were started, and no parity check.
Apr 28 05:22:33 Hathor rsyslogd: [origin software="rsyslogd" swVersion="8.2002.0" x-pid="14293" x-info="https://www.rsyslog.com"] start
Apr 28 05:25:37 Hathor ntpd[2090]: kernel reports TIME_ERROR: 0x41: Clock Unsynchronized
Apr 28 05:30:23 Hathor root: Delaying execution of fix common problems scan for 10 minutes
Apr 28 05:30:23 Hathor unassigned.devices: Mounting 'Auto Mount' Devices...
Apr 28 05:30:23 Hathor emhttpd: Starting services...
Apr 28 05:30:23 Hathor emhttpd: shcmd (81): /etc/rc.d/rc.samba restart
It shows no logs immediately prior to that crash.
Here are my syslog settings
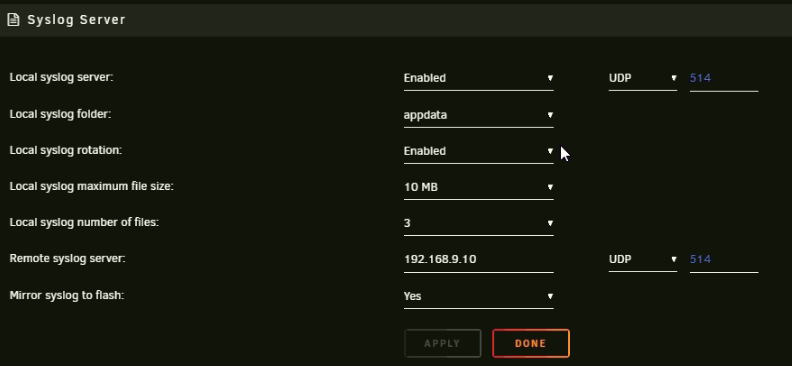
As I was gathering this information, it crashed again despite not using the system. I'm restarting the memtest. but for some reason it only shows 3 slots?
-
Oooh, I understand now. My understanding was the diagnostics grabbed the syslogs created by that setting. I get that it's a different file now. I'll post it in the morning (3am now). I'm also running a memtest now.
Thank you for your patience
-
I mean the whole server stops and restarts all on its own. A non-graceful shutdown. Then it comes back up, starts a parity check, and I download the diags.
Almost like a blue screen in Windows, but I don't see anything like that screen here.
-
So it's primarily the speed of the mechanical array not being able to keep up with the data requirements and I could help this out by having a large SSD/NVME cache pool and moving my dockers/VMs to a separate SSD/NVME cache pool?
-
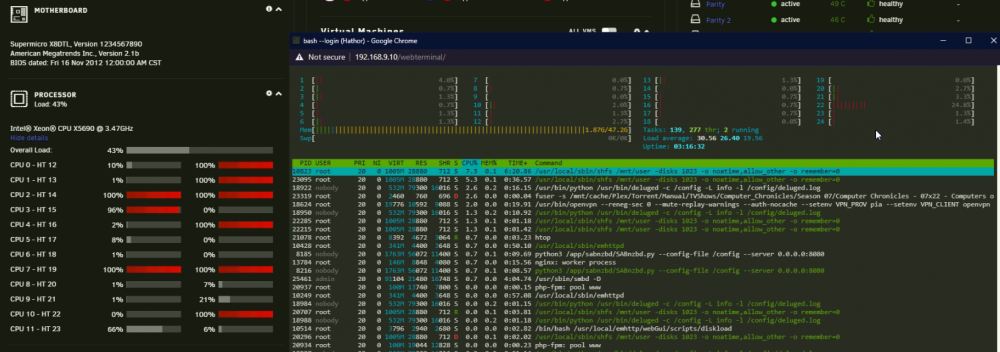
Anyway I can "fix" this? Is it just my processors aren't fast enough? Something else? How can I find out what resource is limiting it? I don't think I see the whole CPUs as pegged, just a number of threads. For example the picture above is only at 47% used. Is that really enough to cause this issue?
I really want to be able to have multiple copy and downloading jobs occuring at the same time to make full use of my system
-
1 minute ago, Vr2Io said:
Does those docker will access array ?
Yes, some dockers access the array. Deluge and sabNZBD job is primarily download to the array.
And sometimes I use the VMs to write or edit on the array as well.
-
I turned on two docker containers to help me test another issue: https://forums.unraid.net/topic/107528-docker-containers-become-slowunusable-during-large-data-movement/
Then everything was ok for a while there. Then I turned on a single VM (not the new-ish one, one I've had for a long time). And then pretty quickly got a crash. Specifically, I turned on the vm called Hraf. Though what's the liklihood that I'd choose the one VM with an issue? I'm guessing it's more so that I'm using any VM that's causing the crashing... I'll try other ones and see what happens.Edit: It crashed with just a file copy job going, nothing else running; no VMs, no Dockers. Though I think a parity check was going. I'm going to restart in Safe Mode and see what happens.
-
Every so often, unRAID will have an automated process do a large data movement. Either a torrent is finishing up and moving to its final location, NZB is unpacking a large file, etc. Sometimes it'll be me copying data from another machine to unRAID. At least I think that's what's the 'cause' of what the issue is.
This issue is that all my docker containers (and maybe even VMs) will slow down to a crawl. To the point where they're effectively unusable. I've got monitoring from HetrixTools pinging the services and it shows me this happens several times a day. All of those yellow and red ! marks is this issue occurring.
I'll look at the CPU usage and it'll show several of the threads being pegged at 100%. When I look at htop to see what it is, usually it's a VM as the highest process. However, for this test I had all my VMs turned off and only my Binhex-Deluge and NginxProxyManager docker containers running to verify the issue was still occurring with a 'light' workload.
For example:
Here's a test I did to hopefully gather more info.
Instead of everything running, I only had Binhex-Deluge and NginxProxyManager docker containers running. And I was copying over some video files to a user share from my other desktop PC: Which was running anywhere between just 5MB/s and 60MB/s, which I feel is crazy slow? And there happened to be a parity check running (because unRAID keeps crashing, probably unrelated, this was happening prior to the crashing), but that doesn't seem to matter usually.
Deluge kept losing connection to the webserver over and over again. Refreshing the page to reconnect took forever.
What I don't know here is that:
- why doesn't HTOP match the Dashboard? Which one is correct?
-
why does everything come to a crawl? The unRAID interface itself seems fine, just the stuff hosted on it.
-
Is it just NginxProxyManager docker container not being able to handle the traffic to the internal services?
- I don't think so, because the unavailability even occurs when using local IPs
- Is the CPU actually being pegged hard enough to not allow web traffic to the internal services?
-
Is it just NginxProxyManager docker container not being able to handle the traffic to the internal services?
-
is it something completely unrelated and this the CPU stuff is a red-herring? Like, is it something to do with the NIC or something? Some other setting?
- I do have my two NICs link aggregated with 802.3ad, but I didn't have this problem when I first set that up
- why is it happening with almost everything turned off?
- is there some hardware issue? I don't think I'm too low specced for what I'm trying to do, but maybe?
Honestly, I'm just at a loss of why everything slows down so much when I'm using what I feel is basic file copies. Diagnostics ran during the issue attached.
Thank you for reading. Please let me know if you need anymore information.
hathor-diagnostics-20210427-1809.zip
Solution: Moving the Docker containers and the VMs onto their own SSD cache pools away from the data ingestion cache pool. I haven't technically attempted this as I had a hardware failure, but I feel it's the right answer.
-
I turned off all my Docker containers and my VMs, and it hasn't crashed in a while now. I'm going to slowly turn on one at a time and see what thing is doing it. I have a feeling it's my new-ish W7 VM, which I hope not.
-
But I did have a crash before I grabbed the diags. I've had a few now since then, here's another diag file taking just after another crash and right after it came back up and started another parity check.
-
Here are new logs after turning on Mirror syslog to flash, after next crash.
-
Honestly, I have no idea what's going on. But recently, I'm having unRAID crashes. I was on 6.9.1 with some crashes, then updated to 6.9.2. Attached are my diags after such a crash. Happened in 6.9.1 and now 6.9.2 as well. And from what I barely understand, I don't have any dockers with custom IPs so not a macvlan issue. Please correct me if I'm wrong on these assumptions.
Unfortunately I really only find out after the crash when I get a notification that a parity check has started. As a result, I'm not really sure of what's going on.
I'm also not physically near my hardware, it's at my brother's house (has better internet). But can IPMI into the box.
And of course, I'm not quite knowledgeable about all this stuff, so please let me know if you need more information or anything.
Much appreciated!
-
I had this issue before. Here's the link, and diags are attached.
Disk 5 is disabled, and says it's emulated. Again.
Last time, I unplugged and replugged power and data cables. The cable is a SAS to 4 SATA cable. After doing so, the array rebuilt just fine and all was good for a couple months, but now I'm back.
Is it time for a new drive? If not, what should I do?


Parity Rebuild extremely slow after replacing data drive? (~5Mb/s)
in General Support
Posted
I'm doing that now, I actually paused the rebuild and the Mover started moving, so I'm going to let that finish before continuing.
I'll check it out, thanks!