


HFChimp
Members
-
Joined
-
Last visited
-
Thanks JorgeB. I am doing that.
-
I am running 6.12.4 and have been running UNRAID for some time without issues. I recently upgraded a drive from 4TB to 16TB and at the same time, moved several of the existing drives around for better cooling and organization. I brought the system back up and everything looked correct, and unassigned the 4TB drive from array and added the 16TB in its place. I started the data rebuild and the system has hung multiple times since then and never successfully finished the rebuild. It has gotten anywhere from 25 to 95% through the rebuild before hanging. I have taken server apart again and rechecked all cables and cards to ensure they are connected properly and didn't see any issues. The last time that I restarted the system, I also turned on logging to flash. The syslog attached is copied from the flash from the last attempt to complete the rebuild. I attempted to do a clean shutdown by tapping the power switch when I was unable to connect to the Web UI but am unsure of what time I did that. I do know that it wasn't just the webui that was failing as my dockers were also not functioning. Any help is much appreciated. kmce-diagnostics-20250403-1558.zip syslog
-
I restarted my server and the problem went away.
-
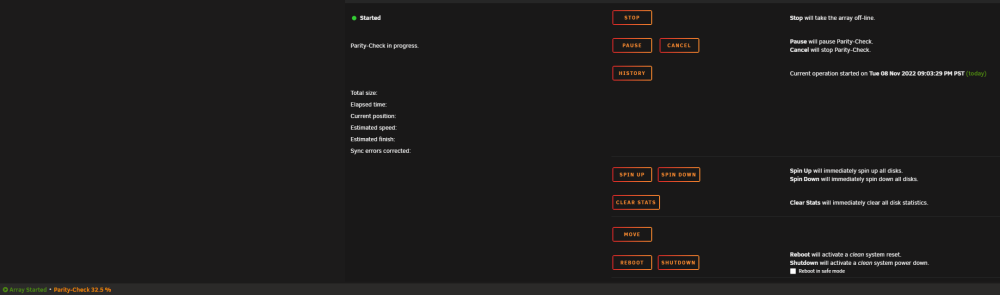
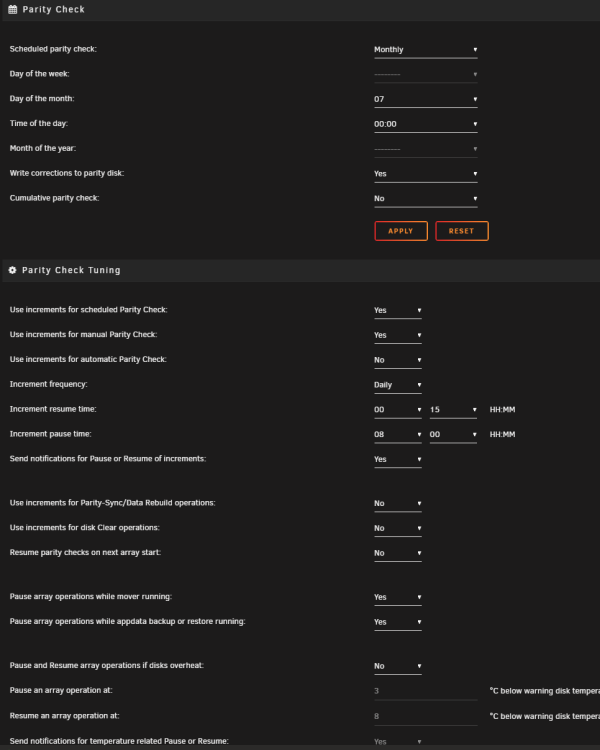
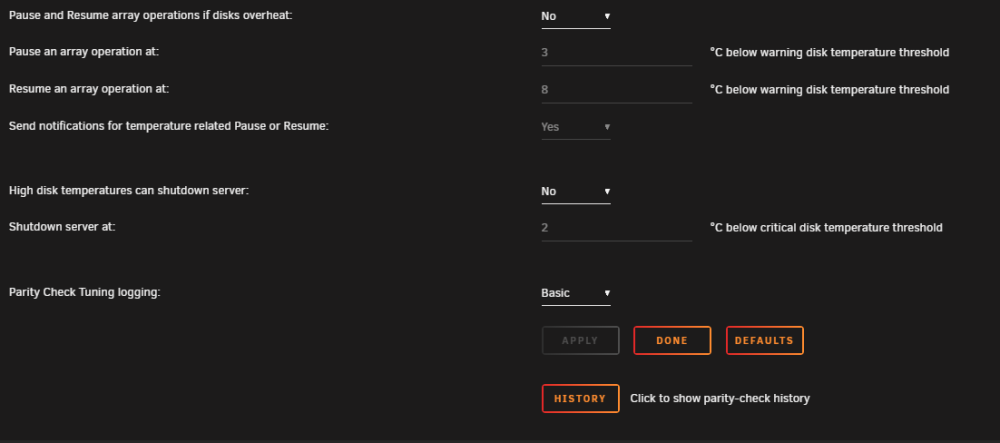
Hello all, I run parity checks monthly starting on the 7th of each month. For the last 2 months, when parity is running, it doesn't update the Total size:, elapsed time etc fields on the Main screen of unraid WebUI. I can see that the parity check is progressing by seeing the % in the bottom left of the screen. I am running 6.10.3 Pro and have included screenshot of my parity config. I don't believe that I changed any options when it stopped working correctly but can't be positive. Any help/pointers appreciated. kmce-diagnostics-20221108-2128.zip
-
Thanks @JorgeB. I tried moving the power connector and sata cable and the problem is still there. RMAing the drive.
-
Shortly after my monthly parity check started yesterday, my parity disk generated 2048 errors and the parity was marked bad. I stopped array, removed parity drive and restarted. Can anyone tell from the logs if the drive is toast? kmce-diagnostics-20220607-1549.zip
-
Thanks @JorgeB, I will look into that once my parity drive finishes rebuilding...
-
HFChimp changed their profile photo
-
I am a relatively new user of Unraid and am very rusty with my linux skills as well. A few days ago, when I was running the very first parity check after starting up the server, as it was getting towards the 7 or 8 TB mark of 16TB, the system started hanging and being quite unresponsive. I saw several of the 12 vprocs at 100%. 2 of the 3 data drives that were still being read started spamming read errors and the parity check failed. I lost all access to machine and had to shut it down. Unfortunately, I did not capture any logs from that adventure. I brought it back up and parity was marked failed so I started a read check on the 6 data drives. Shortly after it got past the 8TB mark (max size of the data disks), the throughput started climbing close to 1GB/s (on main dashboard showing progress of read check. Then the system started behaving similarly to the parity check and was very unresponsive - unable to connect to ssh or any webui ports. As it said it had about 3 hrs to go at that point, I thought I would just wait it out in case it was actually completing the process. I checked back in on the system in about 2 hrs and I was able to get in and the read check had continued. I didn't check the state of any of the docker containers nor mess with them in any way. The read check finished successfully at that point and I started looking at the logs and saw this: Jan 2 15:46:28 kmce kernel: CPU: 4 PID: 11018 Comm: unraidd0 Not tainted 5.10.28-Unraid #1 Jan 2 15:46:28 kmce kernel: Hardware name: Gigabyte Technology Co., Ltd. Default string/X99-UD3-CF, BIOS F23c 06/15/2018 Jan 2 15:46:28 kmce kernel: Call Trace: Jan 2 15:46:28 kmce kernel: <IRQ> Jan 2 15:46:28 kmce kernel: dump_stack+0x6b/0x83 Jan 2 15:46:28 kmce kernel: ? lapic_can_unplug_cpu+0x8e/0x8e Jan 2 15:46:28 kmce kernel: nmi_cpu_backtrace+0x7d/0x8f Jan 2 15:46:28 kmce kernel: nmi_trigger_cpumask_backtrace+0x56/0xd3 Jan 2 15:46:28 kmce kernel: rcu_dump_cpu_stacks+0x9f/0xc6 Jan 2 15:46:28 kmce kernel: rcu_sched_clock_irq+0x1ec/0x543 Jan 2 15:46:28 kmce kernel: ? trigger_load_balance+0x5a/0x1ca Jan 2 15:46:28 kmce kernel: update_process_times+0x50/0x6e Jan 2 15:46:28 kmce kernel: tick_sched_timer+0x36/0x64 Jan 2 15:46:28 kmce kernel: __hrtimer_run_queues+0xb7/0x10b Jan 2 15:46:28 kmce kernel: ? tick_sched_do_timer+0x39/0x39 Jan 2 15:46:28 kmce kernel: hrtimer_interrupt+0x8d/0x15b Jan 2 15:46:28 kmce kernel: __sysvec_apic_timer_interrupt+0x5d/0x68 Jan 2 15:46:28 kmce kernel: asm_call_irq_on_stack+0x12/0x20 Jan 2 15:46:28 kmce kernel: </IRQ> Jan 2 15:46:28 kmce kernel: sysvec_apic_timer_interrupt+0x71/0x95 Jan 2 15:46:28 kmce kernel: asm_sysvec_apic_timer_interrupt+0x12/0x20 Jan 2 15:46:28 kmce kernel: RIP: 0010:schedule_read+0x7b/0x87 [md_mod] Jan 2 15:46:28 kmce kernel: Code: 00 b8 11 ff ff 01 b9 00 04 00 00 48 c1 e2 29 48 03 95 a8 00 00 00 48 c1 e0 27 48 c1 fa 06 48 c1 e2 0c 48 01 c2 31 c0 48 89 d7 <f3> ab 48 81 4d 00 00 01 00 00 5d c3 8b 87 70 05 00 00 85 c0 75 02 Jan 2 15:46:28 kmce kernel: RSP: 0018:ffffc900007afdb0 EFLAGS: 00010246 Jan 2 15:46:28 kmce kernel: RAX: 0000000000000000 RBX: ffff8881014a5768 RCX: 00000000000001f0 Jan 2 15:46:28 kmce kernel: RDX: ffff888139270000 RSI: 0000000000000003 RDI: ffff888139270840 Jan 2 15:46:28 kmce kernel: RBP: ffff8881014a5aa0 R08: 0000000000000000 R09: 0000000000000001 Jan 2 15:46:28 kmce kernel: R10: ffff8881014a5e10 R11: ffff88880fee2400 R12: ffff8881014a5758 Jan 2 15:46:28 kmce kernel: R13: 0000000000000000 R14: 0000000000000003 R15: 0000000000000003 Jan 2 15:46:28 kmce kernel: unraidd+0xe14/0x12b7 [md_mod] Jan 2 15:46:28 kmce kernel: ? md_thread+0xee/0x115 [md_mod] Jan 2 15:46:28 kmce kernel: ? rmw5_write_data+0x178/0x178 [md_mod] Jan 2 15:46:28 kmce kernel: md_thread+0xee/0x115 [md_mod] Jan 2 15:46:28 kmce kernel: ? init_wait_entry+0x24/0x24 Jan 2 15:46:28 kmce kernel: ? md_seq_show+0x69e/0x69e [md_mod] Jan 2 15:46:28 kmce kernel: kthread+0xe5/0xea Jan 2 15:46:28 kmce kernel: ? __kthread_bind_mask+0x57/0x57 Jan 2 15:46:28 kmce kernel: ret_from_fork+0x22/0x30 Jan 2 15:47:53 kmce kernel: vethc208cd9: renamed from eth0 Similar things happen many times in the syslog but not with the same CPU or call trace. At this point, I am rebuilding parity drive but I fear that this is going to happen again the next time the system is under load. I was unable to run diagnostics at the time as it just hung so I have attached a diagnostics from just now, but the additional syslog.txt attached is from when the problem occurred. Any pointers or help appreciated! kmce-diagnostics-20220103-1011.zip syslog.txt


