


OddMagnet
Members
-
Joined
-
Last visited
-
If anyone is still seeing this, it seems a BIOS update finally solved this for me. At least I haven't had any unplanned reboots anymore. Almost 2 Months uptime now
-
I guess I could, but it certainly annoys me every time it happens, I always panic a bit about there being a bigger problem. CPU Stress test didn't show anything out of the ordinary either (in fact I'm surprised my CPU doesn't go above 48°C even after 3+ hours of max load). Gonna leave the thread open for now, maybe the next time it happens I have more clues edits: 29.05.25: Happened again, no clues in the syslog 29.05.25: Wow, twice in one day... 06.06.25: Seems to happen more now than every couple of months... 11.06.25: ... 25.06.25: ... 06.08.25: just when I thought it was just running... 21.08.25, 14.09.25 20.11.25: Was about to post that I might've solved the problem and it happened again, lmao 21.11.25: and again...
-
Sure, but what is the likelihood that RAM is gonna be the issue then? Running my server for 3+ months with half RAM isn't really an option either.
-
Memtest86+ has ran for 10 passes, almost a day. I think it's safe to say the problem isn't the RAM. Gonna start a CPU stress test for a couple of hours now. The only thing that changed when moving from my old server case to the new one (aside from the case, :D ) was the Mainboard. Not sure if it's even possible to test that though
-
Initially I tried running the Live Memory Test plugin, after one pass without errors I decided to reboot into Memtest86+ after all. After stopping the plugin and attaching monitor and keyboard to my server it had rebooted again, tried disconnecting and replugging them a few times to check if that was a fluke, no further reboots from that. (Also tried un- and replugging my Monitor from the UPS, nothing here either) I'd assume that neither my UPS or the connections from the Monitor/Keyboard caused the reboot, weird though that it happened in just that moment. Or maybe it's bad RAM and happened from stopping the Live Memory Test plugin? Either way, gonna report back when Memtest has run long enough
-
Would a MemTest be good enough to rule out bad RAM? Since the reboots are quite far apart I'd like to avoid running my server with half RAM for that long
-
Ah, sorry, forgot to attach the one from the syslog server, here it is: I've gone ahead and removed entries from before today, let me know if you need to see more. Though I don't think it really shows much, these two entries specifically are the last before the reboot and after (when the syslog server is started again) May 25 10:47:38 OddNas emhttpd: read SMART /dev/sdb May 25 11:24:32 OddNas rc.rsyslogd: Syslog server daemon... Started. syslog-192.168.178.200.log
-
As the title says, every couple of months I have a random reboot, afterwards my server runs perfectly fine. After setting up syslog (and waiting some months for another reboot I noticed my USB was having errors. I replaced my USB and though that would be the end of it, but a couple weeks later I just had another random reboot. The reboot happened around ~11:00-11:15 am. I've had a look at the log files, but couldn't really find anything suspicious, hopefully someone here with more knowledge can find the culprit. One thing I noticed was that when it was starting it was installing stuff/plugins, not sure if Unraid does that on every start. oddnas-diagnostics-20250525-1123.zip
-
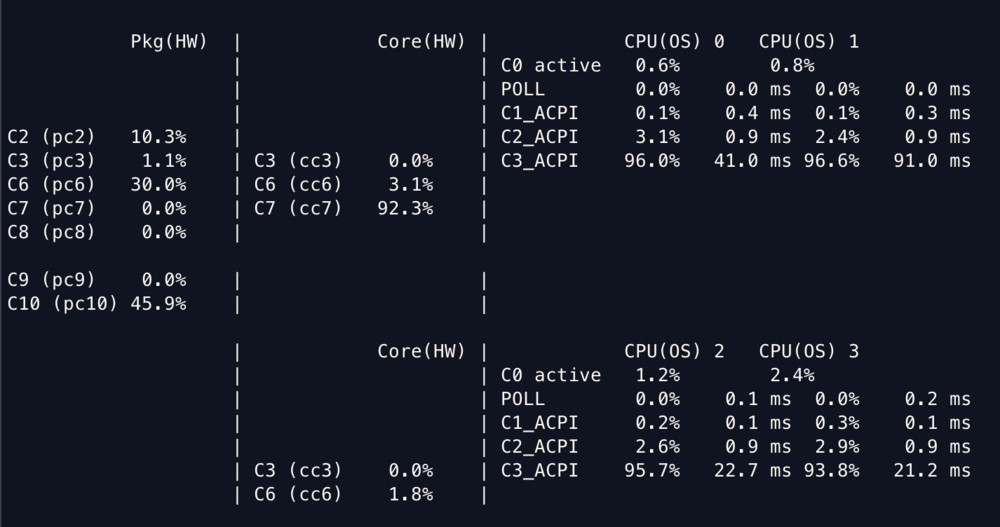
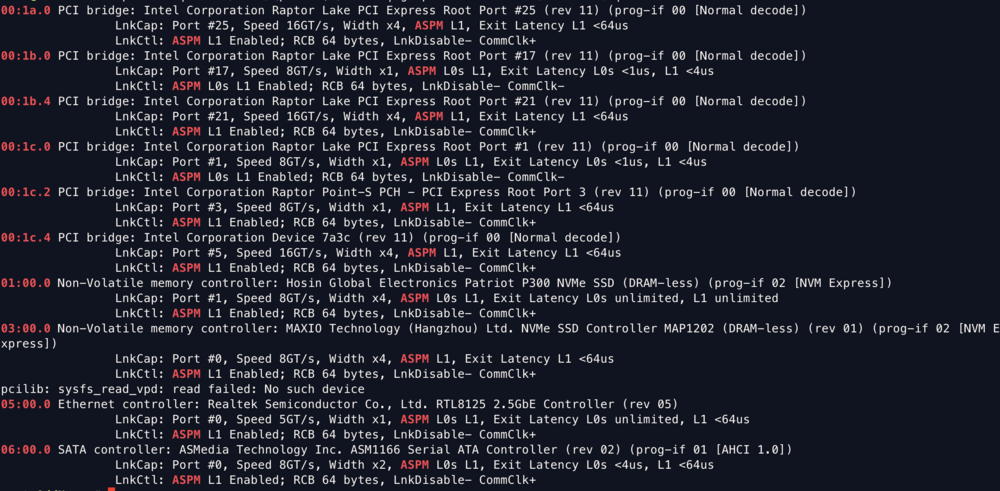
So, hab's mal mit nem Win11 Live USB probiert... es ist die HÖLLE. Das flashen selber war sehr einfach, aber es hat ewig gedauert. Der erste Start von Windows dauert ewig, wenn man das Netzkabel nicht entfernt versucht es auch direkt Updates zu machen und selbst danach muss man für alles ewig warten. Ich dachte mit einem USB3.1 Stick in dem passenden Port sollte es ja wohl gehen, aber scheinbar nicht ¯\_(ツ)_/¯ Falls das doch noch jemand so machen möchte: Netzkabel ab, Flashtool+FW auf nem zweiten USB damit man kein Internet braucht und auf keinen Fall eine Maus/Tastatur benutzen die direkt irgendwelche Software installieren will... Zum Flashen selber: Die Firmware auf meiner Karte war, wie von @_alo_ schon vermutet die 221118-0048-00 Flashen selber dauerte keine 2s. Nach einem Neustart (und wieder Updates, danke Windows... 💢) hat das Tool dann auch gezeigt dass ich die korrekte Version (221118-0000-00) drauf hatte Das Problem scheint damit auch gelöst zu sein, keine weiteren PCIe Bus Errors in meinen Logs C-States scheinen sogar nochmal ein wenig besser zu sein (52% C10, 27% C6), kann aber auch nur eine Momentaufnahme sein. Selbst mit meinen 50 Docker Containern und wirklich sehr aktiven qBittorrent zieht mein Server jetzt unter 100W Vielen Dank nochmal an alle die hier ihre Zeit opfern um zu helfen und @Timmey85, ich drück dir die Daumen dass es auch so easy klappt und den Fehler auch für dich behebt
-
Ne, habe leider nur Unraid und mein Macbook Windows vom USB booten geht? Dann probier ich das ma
-
@_alo_ vielen Dank für die Info und den Link zum Post. Bisher konnte ich nur Anleitungen zum FW update mit Windows PCs finden, gibt es da wirklich keine andere Möglichkeit? Würde mir nur ungern eine extra SSD/Platte kaufen nur um mein Unraid-Server temporär mit Windows booten zu können
-
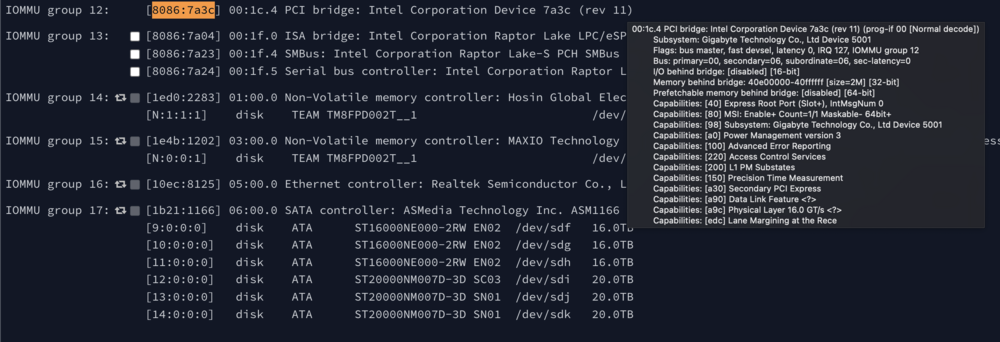
Hab mal unter "System Devices" geschaut, es sieht so aus, als wäre das der PCIe slot (zmd. meine Vermutung). Mit dem Rest der Daten kann ich nicht viel anfangen
-
Nicht dass ich mich freue dass du die auch bekommst, aber schön zu wissen dass ich nicht alleine bin mit dem Problem Habe einige Threads per Google gefunden (hier, weiter unten und hier), laut denen es evtl. am L1 ASPM state liegt, weiß aber nicht ob man den im BIOS auf nur L0 für den Controller setzen kann
-
So, kam nun endlich dazu mal den Controller auszutauschen, sieht eigentlich ganz gut aus (siehe Bilder) Aber: Nun bekomme ich haufenweise Fehler von einem device, wie finde ich heraus welches Device das ist? Oder kann es sein, dass die Meldung wegen dem Parity-Rebuild ist?
-
Aktuell noch nicht, wird auch noch ein wenig dauern, aber gebe dann hier ein Update sobald ich die Zeit und Nähe dafür gefunden habe


