


NebN
Members
-
Joined
-
Last visited
-
Temperature is now available. Disks and CPU. CPU temperature file might have to be specified in the configuration, you can read more about it on the readme.
-
Temperature is tricky, but I'll see what's possible without having any software dependencies.
-
Copying my response from GitHub so it's visible to anyone else who might encounter this problem: This is very interesting, I just completely uninstalled and reinstalled the app, while also removing the conf folder, and it does in fact create a folder named conf.yml upon first starting the app, which is certainly confusing. This is not something I had noticed in my testing so far. I'll see what I can do to avoid this in future installations. Thanks for bringing this to my attention!
-
While this works, it should not be necessary, you can mount files directly in Docker, which is what the default configuration does. My configuration, which is the default, has: - container path: /app/conf.yml - host path: /mnt/user/appdata/unraid-simple-monitoring-api/conf.yml Just make sure you restart the app once you have made sure that the file you specify in the mount binding exists. The error "read /app/conf.yml: is a directory" is due to how Docker handles misconfigured mount points, if the host file/directory specified to be mounted at "/app/conf.yml" does not exist, Docker will create an empty directory in its place, and you will get this error, which I admit is not very helpful.
-
Excellent. I have just updated the official version, you can just disable/remove the QA one and update the main app. Thanks for your help with figuring this out!
-
I was just looking into this, it seems to me like there might be a division by zero when computing the time between CPU snapshots. I have just now pushed a new QA version, you can just update it like normal from the Docker Tab. See if it's fixed (although I'm curious as to why the time delta between CPU snapshots seems to be zero). EDIT: I was wrong in my initial analysis, if the problem is where I think it is, it is not due to a 0 time difference, but a 0 difference between actual CPU usage between the 2 snapshots, which is equally weird.
-
Yeah as I suspected the "bound0" was not really the cause of the issue. I have run this application with several missing disks/networks and it always behaved correctly. It would be of great help if you could install the QA build with additional logging as I described earlier in this post. If you don't feel comfortable doing this I can push an official build later with the improved logging, as this is something that will make it to the official version anyway.
-
I have figured out part of the problem, and added additional logs to figure out the rest. If you could it would be of great help if you could follow these instructions on how to setup a QA build. This build should: no longer have Homepage give this error "Parse error: SyntaxError: Unexpected token j in JSON at position 0". It might give a different one, just a bit more helpful. print additional logs in addition to "ERROR Error trying to respond to API call error="json: unsupported value: NaN"" in the unraid application, this is where we should be able to understand the issue better
-
Thanks for the information. Yes the usual name for a network interface is bond0, this is read directly from your unraid-simple-monitoring-api/conf.yml, so you probably have spelled it incorrectly. I do suspect that this is not the source of the issue you are decribing, but rather this Although unfortunately it is rather vague. I'd suggest you correct, or even remove if you are not interested in it, the "bound0" interface from conf.yml and see if that fixes the issue, though I have a feeling it won't.
-
That's very odd. To be able to figure this out we'll need some additional information, if you don't want to post it here feel free to message me privately. I'm guessing the log you posted is from Homepage. You can start by checking the application's logs, if there are any errors we might already get an answer. You can find these by going to the Docker Tab on Unraid, click on unraid-simple-monitoring-api and select "logs". If there are no errors, then I'll ideally need: - homepage services configuration, to see what response fields you are trying to read - unraid-simple-monitoring-api configuration, to see the data that is supposed to be sent - response from http://your-unraid-api:24940 to see how the data is actually being sent You said this error is random, so it might be difficult to figure out, but this should start to give me an idea of where the problem might be. EDIT: I see you are trying to read the data from a specific disk, as mention in an above answer, the software initially sent the disk data in a random order, this has now been corrected, so if you haven't already, please update to the latest version (this version sends the data in the order specified in your conf.yml)
-
Yes an API response is usually not meant to be read directly by a person, so it is not formatted, it's just a single line with no spaces to make the message as small as possible. It can still be useful to read it directly, like in this case, so you know exactly what data you have available to read with Homepage. If you want to make it easier to read (like on the GitHub readme) you can google "json formatter". For example you saw the new "CPU" field "cpu":{"load_percent":6.54} and looking at this JSON you know that your Homepage services.yaml should look like this to display CPU load: - field: cpu: load_percent # name_of_the_main_object: name_of_the_field label: CPU # or whatever you prefer format: percent
-
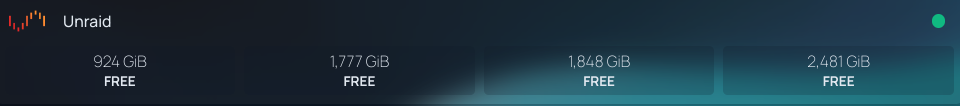
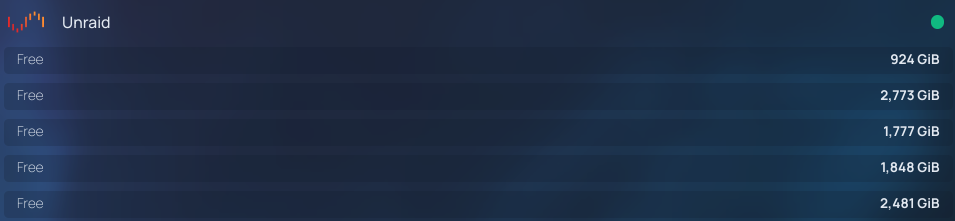
I understand. The API currently sends both "total" and separate disk / network data. You need to change your homepage configuration in order to see the information displayed separately. While trying it out myself I found out that currently the disks / network data is being sent in an unpredictable order, so for now the solution I will show you might change the order of the results when the API gets called each time. I have opened an issue to fix this (https://github.com/NebN/unraid-simple-monitoring-api/issues/3). This is what you have to do in services.yaml: If you wish to have "horizontal" data (max 4), you need to grab the data in the "cache" field, this example and screenshot is using the "array" field, as I do not have more than one cache mount to test this with, just change "array" to "cache". You can change the "label" to whatever you prefer, but unfortunately since the order of the disks in the response is random at the moment it does not make much sense to name them something like "disk0", "disk1". # This will create 4 horizontal groups from the first 4 disks in the array - Unraid: icon: unraid.png href: http://your-unraid-ip widget: type: customapi url: http://your-unraid-ip:24940 method: GET mappings: - field: array: # change this to "cache" if you want cache data 0: free # first item in the response, reading field "free" label: Free format: number suffix: "GiB" - field: array: # change this to "cache" if you want cache data 1: free # second item in the response, reading field "free" label: Free format: number suffix: "GiB" - field: array: # change this to "cache" if you want cache data (and have 3 cache mounts) 2: free # third item in the response, reading field "free" label: Free format: number suffix: "GiB" - field: array: # change this to "cache" if you want cache data (and have 4 cache mounts) 3: free # fourth item in the response, reading field "free" label: Free format: number suffix: "GiB" Alternatively, you can add as many items as you want (I think) if you activate "display: list". Like this # This will create a list view of the first 5 disks in the array - Unraid: icon: unraid.png href: http://<your-unraid-ip> widget: type: customapi url: http://<your-unraid-ip>:24940 method: GET display: list # <-- this is the line to add to enable list view and see more than 4 items mappings: - field: array: # or cache 0: free label: Free format: number suffix: "GiB" - field: array: # or cache 1: free label: Free format: number suffix: "GiB" - field: array: # or cache 2: free label: Free format: number suffix: "GiB" - field: array: # or cache 3: free label: Free format: number suffix: "GiB" - field: array: # or cache 4: free label: Free format: number suffix: "GiB" You can read more about this on the official Homepage documentation on Custom API Widget https://gethomepage.dev/latest/widgets/services/customapi/#example P.S.: You can open up your browser to http://your-unraid-api:24940/ to see what data is being sent, so you see what you have available to read from Homepage. You can also see an example example json response here on the readme.
-
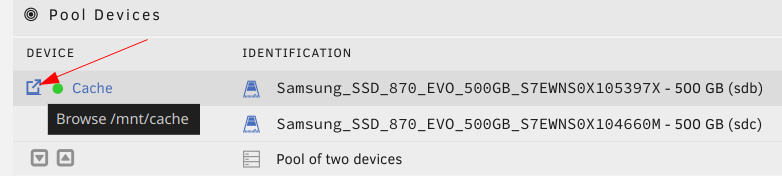
Could you provide me with more information about the issue you are encountering? Have you added all your cache pool mount points to your configuration? Like this: disks: cache: - /mnt/cache - /mnt/your/second/cache - /mnt/your/third/cache To figure out where your caches are mounted you can mouseover this icon in your Unraid "Main" tab. You can also check the Application's logs for any errors. You can do this by browsing to Docker > Click on the application's icon > Logs
-
- reserved -
-
A simple REST API to receive basic metrics about your Unraid installation such as Disk utilization and Network traffic. Originally created to be used with https://gethomepage.dev/ (Custom API Widget). Dockerhub [OLD]: https://hub.docker.com/r/nebn/unraid-simple-monitoring-api Github Container Registry [NEW]: https://github.com/NebN/unraid-simple-monitoring-api/pkgs/container/unraid-simple-monitoring-api Github: https://github.com/NebN/unraid-simple-monitoring-api *** UPDATE *** Migrated from DockerHub to GitHub Container Registry. If you have installed before April 2024 please reinstall or manually change Repository to ghcr.io/nebn/unraid-simple-monitoring-api:latest And optionally Registry URL to https://github.com/NebN/unraid-simple-monitoring-api/pkgs/container/unraid-simple-monitoring-api I will keep pushing to DockerHub for now, but would like to definitively migrate. *************** A configuration file needs to be placed at /mnt/user/appdata/unraid-simple-monitoring-api/conf.yml More information on the Github readme, but in short it needs to be like this: networks: - eth0 disks: cache: - /mnt/cache array: - /mnt/disk1 - /mnt/disk2


