


nothet
Members
-
Joined
-
Last visited
Everything posted by nothet
-
Oh! Ok that makes sense that it includes IO Wait. I have a bunch of spinning HDDs in a SAS DAS. I've got a mix of IO (Jellyfin read and file writes in). Should I probably look into an SSD cache drive? Thanks for the quick reply, I appreciate it.
-
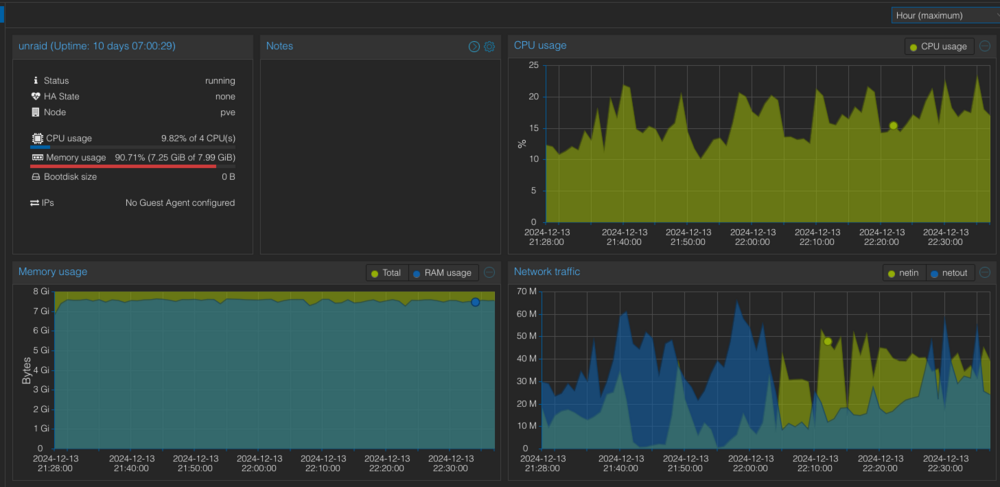
How is CPU usage in the web GUI calculated? I am getting wildly different CPU usage answers in the GUI, htop, and the proxmox host. See in the below screenshot. Does this mean anything? I am trying to figure out if I have an issue here. I have a share I think is being slow to respond, and causing smb operations to hang on clients or give really inconsistent performance. Could be a drives, they are new to this setup. If its a CPU problem I can allocate more CPUs, but I am not sure thats the issue. The CPU utilization doesn't make sense to me. It isn't always at 100%. Its constantly dancing around (often hitting 100%) but the GUI always reads way higher than any other method.
.thumb.png.c009f15e74f83c6abfb6f8a92dc6c446.png)
.png.d6211188fdbce87c95ccb28e1f7881c2.png)
