Zoomer88
Members
-
Joined
-
Last visited
-
I tried that but no dice. However after doing that (loading defaults, then enabling the service) I see a little bit more life in the logs. E.g. my arrays are being acknowledged. No activity being recorded though: {"level":"info","tag":"2026.03.20.0234","revision":"79e08a25a73a7e7603875d5b9d97b39713430880","git_dirty":"no","time":1774880692,"message":"Build information"} {"level":"info","time":1774880692,"message":"Starting file activity watcher..."} {"level":"info","Exclusions":["(?i)appdata","(?i)docker","(?i)system","(?i)syslogs"],"Enable":true,"UnassignedDevices":true,"Cache":true,"SSD":true,"DisplayEvents":1000,"MaxRecords":20000,"time":1774880692,"message":"File Activity Watcher Configuration"} {"level":"info","array_disks":0,"pool_disks":2,"time":1774880692,"message":"Disk count"} {"level":"warn","error":"open /var/state/unassigned.devices/unassigned.devices.json: no such file or directory","time":1774880692,"message":"Error reading unassigned devices file"} {"level":"info","disk":"hdd","mountpoint":"/mnt/hdd","type":"cache","filesystem":"zfs","rotational":true,"time":1774880692,"message":"Watching disk"} {"level":"info","disk":"nvme-ssd","mountpoint":"/mnt/nvme-ssd","type":"cache","filesystem":"zfs","rotational":false,"time":1774880692,"message":"Watching disk"} {"level":"info","count":2,"time":1774880692,"message":"Watch folders"} {"level":"info","time":1774880692,"message":"Watcher ready"} {"level":"info","time":1774880692,"message":"Starting event listener..."} {"level":"info","filter":"(?i)appdata","time":1774880692,"message":"Adding exclusion filter"} {"level":"info","filter":"(?i)docker","time":1774880692,"message":"Adding exclusion filter"} {"level":"info","filter":"(?i)system","time":1774880692,"message":"Adding exclusion filter"} {"level":"info","filter":"(?i)syslogs","time":1774880692,"message":"Adding exclusion filter"} {"level":"info","current_lines":0,"time":1774880692,"message":"Current activity records"} {"level":"info","path":"/mnt/hdd","fsid":"c36c687f6c3c6100","time":1774880692,"message":"Cached mount fsid"} {"level":"info","path":"/mnt/nvme-ssd","fsid":"552a0201ccd60f00","time":1774880692,"message":"Cached mount fsid"}
-
Hello! I'm trying to use the plugin for the same purpose as everyone here - to check why I have activity on my HDDs. Because I think I mostly shouldn't. I don't have any movers, caches or somesuch. I just have a ZFS pool of two disks in mirrored configuration, some nested datasets there, and one separate SSD drive. All the docker data lives on that ssd, but I'm still getting something on HDD. File Activity doesn't show anything at all. Here's the watcher log: {"level":"info","tag":"2026.03.20.0234","revision":"79e08a25a73a7e7603875d5b9d97b39713430880","git_dirty":"no","time":1774812086,"message":"Build information"} {"level":"info","time":1774812086,"message":"Starting file activity watcher..."} {"level":"info","Exclusions":[],"Enable":true,"UnassignedDevices":true,"Cache":true,"SSD":true,"DisplayEvents":1000,"MaxRecords":20000,"time":1774812086,"message":"File Activity Watcher Configuration"} {"level":"fatal","error":"open /var/local/emhttp/disks.ini: no such file or directory","time":1774812086,"message":"Error loading disks file"} And here's the other log: 2026/03/29 21:21:26 migrate-config.php: No config migration needed, old config file not found or new config already exists. 2026/03/29 21:21:26 rc.file.activity: Updating file activity configuration.Both "Share activity" and "Disk activity" tabs say there's nothing to show. Am I doing something wrong?
-
Sooo, eeer, it could've been simply 'Storage', no? :D I wasn't only ranting though, was I? I mean, I tried my best to give the useful input and mentioned what I'd expect to see there. I mean, that probably a side effect of either ZFS Master plugin or ZFS only pools in the system? Going to investigate. If that's the case, please, disregard. But either way, as I mentioned, I expect there to be current pool statuses and ongoing processes pertaining to them (pretty important, don't you think?). At least something along the lines of "POOL IS EFFING RESILVERING AFTER BEING DEGRADED STOP ALL THE PORN WATCHING OR I DON'T KNOW!!!exclamationmark. I'd also like to see names of the pools, as now I only see the device names, I think. edited: The page somehow has very little on pools, is what I'm saying. I also don't like the way I have to stop the array to get to the pool settings/slots/what-have-you. Why? So, in other words, you know, everything I've mentioned in the OP :) I just like to reiterate that I don't dislike the system. It's just this page is so weird, so out of place and out of touch with reality.
-
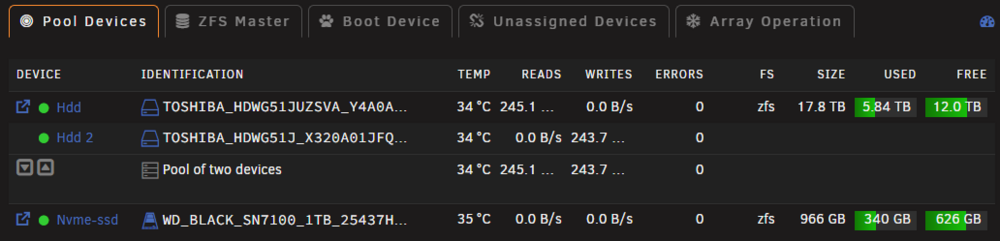
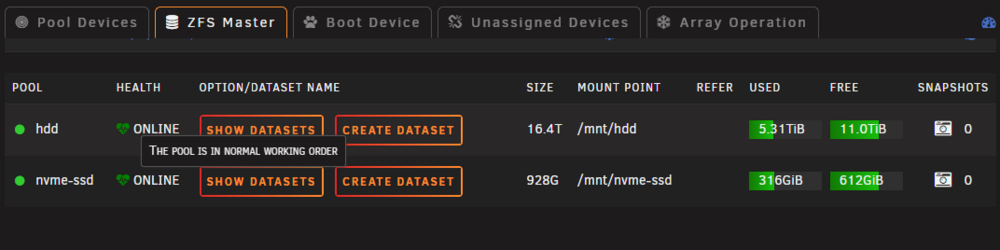
I do only have 2 ZFS pools. So you mean, that's because it's ZFS? Ah, I see then. I know, that ZFS is new for Unraid. That's actually why I'm here :) So I switched to a tabbed view, however I didn't get anything new. All the sections moved to separate tabs and that's all. I don't see pages for pools. However, now that I'm thinking about it, maybe that's related to the ZFS Master plugin? E.g., here's the tabbed view, pool devices tab. Pretty much the same: Notice, how there's no mention of pools at all, just the devices. Clicking on those links (Hdd/Hdd2) takes me to the device settings there. Again, no mention of pools. However, here's the ZFS Master tab. Is it replacing something vital from unmodified Unraid? Cause it's happily reporting that my pool is online and in working order (nice, lol): No additional links, no nothing. Yeah... that's probably that "ZFS Master" thing, right?
-
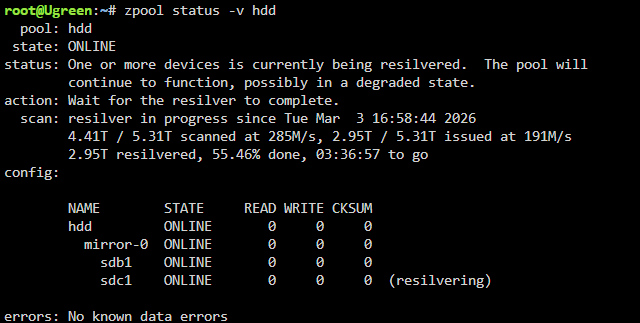
Hello! Pretty new to Unraid, yet I love it so much already. Everything's at your fingertips and no unnecessary abstractions. However, the "Main" tab is so weird. Just wanted to leave some feedback on it and rant a little. I don't get it, what exactly it tries to be? Why is it main? Main out of what? I can't even wrap my head around its intent. Why is it so different depending on the state of the array. Even for basic troubleshooting (i.e. which options does it contain) it becomes very problematic. Unintuitive operations, poor layout. Why do we have graphs both for "free" and "used"? Isn't one enough? Why can't we make changes and ask it to apply stopping the array in the process for example? Why would we need to bring everything down before planning the next move? No real feedback about the state of the devices. What's exactly happening to this or that pool? Why don't we have a link to a page with the status of the pool, current processes, etc.? You know it's bad, when the terminal output is more human-readable than your GUI - check out the screenshots. Can you guess what's currently happening looking at that page? Yet we do have that very useful line with "Pool of two devices", random stats and the most important, all encompassing and ever needed unlabeled spin up/spin down buttons, haha IMO, this poor thing is up for renovation!

-
Alright, thanks for the heads up! Will keep them for the time being. I love the granularity they give me with automated snapshots.
-
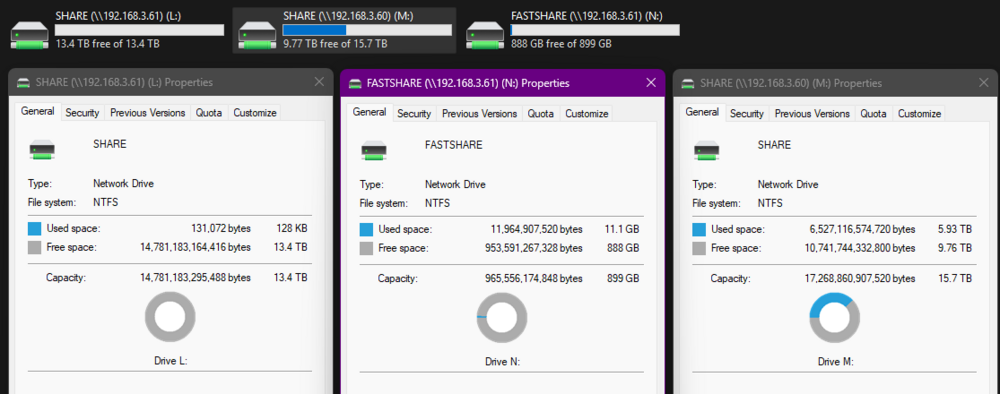
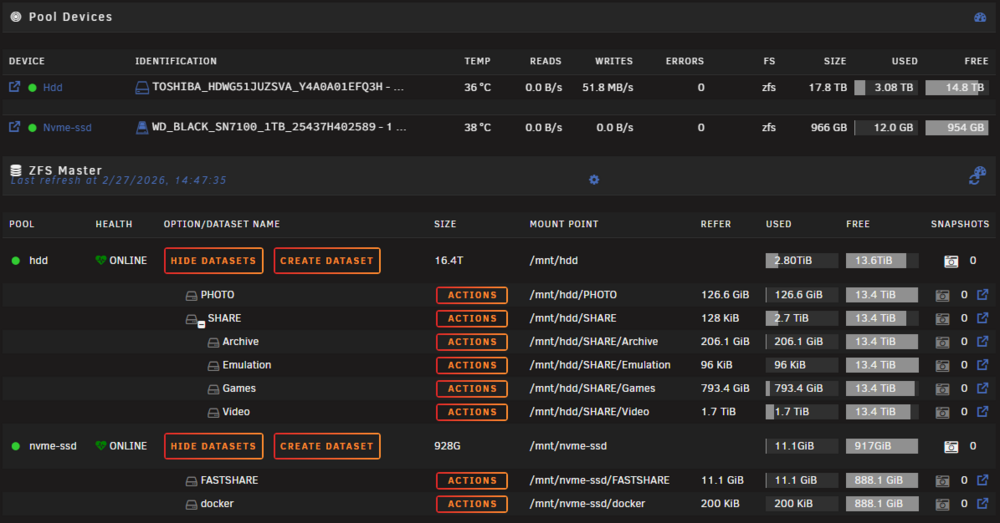
Hello! I'm in the process of migrating from Synology to Unraid. I'm also slightly reorganizing. My Synology setup had 2x18tb RAID1 HDDs in BTRFS. I've degraded the raid, put one of the drives to the new NAS where I'm setting up a new NAS with 7.2.4 Unraid on it. Then I wiped the drive, created new ZFS pool from GUI. After that I created a secure smb/nfs share called SHARE again using GUI. Then I decided that I want several nested datasets. I installed the ZFS Master plugin and created some nested datasets with mountpoints inside the parent SHARE dataset. At some point I noticed that Windows no longer reports used space on the mapped network share (\\ip\SHARE) authenticated with custom credentials. The share itself is secure. I think, at one point it did show everything properly but now it doesn't. At the same time I have another pool with a dataset without the nested datasets. This does show proper info. Another weird thing is that the total available space shown in Windows is actually the free space. So when I'm gradually filling this dataset using mostly nested datasets, I see the total space shrinking. Looking more closely, something weird happens with Unraid GUI too. Check out different "free" metrics. Am I correct in assuming that the only proper fix is to remove those nested datasets as they seem to be unsupported by Unraid? On the screenshots below 192.168.3.60 is the Synology with the exact same drive that's sitting in the Unraid 192.168.3.61