





LBro
Members
-
Joined
-
Last visited
-
Hi, Yes, it can be done, although it isn't built into Mover Tuning and the setup is fairly involved. I use Grafana for the graphs, fed by InfluxDB and Telegraf on Unraid. That lets me graph cache/pool activity and network throughput while Mover is running and retain the history afterward. There is an Unraid-specific Telegraf/Grafana video guide here that covers the basic monitoring stack. I then added custom metrics/panels for the mover/cache information I wanted. These might help: Grafana LabsUnraid System Dashboard V2 | Grafana Labs & 3. - Not sure, possibly the Developer could help? Take care, LBro
-
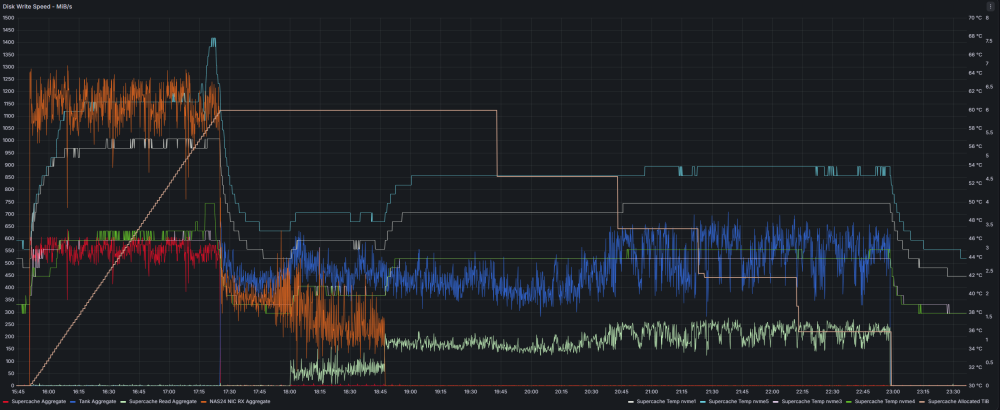
Mover Tuning with Very Large Backup Files — NAS24 Test ResultsWhat the graph showsThis Grafana graph was developed as both a testing and ongoing monitoring tool for NAS24. In one view it captures essentially the entire backup-transfer cycle: incoming network traffic, writes into the NVMe Supercache, growth of allocated Supercache space, the end of the FastCopy transfer, and the subsequent Mover drain from Supercache into the HDD Tank. The left scale is throughput in MiB/s. The right scales show NVMe temperature and Supercache allocation. Graph legend: Red — Supercache Aggregate: Aggregate writes into the NVMe Supercache Blue — Tank Aggregate: Aggregate writes to the five-HDD ZFS Tank Light green — Supercache Read Aggregate: Data being read from Supercache during Mover Orange — NAS24 NIC RX Aggregate: Total incoming network traffic to NAS24 White/Cyan/Purple/Green — NVMe temperatures: Temperatures of the four Supercache NVMes Tan — Supercache Allocated TiB: Amount of the NVMe pool occupied over time During the first portion of the graph, FastCopy is sending the backup to NAS24 while Supercache allocation rises almost linearly. At approximately 17:25 the incoming transfer ends. Supercache writes and network RX collapse, and the second phase becomes visible: Supercache is read while Tank is written as Mover drains the landing pool. By the end of the graph, the transferred backup has been moved to Tank and Supercache has been completely drained and is ready for the next large backup. Why this test is unusualNAS24 uses a roughly 7.8 TB NVMe Supercache in front of a five-drive ZFS HDD Tank. The system was built this way because backup sessions can be many terabytes and the network can deliver data considerably faster than the HDD pool can comfortably absorb directly. The workload is also atypical. Much of the data consists of very large AOMEI backup-container files, with individual files commonly hundreds of GB and sometimes approximately 1–2 TB. That makes Mover's individual file decisions unusually visible. For this test the backup share used: Primary storage: Supercache Secondary storage: Tank Mover direction: Supercache → Tank Mover Tuning start threshold: 65% Freeing threshold: 5% Age filtering: Off The objective is to let Supercache absorb a large high-speed backup and then automatically reclaim that NVMe capacity afterward for the next backup. The problem found during testingInitial testing was performed with Mover Tuning 2026.08.29. Results were disappointing: despite a 5% freeing threshold, Mover could stop with approximately 20% / 1.5 TB still occupying Supercache. The Mover Tuning developer investigated the results and confirmed a bug in the freeing-threshold calculation. With our exceptionally large files, the problem was particularly visible. One file involved in the investigation was approximately 1.576 TB by itself. The developer corrected the problem in Mover Tuning 2026.09.07 and explained precisely why the earlier behavior occurred. Final test with the corrected versionThe final FastCopy workload was: 7,752,616 MiB transferred Approximately 7.39 TiB / 8.13 TB decimal 28 files 2:56:42 elapsed 766.7 MB/s FastCopy average Verify disabled Sustained network throughput exceeded 1,000 MiB/s for extended periods during the Supercache-filling stage, with NAS24's Grafana NIC RX trace commonly running roughly 1,050–1,250 MiB/s The FastCopy figure is the end-to-end average for the complete copy job, while Grafana shows NAS24's instantaneous aggregate network receive rate, so the two figures measure different things. Supercache filled to approximately 6 TiB during the transfer. After FastCopy finished, Mover continued transferring the data to Tank. Most importantly, it did not stop at the approximately 20% utilization point seen with the earlier plugin version. Supercache ultimately drained completely. Why a 5% threshold can result in an empty poolWith files this large, a 5% freeing threshold should not be interpreted as Mover stopping at precisely 5%. Mover works with complete files. On a ~7.8 TB pool, moving another 1–2 TB file can take utilization from substantially above the threshold directly to essentially zero. For this particular backup workload, that is exactly what I want: maximum available Supercache capacity for the next multi-terabyte backup. For users who want particular files retained on the primary pool, minimum-age or skip-list controls may be more appropriate than relying solely on a low freeing threshold. ConclusionWith Mover Tuning 2026.09.07, NAS24 is now doing what this architecture was intended to do: High-speed network backup → fast NVMe landing pool → automatic post-transfer drain to ZFS HDD storage → empty Supercache ready for the next backup. The timing of this testing was fortunate. Only a couple of days earlier, the same configuration produced disappointing results because of the freeing-threshold bug. The developer responded quickly to the reported behavior, identified the cause, corrected it, and explained the change. Many thanks to the Mover Tuning developer for the exceptionally quick investigation and fix. Testing, analysis and documentation assisted by my tireless AI lab partner. LBro
-
I have a question about how the Freeing Threshold is intended to work, particularly with very large files. Before calling this a bug or edge case, I want to make sure I am not misunderstanding the setting or overlooking another option. My primary pool is a roughly 7.25 TiB ZFS NVMe pool, with secondary storage on a ZFS HDD pool. The share is set Primary → Secondary, and Mover Tuning was configured with: Moving Threshold: 65% Freeing Threshold: 5% I interpreted the 5% setting to mean that once Mover is triggered, it should continue selecting whole files until primary-pool usage gets approximately to 5%, possibly crossing somewhat below 5% when the final file is very large. In a recent run, the primary pool started at about 85% used / 6.2 TiB. Mover Tuning selected approximately 4.7 TiB and successfully moved it, but finished with about 1.5 TiB / 20% still on the primary pool. The unusual part of my workload is that many files are very large compressed backup containers, commonly 1–2 TB each. In this run, one file of 1,576,499,677,252 bytes was explicitly marked “keep on primary.” Looking at the Mover Tuning action data and age_mover, I think I understand why. Immediately before considering that file, projected remaining usage was about 1.581 TB. Moving the file would have left only about 4.55 GB, which is below the approximately 391.7 GB represented by the 5% threshold. The decision code appears to require projected remaining usage to remain at or above the threshold: remaining_bytes_used[$1] >= $6 Therefore the entire large file is kept, leaving roughly 1.5 TB on the primary pool instead of allowing usage to cross below the 5% threshold. I reproduced/confirmed the same comparison in both Mover Tuning 2026.08.29 and 2026.09.07. Am I interpreting the Freeing Threshold incorrectly, or is there another setting intended to handle this? If not, could this be a large-file edge case where the whole-file decision causes Mover to stop substantially above the requested freeing threshold? I have the Mover action list, debug log, exact calculations, and the relevant source-code section available if they would help. Thanks for taking a look.

