

Pro-289
-
Posts
50 -
Joined
-
Last visited
Content Type
Profiles
Forums
Downloads
Store
Gallery
Bug Reports
Documentation
Landing
Posts posted by Pro-289
-
-
I've done all the entries listed here for only specific access to folders via FTP. It all works okay, I log in with the user name and only the one user share is accessible.
But... I'm using Firefox to FTP into unRAID, and when I select the "Up to higher level directory", link displayed above my share, (adds "../"), I have access to the whole Linux directory structure. Not good. I can poke around and access the passwd file and the vsftpd.user_list file. I'm not even logging in as root.
I've tried to set "SMB Security Settings" for the flash drive to "No Access" for the particular user, but that didn't seem to do anything.
Is there something that can be done to restrict FTP access to ONLY the shares specified?
-
I installed a new unraid 5.0.5 and dynamix 2.2.10. During the install of Dynamix I was getting a lot of delays and errors pertaining to github certificate and addresses. But the install seemed to work okay.
But every time in the unRAID interface when I click on the Dynamix tab, there's a long delay until all the plugins display on the screen. It starts with just one at the top I think, then just sits there for about 10-15 seconds, then the email, smart, etc plugins display. I've tried this with an older install and the Dynamix menu displays instantly.
I've verified the time is set correctly. Anyone know what could be going on?
This sounds like a problem with your USB stick. Dynamix reads the settings from there each time when you change a page in the GUI.
Easiest probably is to take the USB stick out and run a disk check on it using windows.
But everything else seems to work okay. Watching the OS load on the monitor just wizzes by. Everything else loads perfectly in the unRAID GUI. That amount of wait that Dynamix does I don't think is related to the USB.
Somehow I think it's related to the delay issues I was getting during the install. Because it has to check for the latest version of every plugin at some point, so I'm assuming it does this when you display the plugin control GUI. If I can fix the certificate issues to github, then I'm guessing the delays will be fixed too.
-
I installed a new unraid 5.0.5 and dynamix 2.2.10. During the install of Dynamix I was getting a lot of delays and errors pertaining to github certificate and addresses. But the install seemed to work okay.
But every time in the unRAID interface when I click on the Dynamix tab, there's a long delay until all the plugins display on the screen. It starts with just one at the top I think, then just sits there for about 10-15 seconds, then the email, smart, etc plugins display. I've tried this with an older install and the Dynamix menu displays instantly.
I've verified the time is set correctly. Anyone know what could be going on?
-
This interface is by far the best I've seen. Not only are the real time stats cool, but the other "geeky" information is so cool too. Brings another dimension to my purchase. This should be standard with all downloads of unRAID.
Thank you.
-
So I guess the question here is "is 24/7/365 referring to spinning time / activity on the drives or being in a box which is powered on but the drives are spun down"?
I would guess here that 24/7/365 would mean that your drive is spinning and active for 24/7/365.
On a side note, I seem to have one drive now that when it tries to spin up I hear the "spin up" noise for about 3 seconds when it's normally 1 second. It's an original Samsung 2TB drive. Those drives you can distinctly hear the "power up" motor. I suppose if I checked the SMART I'd see the Spin Up flag set a bit high due to long power ups.
I've seen some drives with 1000 to 3000 spin ups in SMART. YMMV..
-
I don't trust Seagate anything these days. I used to back in 2006.
But now all the failed drives I see in the shop are either Seagate, Toshiba, or Hitachi. In order of failures.
Of course I still see some Western Digital drives. But those are way less often than the others. So I pick the lesser of 4 evils. I've had great success with hundreds of WD drives I've purchased. I know I would not be a happy person if I was trying to save $10 a drive and purchased SGs.
And I'm talking about smaller drives here. Like 500GB to 1.5TB. The Seagate 1TB and 1.5TB drives are the WORST! They seem to last about 1 to 1.5 years until bad sectors start. Hmm, 1TB per year!?!?
I could never purchase a Seagate hard drive now in good conscious. Even if you gave me one I don't think I'd use it for anything of value.
There's been a shift to solid states lately. Mostly on the smaller side. Samsung is "once again" the leader in drives with their Evo series. Just like they used to be with their 2TB HDDs before Seagate bought them out and ruined the product line.
I'm not sure if the Samsung company is still in control of their solid state hard drive plant, but here's a quote from a press release;
"This transaction was announced in April 2011 along with a series of other agreements between Seagate and Samsung. Seagate is supplying disk drives to Samsung for PCs, notebooks and consumer electronics devices. Samsung is supplying its market-leading semiconductor products for use in Seagate's enterprise solid state drives (SSDs), solid-state hybrid drives and other products."
-
That's a-lot-a eggs..

-
That diskspeed.sh script uses hdparm. So I tried an 'hdparm -t /dev/sdb' and I was able to do a disk read test. But it was too short. What I'd need is a script to keep repeating the 'hdparm -t' command. Then I could get really crazy and try the -T switch to test each drive using its onboard cache only. With one drive's cache I got a 4535.43 MB/sec test.
-
Testing each drive individually is certainly good for testing the throughput of the drive itself (i.e. is the drive itself underperforming) or testing the individual port it is plugged into. But if you are looking for BOTTLENECKS, you need to be testing all drives at once, or at least all drives connected to each individual controller at once.
Here's an example. Let's assume you had 4 of the Seagate 1TB/platter drives connected to a 4-port 1x lane PCIe card in a v1.x slot. A v1.x slot is is capable of 250MB/s per lane. If it were a 1 lane card then its maximum throughput is 250MB/s. If you ran a throughput test on each individual drive on that controller separately, they would all pass with flying colors as the drive is capable of about 180MB/s and the card is capable of 250MB/s. But if you ran a throughput test on all 4 drives simultaneously you would see there is a problem as the 4 combined drives are capable of roughly 720MB/s throughput, yet your card can only handle 250MB/s. You would therefore see each drive reporting roughly 62MB/s throughput and know you had a bottleneck somewhere.
Precisely what I want to do. But I'm looking for a way other than using screen for multiple threads and running preclear_disk.sh read-only in each screen.
I kind of did this before when I was originally clearing 4 drives at once. I was able to see the bandwidth of each drive to make sure they each got their max speeds. I'm just a bit uneasy running preclear_disk.sh on drives that have data.
-
And during a parity check all drives are being read at maximum throughput. Isn't this exactly the type of test you're trying to do?
Well, again, I don't want to know the total maximum throughput. I have 5 drives using onboard SATA, 3 drives on one PCIe SATA card, and one drive on another PCIe SATA card (experimenting at the moment with this).
If my onboard SATA bus is the bottleneck, I would never know it. Same if my PCIe card with 3 drives happens to be in a bad and/or PCIe 1.x slot I'd never know.
I suppose I'll just have to run a preclear read only on all my drives to find out what I'm looking for. I'd be able to check each drive one by one to make sure they're running around 130MB/s. If I find one or more lower then I'd be able to track it down and reconfigure my setup for optimum performance. Either do this or I suppose I'll have to look into IOZone as I mentioned before.
-
Yea, I've found some bad spots on the drive that just aren't being remapped through SMART. I ran Spinrite to check for bad sectors, and sure enough around 720400000, the same area in the syslog, brought Spinrite to a halt. I know my drive is not fully compatible with Spinrite, it only found the drive as a 2.2TB instead of a 3TB, but it was able to get to a bad spot at 16.77% in. I even tried a level 4 test to read and write each sector, but it just froze when it got to the bad spot. I also tried the jumpers on the hard drive to put it in 3Gbps mode and spread spectrum mode.
When I had it in IDE mode I was getting the error "This sector contains data requiring recovery using a deeper testing level", and it never kicked in to Dynastat recovery mode. In IDE or AHCI mode it just eventually quit with a red error box. I've seen the same error in the past with other bad drives that Spinrite was able to recognize.
With all these reads and writes using Spinrite, parity check, and normal parity use never kick the bad sectors into the spare area. So I doubt running another preclear would flag the bad sectors if everything else hasn't yet. I think it's off to RMA I go.
-
A parity check reports the total time in the syslog upon completion.
I'm not looking for the total time it takes. I want to know the total hard drive bus bandwidth is use while all hard drives are being read. Ya know, see if there's a bottleneck in my configuration. Make sure my PCIe card is working to spec. Make sure my onboard SATA ports are functioning properly.
-
I'm thinking I could use the preclear_disk.sh script with the -V switch to skip the pre-read and clear and go straight to the post-read verify. I could then run screen and do this for all the drives? I'd be able to view the initial MB/s read speed and see if it decreases when starting up more drives.
I know it's dangerous running preclear on disks with data, but as long as I use the -V to only post-read I'd be okay, right? It wouldn't change any bits on drives, only read them?
Is there a more elegant and proper way to stress the hard drive bandwidth to make sure the onboard and pcie cards are functioning properly? I've heard if IOZone, has anyone had success with that on an unRAID system without damaging data?
-
If you put the drive in Windows and it shows up as unformatted or corrupt, you'll have to run some recovery programs like Active@ Partition Recovery. You could also try their file recovery to scan the whole drive to try and piece your files back together. If it finds partition pieces it can virtually mount them and you may have access to your data. You may be in luck since you stopped it after a minute. I've had success with that software on numerous occasions with hard drives, usb drives, and memory sticks. I've even recovered data from a drive that was quick formatted.
-
The pre-clear reports should be in /boot/preclear_reports. Running pre-clear again may be helpful.
Well the pre-clear logs show nothing, the values are just zero, because the drive was brand new. The raw_read value was 100 at start, then went back to 200 at finish. The worst was 253 then went to 200 at finish. Some of the same sector areas come up each time I do a parity check. But I end up having 0 parity errors. So it's hard to believe if these warnings are critical or not. UnRAID calls them errors, but the data is still okay. This is driving me nuts. I just wanted to build this thing and be done with it.
-
I get some of those "frozen" errors in my log too. But it's only while copying from one drive to another using Midnight Commander logged in as root, and while trying to access the config menu via http. I figure the system is busy accessing 2 data drives + parity, then when I access the menu it just freezes for about 15 seconds, then continues and writes the "frozen" error in the log and resets one of the drive's "link". But for me it's happening on ata7 even though I'm not using the drive on ata7 in the copying. Maybe it's a sort of "system busy" error message. Oh well, probably has no relation to your issue.
-
There's also a calculation bug in 5.0.4 that calculates the total space used, I believe, when you have unformatted disks present. After I pre-cleared 4 drives and went to the main page they showed up as unformatted, but the space used from working 4 drives didn't add up to the total used. It said there was somewhere around double used. Oh well, went away after formatting the drives.
-
How is the parity drive connected? What are the complete system specs?
System: ASRock - H55M/USB3.
CPU: Intel® Core i3 CPU 530 @ 2.93GHz - 2.933 GHz
Cache: 128 kB, 512 kB, 4096 kB
Memory: 4096 Module (max. 8 GB)
Network: eth0: 100Mb/s - Half Duplex (What's up with this? It's a Gigabit LAN in a Gigabit router.)
5 3TB HDs in onboard SATA 3.0Gbps, Parity one of them
4 2TB HDs in PCI-E IOCrest (SI-PEX40064) SATA expansion card
I believe it's got a 500W power supply.
-
I've built a new server with 5 3TB drives, and added 4 2TB drives later. But my parity drive is showing occasional Errors on the Main screen. I've precleared all the drives, but don't remember any before or after stats.
I filled the 4 drives with data, then enabled the parity drive. I ran a parity check but it found 0 errors. But the syslog is filled with tons of "disk0 read error". The SMART doesn't show any reallocated sectors, but does show some possible "Raw_Read_Error_Rate" and "Multi_Zone_Error_Rate". In the log there's a lot of "ata1.00: exception Emask 0x0 SAct 0x0 SErr 0x0 action 0x0 (Errors)" errors. So it looks like they're all coming from the disk0 parity drive. I've tried 3 different SATA cables, 2 different onboard SATA ports, and only the parity drive powered on/plugged in.
After the parity check, there were 605 Errors displayed on the Main page, but yet 0 parity errors:
Device Identification Temp. Size Used Free Reads Writes Errors View
[spin Down] Parity WDC_WD30EFRX-68EUZN0_WD-**********60 (sdb) 2930266532 72 °F 3 TB - - 128,406,159 32,564 605
Last checked on Thu Jan 2 06:58:55 2014 PST (yesterday), finding 0 errors.
> Duration: 7 hours, 55 minutes, 37 seconds. Average speed: 105.1 MB/sec
No bad sectors, but could it be a bad controller on the drive, or bad drive memory chips?
Below are my logs.
-
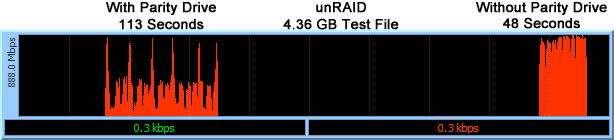
I'm sure other people have done speed tests and know already that parity drives slow down writes to the array. But I was just experimenting with a speed test with and without a parity drive. I have a gigabit network and transferred over a 4.36GB file.
With the parity drive it took 113 seconds. Without the parity drive it took 48 seconds. Pretty big difference, cuts the time down more than half. My peak bandwidth was almost 900 Mbps. In the picture below you can see a visual on the actual test using DUMeter. Just thought it was interesting and figured I'd share it with everyone.


unRAID 6 Virtualization Update
in Unraid Blog and Uncast Show Discussion
Posted
Seems a bit excessive for a file storage program.