

bungee91
-
Posts
744 -
Joined
-
Last visited
Content Type
Profiles
Forums
Downloads
Store
Gallery
Bug Reports
Documentation
Landing
Posts posted by bungee91
-
-
I've reverted to 6.1.9 for testing purposes.
As others may already know, this lead to all installed Dockers no longer being shown (I assume the version change in 6.2), and all VM's created within 6.2 to no longer be listed.
Not really a big issue, just was unaware, luckily had a backup of all UUID's for Windows or activation would have deactivated.
Dockers are easy to reinstall thanks to the saved templates!
It is my assumption the problem will be resolved (I'm also crossing fingers, pinches of salt over shoulders, etc..), as I certainly started noticing this towards the end of the beta cycle for 6.2.
If I get to a week of uptime without this showing, I will consider this issue solved in that it is certainly a change within the kernel update included within 6.2.
I have lately only been able to go a day or two without this being present.
If it does show up, I'm seriously out of ideas.
Memory tested good, timings are even relaxed (running 2133 on 2400 ram), motherboard has been replaced with a completely different model.
In my RMA'ing (dead MB, and GPU) the only other thing replaced was the GPU for my main VM, however the messages certainly sound more memory/CPU related.
This would only leave the CPU, and that is highly unlikely given no other related issues.
Power supply also replaced, more for a "I want this shiny new toy", vs problem resolution.
-
Thanks for the reply, I get it..
I've switched these duties to the Pi for now, should suffice in the mean time. Keep up the great work, "go team" etc..

-
For the life of me I cannot get rid of these errors.
This is what I know, certain of it at this point (yelling) THIS IS NOT A HARDWARE FAULT (got that off my chest! @LT need some further help)

I've been getting messages like these for a while now:
Server kernel: CPU: 10 PID: 11439 Comm: qemu-system-x86 Tainted: G W 4.4.15-unRAID #1They all seem to start with this message first:
Server kernel: alloc_bts_buffer: BTS buffer allocation failure
Modules linked in: xt_CHECKSUM iptable_mangle ipt_REJECT nf_reject_ipv4 ebtable_filter ebtables vhost_net tun vhost macvtap macvlan xt_nat veth ipt_MASQUERADE nf_nat_masquerade_ipv4 iptable_nat nf_conntrack_ipv4 nf_nat_ipv4 iptable_filter ip_tables nf_nat md_mod hwmon_vid igb ptp pps_core mxm_wmi fbcon bitblit fbcon_rotate fbcon_ccw fbcon_ud fbcon_cw softcursor font ast drm_kms_helper cfbfillrect cfbimgblt x86_pkg_temp_thermal cfbcopyarea ttm coretemp drm kvm_intel kvm agpgart syscopyarea sysfillrect sysimgblt fb_sys_fops fb ahci i2c_i801 fbdev sata_mv i2c_algo_bit libahci ipmi_si wmi [last unloaded: pps_core]
So I replaced my motherboard with a snazzy new one!
Memtest 86+ (newest Passmark), ran for 19 hours, 6 passes, no errors.
Replaced all VM's with newly installed UEFI ones (Windows 10, newest virtio).
In my opinion this is an allocation issue regarding memory allocation and KVM. Maybe this has to do with hugepages, or shared memory, IDK.
I reboot, it goes away for a day or so, then comes back.
Same issue fixed in v4.0 of kernel https://bugzilla.kernel.org/show_bug.cgi?id=93251
I'm honestly shocked no one else is having this issue, something unique to my processor or something?
Looking for any help, or pointers.
I'm considering disabling Hyper-v (I have two in use Nvidia cards) and going back to 6.1.9, as this issue was never present on that version.
Guarantee turning off VM's completely will keep the error from occurring (not exactly something that fixes the issue).
@RobJ any chance you can look at the new logs and provide any input? Thanks for looking before.
-
Decided to load alpha 3 (which is stated as the last alpha), normally OE was so far distant I wouldn't dare (2 Pi's in house, thanks LE!).
Now realizing this is still stuck at 16, any chance an update is happening prior to beta releases?
-
On my board the IP for IPMI is listed on the initial power on, and always on reboot prior to POST completing.
If it is listed as 0.0.0.0 or X.X.X.X you know you have an issue resolving the IP address for the IPMI LAN connection.
Do you have any status lights on the NIC for this LAN connection? If not, this is likely hardware related, swap cables with your other LAN port and see if this changes.
-
+1, maybe we could set something up with a reseller similar to how XBMC/Kodi does this, or even some other places I can't won't mention.
Obviously this would need to be done with the blessing of LT, and hopefully they would come up with the preferred design or items.
Special link to order directly through the seller, LT gets a % of each sale.
-
I'm not seeing the GPU listed that you pass through to the VM.
What version of virtio do you have installed? If older, please update to the newest.
You also didn't provide a diagnostic, which would help in determing the root of the crash.
What machine type (i440fx or Q35?) are you using, how much ram/cpu's assigned?
Since you don't seem to require the GPU attached at all times, does this happen when you remove the GPU and use VNC as the graphics type?
Since you have "6x 2GB DIMM's" (which is an irregular amount), have you ran the included Memtest at least once to verify you don't have memory errors (multiple times certainly preffered)?
-
All major updates have required a single core to be assigned to the VM to be successful (yes I'm sure some have done it with multiple, not looking for debating this), this was most noticeable on an upgrade from 7/8/8.1 to 10. Core 0 is recommended, however I suppose any 1 core should be fine.
Why this is the case, IDK, but folklore dictates this is how it is for now.

As for activation, as long as you keep the UUID from the VM XML the same, and do not change the machine type from one to the other (i440-fx to Q35 or vice versa) you should come up activated without needing intervention. The machine type change is up for debate (in regards to activation), however I can't see the benefit to changing it anyhow unless you have some odd results (as i440FX is the recommended and you shouldn't normally need to change it).
-
Did you try the update with only core 0 assigned to the VM?
-
Glad you figured it out!
-
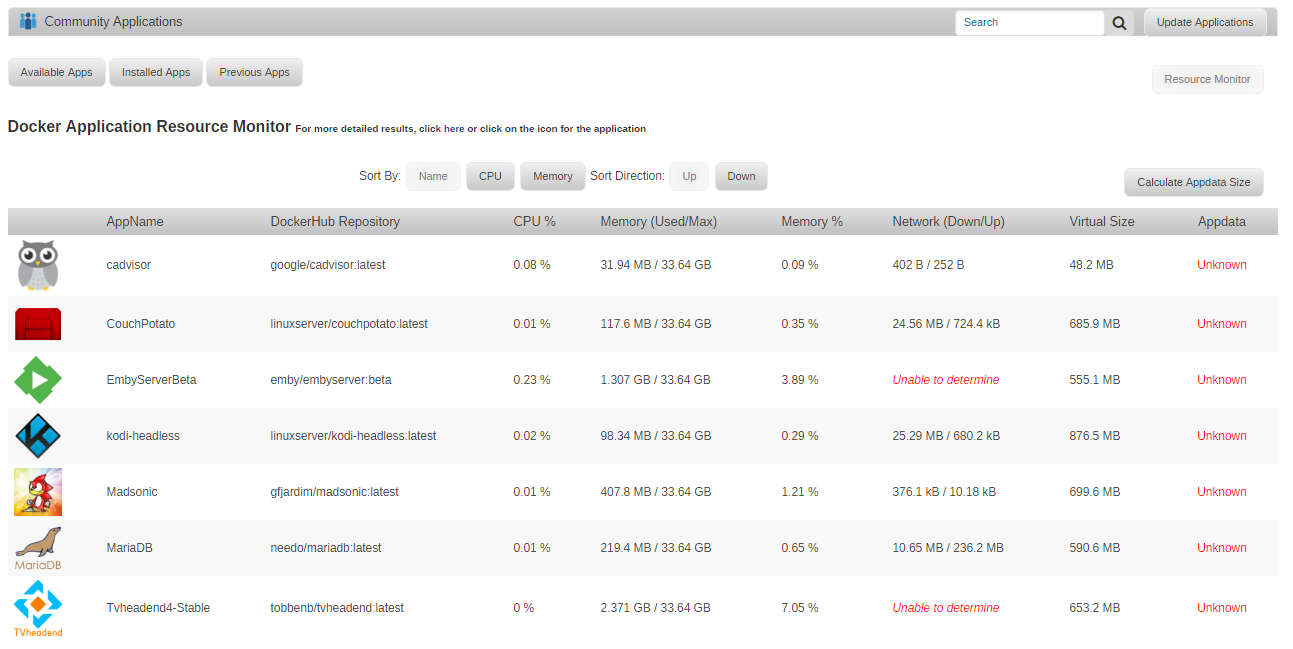
If you want to see the amount of memory any particular docker app is using check out CA's resource monitor (or cAdvisor). Note that at any particular moment in time a docker app can use all available (cached / free) memory for its own purposes unless you outright limit it.
Sent from my LG-D852 using Tapatalk
Yep, I get it... You da man and all, but not too much going on in my Docker world (see pic).
I've even disabled the Docker service and it didn't change much at all, at the most 5% reported on the Dashboard.
Edit: Well not exactly "not too much going on" but ~4.8GB or so total for Docker, which agrees with the System stats total used amount of ~10GB.
In no way agreeing with the 60% I now see on the Dashboard used amount.
-
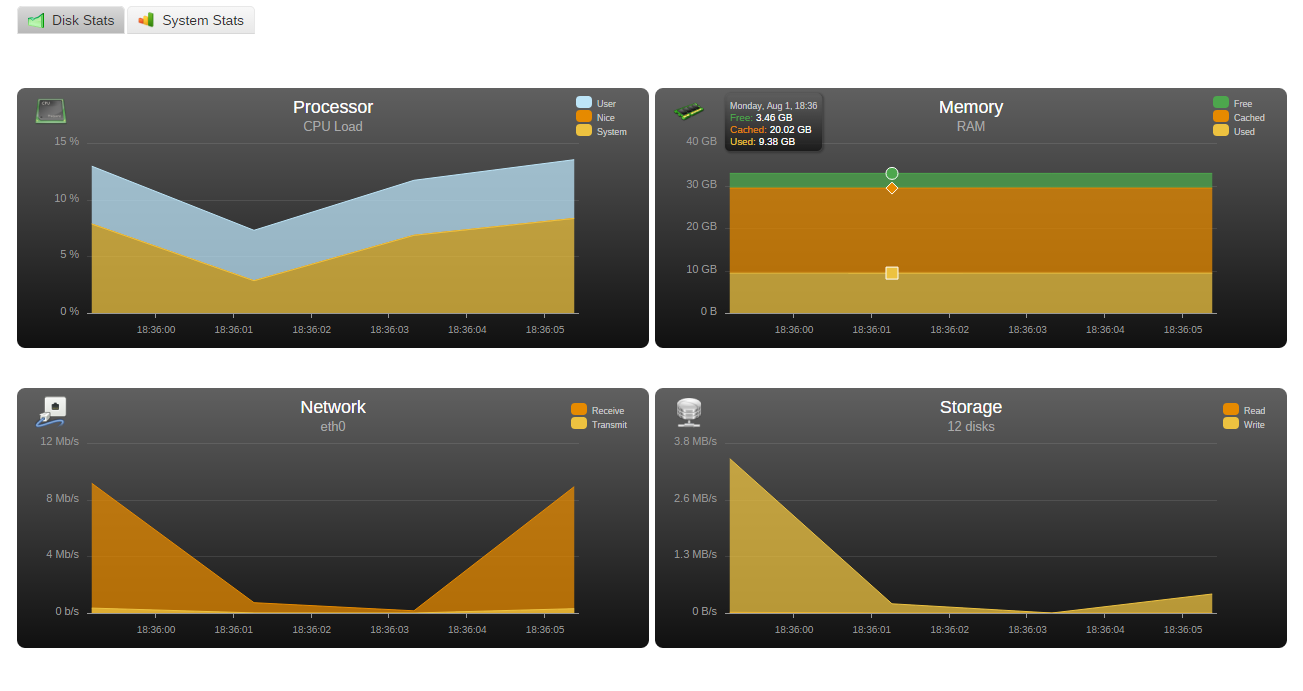
One more, interesting results!!
See attached pic.
I'm showing 9.38GB used, 20.02GB cached, with 3.46GB free.
I'm currently showing memory usage at 59% with all plugins back loaded (made almost zero difference and 1 4GB VM running now as the wife was complaining).
The 9.38GB used sounds very reasonable considering 4GB for VM, which means ~5GB for Docker, Plugins, and UnRAID itself..
So then, why am I showing 59% memory usage?
Does system stats use a different reporting method than the Dashboard memory usage?
-
I removed every optional plugin (so the only ones listed are UnRAID and Dynamix) and memory usage didn't go down at all.. So 40% for what exactly?..
-
I don't see an awful lot wrong on first glance. I raised an issue a while back about Memory usage and was advised (quite glibly) that unRAID requires a "fair" amount of memory with Docker and VM services running even without much being hosted by them.
As for the unregister_netdevice message, I get this too. I have also seen others writing posts about it. It seems the prevailing opinion is that it is benign and harmless. I don't know if it has made its way over to 6.2 but I just ignore it.
This is actually a newer issue with me lately, never had the OOM errors before.
However I certainly have some form of memory issues (which do not show in Memtest) lately, which I hope to resolve soon. I have another thread related to that and everyone seems stumped that I've talked to about it. I think there may be a memory related issue with my MB, will know that soon when evaluating a new one.
What makes 0! (zero!) sense is, okay I have 40% used with minimal things running (UnRAID and some rather lightweight plugins) why doesn't any output show me what is using 40% (relates to 12.8GB's) of ram? That's a decent amount allocated to processes not being used as buffer or cache! I'm nearly certain if I reboot I will be back in the 10-20% range with no Docker/VM's loaded.
When I first started my primary (8GB assigned) VM after updating to RC3 two days ago it took a LONG time to start. When it finally did I received this message:
Jul 30 06:07:32 Server kernel: pmd_set_huge: Cannot satisfy [mem 0x383fb0000000-0x383fb0200000] with a huge-page mapping due to MTRR override.
I did some searching, nothing too helpful found, but I thought I should mention it at this point.
As for the unregister_netdevice message, I get this too. I have also seen others writing posts about it. It seems the prevailing opinion is that it is benign and harmless. I don't know if it has made its way over to 6.2 but I just ignore it.
Well I'm on 6.2, so I'd say it arrived..
 It just happened to popup while I had it loaded, so figured I'd report it.
I'm hoping to find something using this extra ram prior to just rebooting.
-
I've decided to completely disable all running VM's, this results in a drop from 88% showing on the dashboard, to 42% showing.
This was a total of 12GB's assigned, with 3 VM's that were active.
The drop in % of 46% is ~correct for the 32GB installed with 12GB's being available.
It was ~15% free'd after each one shutdown.
So if there really is 32GB available and I'm not dropping 1/2 of it for no good damn reason, what in the heck is using 42% with very little running?
Completely disabling Docker also leads to an additional 2-3% drop in memory usage, with a dashboard reading of 40% usage.
I removed cache directories plugin and it made 0% difference, so I put it back.
I have the following optional plugins installed:
Unassigned Devices
Community Applications
Dynamix Cache Directories
Dynamix Schedules
Dynamix SSD Trim
Dynamix System Buttons
Dynamix System Information
Dynamix System Temperature
Fix Common Problems
Nerd Tools
Open Files
Powerdown
Preclear Disks
Server Layout
Tips and Tweaks
UnBalance
Does any of the memory outputs or diagnostics show a specific PID or process consuming far more memory than normal?
I'm not seeing anything in particular, and ~40% with no VM's or Dockers running is a LOT!
Edit:
Here is the output of top with no Dockers or VM's running:
root@Server:~# top
top - 17:05:03 up 2 days, 23:17,  1 user,  load average: 0.65, 0.71, 0.78
Tasks: 361 total,   2 running, 358 sleeping,   0 stopped,   1 zombie
%Cpu(s):  3.6 us,  6.7 sy,  0.0 ni, 89.6 id,  0.0 wa,  0.0 hi,  0.0 si,  0.0 st
KiB Mem : 32851508 total, 13708548 free,   460912 used, 18682048 buff/cache
KiB Swap:        0 total,        0 free,        0 used. 19863664 avail Mem

  PID USER      PR  NI    VIRT    RES    SHR S  %CPU %MEM     TIME+ COMMAND
8074 root      20   0   11960   2332   2028 R  55.6  0.0   0:01.68 find
9585 root      20   0   91600   5436   3036 S   3.6  0.0  19:34.14 emhttp
   12 root      20   0       0      0      0 S   0.7  0.0   0:24.60 ksoftirqd/1
7910 root      20   0   16772   3256   2344 R   0.7  0.0   0:00.05 top
10903 root      20   0    9832   2732   2120 S   0.7  0.0   0:04.47 cache_dirs
    3 root      20   0       0      0      0 S   0.3  0.0   3:59.42 ksoftirqd/0
    7 root      20   0       0      0      0 S   0.3  0.0   9:14.45 rcu_preempt
   20 root      20   0       0      0      0 S   0.3  0.0   1:05.60 ksoftirqd/3
   24 root      20   0       0      0      0 S   0.3  0.0   1:06.63 ksoftirqd/4
   40 root      20   0       0      0      0 S   0.3  0.0   1:11.43 ksoftirqd/8
2529 root      20   0  297196  15552  13028 S   0.3  0.0   0:11.46 smbd
2558 root      20   0    9684   2576   2124 S   0.3  0.0  13:05.95 cpuload
9683 avahi     20   0   34496   3180   2764 S   0.3  0.0   0:20.01 avahi-daemon
13852 nobody    20   0   15232   7648   6476 S   0.3  0.0   0:03.88 unbalance
    1 root      20   0    4372   1548   1440 S   0.0  0.0   0:07.56 init
    2 root      20   0       0      0      0 S   0.0  0.0   0:00.02 kthreadd
    5 root       0 -20       0      0      0 S   0.0  0.0   0:00.00 kworker/0:0H
    8 root      20   0       0      0      0 S   0.0  0.0   0:00.01 rcu_sched
    9 root      20   0       0      0      0 S   0.0  0.0   0:00.01 rcu_bh
   10 root      rt   0       0      0      0 S   0.0  0.0   0:01.41 migration/0
   11 root      rt   0       0      0      0 S   0.0  0.0   0:01.76 migration/1
   13 root      20   0       0      0      0 S   0.0  0.0   0:00.00 kworker/1:0
   14 root       0 -20       0      0      0 S   0.0  0.0   0:00.00 kworker/1:0H
   15 root      rt   0       0      0      0 S   0.0  0.0   0:01.60 migration/2
   16 root      20   0       0      0      0 S   0.0  0.0   2:15.15 ksoftirqd/2
   19 root      rt   0       0      0      0 S   0.0  0.0   0:01.62 migration/3
   22 root       0 -20       0      0      0 S   0.0  0.0   0:00.00 kworker/3:0H
   23 root      rt   0       0      0      0 S   0.0  0.0   0:01.38 migration/4
   26 root       0 -20       0      0      0 S   0.0  0.0   0:00.00 kworker/4:0H
   27 root      rt   0       0      0      0 S   0.0  0.0   0:01.52 migration/5
   28 root      20   0       0      0      0 S   0.0  0.0   1:06.10 ksoftirqd/5
   30 root       0 -20       0      0      0 S   0.0  0.0   0:00.00 kworker/5:0H
   31 root      rt   0       0      0      0 S   0.0  0.0   0:02.70 migration/6
   32 root      20   0       0      0      0 S   0.0  0.0   1:33.22 ksoftirqd/6
   35 root      rt   0       0      0      0 S   0.0  0.0   0:02.05 migration/7
   36 root      20   0       0      0      0 S   0.0  0.0   0:11.15 ksoftirqd/7
   37 root      20   0       0      0      0 S   0.0  0.0   0:00.00 kworker/7:0
   38 root       0 -20       0      0      0 S   0.0  0.0   0:00.00 kworker/7:0H
   39 root      rt   0       0      0      0 S   0.0  0.0   0:02.90 migration/8
   41 root      20   0       0      0      0 S   0.0  0.0   0:00.00 kworker/8:0
   42 root       0 -20       0      0      0 S   0.0  0.0   0:00.00 kworker/8:0H
   43 root      rt   0       0      0      0 S   0.0  0.0   0:02.71 migration/9
   44 root      20   0       0      0      0 S   0.0  0.0   0:48.48 ksoftirqd/9
   46 root       0 -20       0      0      0 S   0.0  0.0   0:00.00 kworker/9:0H
   47 root      rt   0       0      0      0 S   0.0  0.0   0:02.18 migration/10
   48 root      20   0       0      0      0 S   0.0  0.0   0:39.52 ksoftirqd/10
   49 root      20   0       0      0      0 S   0.0  0.0   0:00.00 kworker/10:0
   50 root       0 -20       0      0      0 S   0.0  0.0   0:00.00 kworker/10:0H
   51 root      rt   0       0      0      0 S   0.0  0.0   0:02.36 migration/11
   52 root      20   0       0      0      0 S   0.0  0.0   0:41.12 ksoftirqd/11
   53 root      20   0       0      0      0 S   0.0  0.0   0:00.00 kworker/11:0
   55 root      20   0       0      0      0 S   0.0  0.0   0:00.00 kdevtmpfs
   56 root       0 -20       0      0      0 S   0.0  0.0   0:00.00 netns
   59 root       0 -20       0      0      0 S   0.0  0.0   0:00.00 perf
  313 root       0 -20       0      0      0 S   0.0  0.0   0:00.00 writeback
  315 root      25   5       0      0      0 S   0.0  0.0   0:00.00 ksmd
root@Server:~# free -m
              total        used        free      shared  buff/cache   available
Mem:          32081         446       13392       11261       18243       19402
Swap:             0           0           0
root@Server:~# cat /proc/meminfo
MemTotal:       32851508 kB
MemFree:        13713264 kB
MemAvailable:   19868064 kB
Buffers:            1420 kB
Cached:         16295608 kB
SwapCached:            0 kB
Active:          2330584 kB
Inactive:       14018372 kB
Active(anon):     432144 kB
Inactive(anon): 11151056 kB
Active(file):    1898440 kB
Inactive(file):  2867316 kB
Unevictable:           0 kB
Mlocked:               0 kB
SwapTotal:             0 kB
SwapFree:              0 kB
Dirty:                 0 kB
Writeback:             0 kB
AnonPages:         51348 kB
Mapped:            36480 kB
Shmem:          11531644 kB
Slab:            2383884 kB
SReclaimable:    1895888 kB
SUnreclaim:       487996 kB
KernelStack:        6592 kB
PageTables:         5844 kB
NFS_Unstable:          0 kB
Bounce:                0 kB
WritebackTmp:          0 kB
CommitLimit:    16425752 kB
Committed_AS:   11707996 kB
VmallocTotal:   34359738367 kB
VmallocUsed:           0 kB
VmallocChunk:          0 kB
AnonHugePages:      8192 kB
DirectMap4k:       11668 kB
DirectMap2M:     1916928 kB
DirectMap1G:    31457280 kB
Also odd.. This popped up just now while SSH'd to my server in the terminal window:
Message from syslogd@Server at Aug  1 17:05:18 ...
kernel:unregister_netdevice: waiting for lo to become free. Usage count = 1

Message from syslogd@Server at Aug  1 17:05:28 ...
kernel:unregister_netdevice: waiting for lo to become free. Usage count = 1
-
Sacrifices happen
and well I think 1/2 of my memory disappeared, causing such an issue.If someone versed in looking at this kind of info can confirm, I'd appreciate it.
If I reboot, I'm nearly certain all will be well again for a while.
In the likely all too related issues I'm having with memory, I've recently started getting OOM related issues.
My primary VM was shutdown, and when looking at the syslog I see this:
Aug  1 03:01:15 Server kernel: Out of memory: Kill process 24203 (qemu-system-x86) score 267 or sacrifice child
Aug  1 03:01:15 Server kernel: Killed process 24203 (qemu-system-x86) total-vm:9391912kB, anon-rss:9009808kB, file-rss:22508kB
I have 32GB installed, and only 20GB to VM's, approximately 5GB used for Docker, and the rest for UnRAID.
Looking at the dashboard I see 32.082GB allocated and 32GB installed, usage at 88%.
Here's some memory related outputs:
root@Server:~# free -m
              total        used        free      shared  buff/cache   available
Mem:          32081       16102         418       11261       15561        3764
Swap:             0           0           0
This is interesting since it shows 32081 total, with 16102 used, and somehow only 418 free..

Edit: The rest is likely in buff/cache and shared, so maybe I'm mistaken.
root@Server:~# cat /proc/meminfo
MemTotal:       32851508 kB
MemFree:          638380 kB
MemAvailable:    4001440 kB
Buffers:             140 kB
Cached:         14123816 kB
SwapCached:            0 kB
Active:          8227844 kB
Inactive:       12607492 kB
Active(anon):    7091536 kB
Inactive(anon): 11151660 kB
Active(file):    1136308 kB
Inactive(file):  1455832 kB
Unevictable:     9309128 kB
Mlocked:         9309128 kB
SwapTotal:             0 kB
SwapFree:              0 kB
Dirty:             12732 kB
Writeback:           436 kB
AnonPages:      16021112 kB
Mapped:           118628 kB
Shmem:          11531304 kB
Slab:            1747484 kB
SReclaimable:    1277764 kB
SUnreclaim:       469720 kB
KernelStack:       15168 kB
PageTables:        47964 kB
NFS_Unstable:          0 kB
Bounce:                0 kB
WritebackTmp:          0 kB
CommitLimit:    16425752 kB
Committed_AS:   28726276 kB
VmallocTotal:   34359738367 kB
VmallocUsed:           0 kB
VmallocChunk:          0 kB
AnonHugePages:   5226496 kB
DirectMap4k:       11668 kB
DirectMap2M:     1916928 kB
DirectMap1G:    31457280 kB
root@Server:~# vmstat -s
     32851508 K total memory
     16161984 K used memory
      8056764 K active memory
     12634340 K inactive memory
       782400 K free memory
          140 K buffer memory
     15906984 K swap cache
            0 K total swap
            0 K used swap
            0 K free swap
     20001635 non-nice user cpu ticks
          656 nice user cpu ticks
      9901986 system cpu ticks
    268785745 idle cpu ticks
      3960507 IO-wait cpu ticks
            0 IRQ cpu ticks
       206487 softirq cpu ticks
            0 stolen cpu ticks
   1794507562 pages paged in
   1879844435 pages paged out
            0 pages swapped in
            0 pages swapped out
   1553446086 interrupts
    229120367 CPU context switches
   1469832426 boot time
      4671468 forks
root@Server:~# top
top - 16:20:34 up 2 days, 22:33,  1 user,  load average: 1.10, 1.36, 1.09
Tasks: 457 total,   1 running, 456 sleeping,   0 stopped,   0 zombie
%Cpu(s):  3.5 us,  5.7 sy,  0.0 ni, 90.8 id,  0.0 wa,  0.0 hi,  0.0 si,  0.0 st
KiB Mem : 32851508 total,   761320 free, 16161548 used, 15928640 buff/cache
KiB Swap:        0 total,        0 free,        0 used.  4182392 avail Mem

  PID USER      PR  NI    VIRT    RES    SHR S  %CPU %MEM     TIME+ COMMAND
7956 root      20   0 5013540 4.472g  14964 S  12.9 14.3 869:04.77 qemu-syste+
24351 root      20   0 4918704 4.434g  22484 S   5.9 14.2 594:54.11 qemu-syste+
21145 root      20   0 4949424 4.464g  22484 S   5.6 14.2 109:46.80 qemu-syste+
20806 nobody    20   0 7412476 1.046g  15568 S   3.0  3.3  90:47.51 mono-sgen
9585 root      20   0   91468   5400   3036 S   1.7  0.0  18:16.84 emhttp
10148 root      20   0   10144   3052   2124 S   1.3  0.0  19:36.68 cache_dirs
    3 root      20   0       0      0      0 S   1.0  0.0   3:56.64 ksoftirqd/0
26015 root      20   0   16760   3100   2328 R   1.0  0.0   0:00.20 top
7959 root      20   0       0      0      0 S   0.7  0.0  34:56.63 vhost-7956
    7 root      20   0       0      0      0 S   0.3  0.0   9:08.15 rcu_preempt
2558 root      20   0    9684   2576   2124 S   0.3  0.0  12:57.14 cpuload
19971 nobody    20   0 5848452 301296   4212 S   0.3  0.9   1:11.33 java
20457 nobody    20   0  500920 155172   3848 S   0.3  0.5   1:18.91 mysqld
21007 nobody    20   0 3395164  61004   3568 S   0.3  0.2   0:47.48 python
21151 nobody    20   0 1936056  21472   1708 S   0.3  0.1   1:25.06 kodi.bin
    1 root      20   0    4372   1548   1440 S   0.0  0.0   0:07.54 init
    2 root      20   0       0      0      0 S   0.0  0.0   0:00.02 kthreadd
    5 root       0 -20       0      0      0 S   0.0  0.0   0:00.00 kworker/0:+
    8 root      20   0       0      0      0 S   0.0  0.0   0:00.00 rcu_sched
    9 root      20   0       0      0      0 S   0.0  0.0   0:00.01 rcu_bh
   10 root      rt   0       0      0      0 S   0.0  0.0   0:01.38 migration/0
   11 root      rt   0       0      0      0 S   0.0  0.0   0:01.73 migration/1
   12 root      20   0       0      0      0 S   0.0  0.0   0:23.63 ksoftirqd/1
   13 root      20   0       0      0      0 S   0.0  0.0   0:00.00 kworker/1:0
   14 root       0 -20       0      0      0 S   0.0  0.0   0:00.00 kworker/1:+
   15 root      rt   0       0      0      0 S   0.0  0.0   0:01.58 migration/2
   16 root      20   0       0      0      0 S   0.0  0.0   2:14.49 ksoftirqd/2
   19 root      rt   0       0      0      0 S   0.0  0.0   0:01.60 migration/3
   20 root      20   0       0      0      0 S   0.0  0.0   1:04.77 ksoftirqd/3
   22 root       0 -20       0      0      0 S   0.0  0.0   0:00.00 kworker/3:+
   23 root      rt   0       0      0      0 S   0.0  0.0   0:01.36 migration/4
   24 root      20   0       0      0      0 S   0.0  0.0   1:05.02 ksoftirqd/4
   25 root      20   0       0      0      0 S   0.0  0.0   0:00.00 kworker/4:0
   26 root       0 -20       0      0      0 S   0.0  0.0   0:00.00 kworker/4:+
   27 root      rt   0       0      0      0 S   0.0  0.0   0:01.49 migration/5
   28 root      20   0       0      0      0 S   0.0  0.0   1:04.93 ksoftirqd/5
   30 root       0 -20       0      0      0 S   0.0  0.0   0:00.00 kworker/5:+
   31 root      rt   0       0      0      0 S   0.0  0.0   0:02.65 migration/6
   32 root      20   0       0      0      0 S   0.0  0.0   1:32.13 ksoftirqd/6
   33 root      20   0       0      0      0 S   0.0  0.0   0:00.00 kworker/6:0
   35 root      rt   0       0      0      0 S   0.0  0.0   0:02.00 migration/7
   36 root      20   0       0      0      0 S   0.0  0.0   0:10.35 ksoftirqd/7
   37 root      20   0       0      0      0 S   0.0  0.0   0:00.00 kworker/7:0
   38 root       0 -20       0      0      0 S   0.0  0.0   0:00.00 kworker/7:+
   39 root      rt   0       0      0      0 S   0.0  0.0   0:02.86 migration/8
   40 root      20   0       0      0      0 S   0.0  0.0   1:10.84 ksoftirqd/8
So what's the verdict? It looks to me like 1/2 of it ran away.. IDK.
I have a replacement MB arriving soon that I plan to swap over to which will (hopefully) fix all the issues that I'v been experiencing.
-
If its a case of a simple one liner, just make a user script for it and use the user scripts plugin.You can actually save a VM from the command line which works great! Just a real pain and inconvenience to have to keep running commands. All they need to do here is add it into the menu system and simply run the commands in the background. I haven't tested this with snapshots yet but it's probably already possible via the cli as well.... the command to save a VM is "virsh "domainname" /pathtofile/filename.vmsave" to restore its simply "virsh restore /pathtofilename/filename.vmsave"...
that sounds like a really easy plugin to build for the time being.
I recall JonP stating that in their testing (LT) the snapshotting function was not reliable at this time (within its implementation in UnRAID), and hence why the ability hasn't been added.
So if you run it 10 times, and only 8 of them were properly stored it kind of makes this a questionable feature to add until more work can be done to properly support it.
-
Please provide a diagnostics output so that we can better help you resolve the issue.
-
I've read at least one report of QXL not working with Windows 7, and needing to select one of the different video options.
I would try that, and if that doesn't help, a different version of Virtio drivers is likely the next step.
Are you installing them as directed from the wiki?
The recommended order is defined in step 5 here http://lime-technology.com/wiki/index.php/UnRAID_6/VM_Management#Physical_to_Virtual_Machine_Conversion
-
Do you get the same message if you navigate by IP address instead of by name?
I have been prompted for login by name, then went to address and all worked as expected.
Then of course over time, browsing by name worked as expected..

-
1st question, have you ran Memtest for at least one complete pass?
Most will recommend 24 hours, which I believe to be a bit excessive however a couple of passes, 8 hours or so should rule out an issue.
2nd, any BIOS updates for your board?
-
By Jove Man! That's got it!
Quit talking funny...
Glad it helped!
The DPI/font size thing really helps in looking for a solution.
Not sure yet on how to solve it, but at least I know how to approach the issue.
Is there a way to program this to dynamically resize based on DPI/resolution?
If so while I'd assume it would be a pain, it would likely resolve any further issues that may crop up from variations within Android phones (which as we know has quite the variety).
-
Odd, as my nexus 6 has the same resolution (2560x1440) and I don't have this issue either. Maybe it is related to the DPI setting by default on your phone?
-
xfs is much better for running VMs than btrfs.
Do you have any sources or information to back this statement?
I'm genuinely curious, but also have my doubts to the validity of the recommendation.


 It just happened to popup while I had it loaded, so figured I'd report it.

alloc_bts_buffer: BTS buffer allocation failure-page allocation failure: order:4
in General Support
Posted
Called in the big guns huh?!
Let me take a look once I get home this evening, the only difference between this and my previous board was that above 4g decoding had to be disabled on the Gigabyte board or it reverted to BIOS default settings (no idea why), so it was always set to off.
On the SuperMicro I have now I was able to enable it (even though supposedly only useful for Grid or fancy CUDA cards or something of that nature), and pass all related Memtest's with it on, so I left it that way.
Will have all the information you can shake a stick at this evening.