sizo
Members
-
Joined
-
Last visited
-
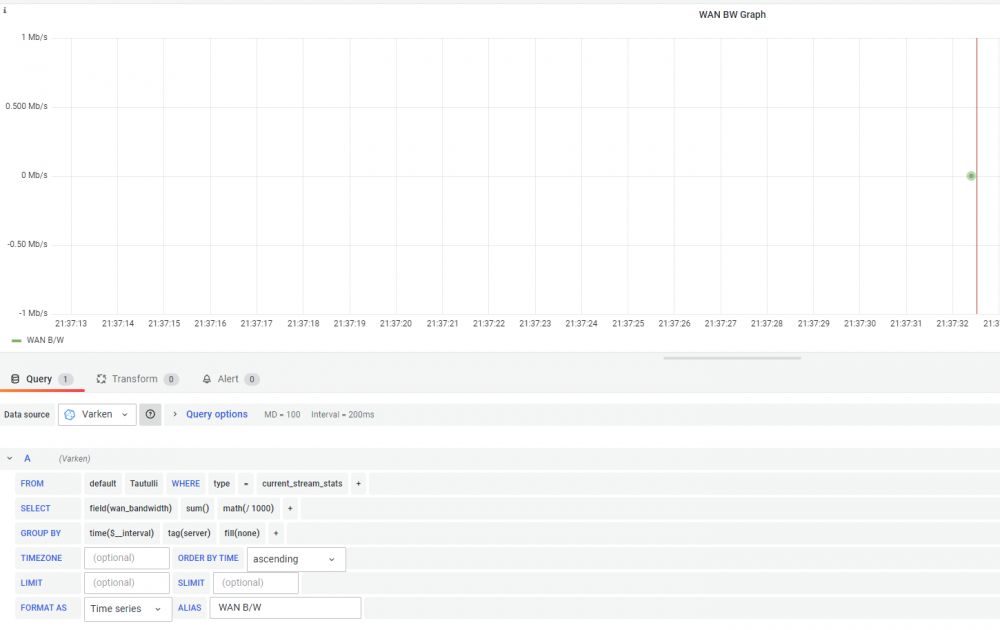
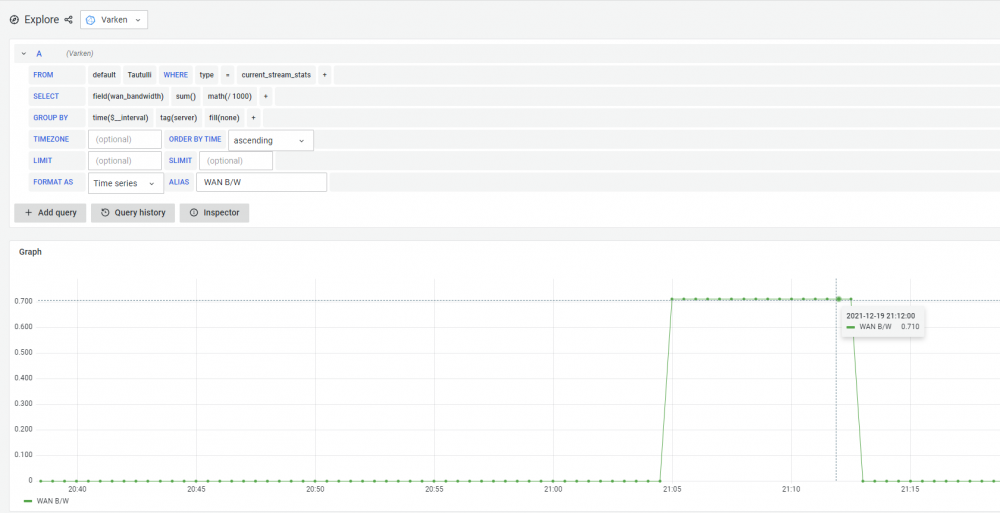
Hello everyone! Apologies for the lack of knowledge around this post, I'm new to the world of Grafana/Telegraf etc.! I was hoping to be able to plot the WAN bandwidth details from Tautulli into something similar to that of the Plex Pass bandwidth graph. However I can only seem to get it to plot once on a graph or as a single row in a table. If i "explore" the graph i created it displays the values as I'm trying to get them to appear on the graph. i just have no idea how to do it! Any help would be much appreciated please! Thanks
-
tried this again but for some unknown reason this time it works!! Thanks for all the help!
-
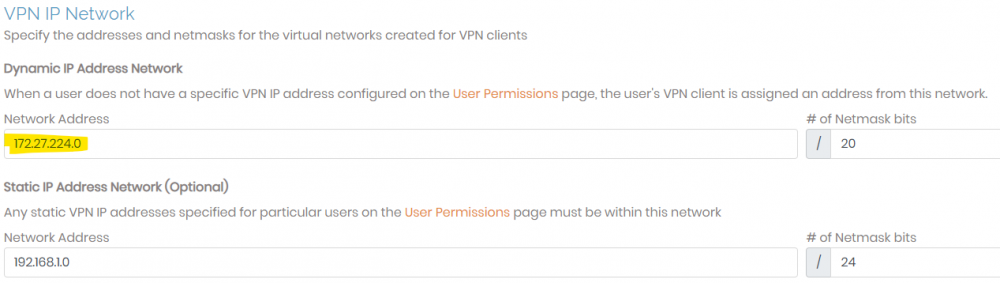
I've been keeping an eye on this thread since the updates but I can't seem to find an answer for my issue. For some reason openvpn keeps pulling the docker ip address range through on eth0 (172.x.x.x) when I'm using a 192.168.1.x range. When I connect via the openvpn app on my mobile I'm dished out a 172.x.x.x address. I can use a static 192.168.1.x address via vpn settings on the openvpn web GUI, which is then used in the openvpn app on my mobile, but I can't access the unraid GUI or sabnzbz/sonarr/radarr. All worked perfectly before the later releases but I'm stumped! Any help would be much appreciated. Thanks! Update If i amend the Dynamic IP Address Network from 172.x.x.x to 192.168.1.0/24 I can't connect back to the openvpn webgui but i do get a 192.168.1.x address in the mobile app. However I still cant connect to the unraid GUI or any services (all on the same 192.168.1.x subnet).