





BinAdhed
Members
-
Joined
-
Last visited
-
I still did not get to the step by step guide, but it should be easy to get around, what you need to do is first have the app scan the network, it will use nmap built in, once that is done, you can have the Ai (that you connect) analyze your setup. the point of Ai is after filling up your network, hosts, services etc, the Ai can give you better insight.
-
CHANGELOG & UPDATES (v0.7.0 – v0.17.0) It's been a big few months since the v0.6.2 port change. Here's everything that's new, grouped by area, with a full version list at the bottom. ── MONITORING & UPTIME ────────────────────────────── - Service uptime monitor: per-service up/down checks (HTTP or TCP) with ntfy alerts, a grace period, quiet hours, and uptime history. - Host liveness: a light ping sweep marks every host online/offline, tracks per-host uptime, and correlates service outages to a down host (so one offline server doesn't fire a flood of service alerts). - Configurable probe interval (15–600s) and a per-service "reset uptime". ── SCANNING ───────────────────────────────────────── - Configurable scan engine + reusable scan profiles (Quick/Standard/Full + custom). - Scan scheduler with active-hours windows, plus live probe progress. - Change tracking & alerts: records what each scan finds different (new hosts, opened/closed ports, MAC/hostname changes) with per-scan summaries and a daily digest; alert scoping by static/dynamic and per-host opt-outs. - Timezone-aware scheduling, quiet hours, and digests. ── PUBLIC STATUS PAGE (new, separate app) ─────────── - Push a sanitized status summary to a separate, internet-facing page — public names and up/down only, never internal IPs. Ships as a prebuilt image. - Public/private section gating with a hardened admin login, announcements, and a recurring maintenance calendar. - Full branding (name, logo, colors), configurable uptime windows (1h / 24h / 7d / 30d), and a per-minute "1 hour" tick bar. - Incident timeline (down -> back -> duration), and automated-maintenance windows that relabel expected dips (e.g. nightly backups) as amber "Scheduled maintenance" instead of red — the downtime still counts, only the cause is labelled. Plus a "clear past incidents" control. ── AI ASSISTANT ───────────────────────────────────── - The assistant is now live-network-aware: it knows what's down right now, recent changes, and outage/flapping patterns — and it streams responses. - Still optional and provider-agnostic: Ollama (local), any OpenAI-compatible API, or Anthropic. ── UI / QUALITY OF LIFE ───────────────────────────── - Inline editing + column controls in the Hosts and Services tables. - Topology zoom/ESC improvements; fixed-height, drag-resizable detail panels. - Factory reset, bulk delete, and an accordion settings panel. - Editable host IP; restore now migrates backups from older versions. ── UPGRADE NOTES ──────────────────────────────────── - Deployment is now a single docker-compose.yml, and host networking is the default so nmap can actually scan your LAN. On Unraid the template already sets Network Type: Host with NET_RAW/NET_ADMIN caps — leave that as-is. - The public status page runs as its own container (default port 12102) on a SEPARATE host from Boltarr — keep Boltarr off any internet-facing box. ── FULL VERSION LIST ──────────────────────────────── v0.7.0 service uptime monitor + public status page v0.8.0 configurable scan engine + reusable scan profiles v0.9.0 scan scheduler, change tracking & alerts, host liveness, timezone v0.10.0 scan active windows, alert scoping, live probe progress v0.11.0 host monitoring (uptime, correlation, status page) v0.11.2 consolidated to a single docker-compose.yml v0.11.3 factory reset, bulk delete, accordion settings v0.12.0 inline editing in the Hosts table v0.13.0 inline editing in the Services table v0.14.0 reset uptime tracking v0.15.0 90-day uptime history on the status page v0.16.x incident timeline, configurable uptime windows, configurable probe interval + 1h tick, automated-maintenance windows, clear incidents v0.17.0 AI assistant is now live-network-aware, with streaming Docs & full guide: https://github.com/brq-ae/boltarr/wiki As always, post here for support, bug reports, or feature requests.
-
Boltarr is a self-hosted network dashboard for mapping, monitoring, and analyzing your local network — all on your own hardware, no cloud. GitHub: https://github.com/brq-ae/boltarr Docker Hub: https://hub.docker.com/r/brqae/boltarr Wiki/Docs: https://github.com/brq-ae/boltarr/wiki WHAT IT DOES - Discovery & scanning: nmap-powered host/port discovery with reusable scan profiles and a scheduler (interval or weekdays, with active-hours windows). - Change tracking & alerts: records what changed between scans (new hosts, opened/closed ports, MAC/hostname changes) with ntfy push notifications and a daily digest. - Uptime monitoring: host liveness (online/offline) plus per-service up/down checks with alerts, grace periods, quiet hours, and uptime history — with host<->service correlation so one down box doesn't flood you with alerts. - Topology: interactive graph with VLAN coloring and connection types (wired/wifi/fiber/DAC/virtual). - Device & service management: add/edit inline, merge multi-homed devices, DHCP-aware static/dynamic classification, notes, and SSH key management. - Public status page: push a sanitized status summary (public names + up/down, never internal IPs) to a separate, internet-facing page — with public/private gating, branding, announcements, a maintenance calendar, an incident timeline, and automated-maintenance windows. - AI assistant (optional): live-network-aware and streaming — ask what's down, what changed, or what's been flapping. Works with Ollama (local), any OpenAI-compatible API, or Anthropic. Fully optional; Boltarr works without it. INSTALL - Unraid: Community Applications — search "boltarr" (or add the template URL from the GitHub readme). The template uses Network Type: Host with NET_RAW/NET_ADMIN caps so nmap can scan your LAN — leave that as-is. - Docker: a single docker-compose.yml (host networking by default). See the readme/wiki. Your data stays local (a small SQLite database + config file). Open source under Apache-2.0. Post here for support, bug reports, or feature requests.
-
would the macvlan still be an issue even if I don't use vlan at all? thanks for the answer, yeah i meant the iGPU. so my assumption was wrong. I will change to ipvlan now and hopefully report back in a week or so of it going with no hiccups. Thanks Jorge you helped a lot.
-
syslog attached, I have an assumption and might be wrong but do I need to retype the command from the release notes after every restart? is that command not permanent? syslog
-
Unfortunately, the system decided to freeze today while I was doing a parity sync. All I did was, stop array, shutdown, insert new HDDs, start server, replace old parity drive with new, start array. It was going good, and last time I checked it said 13 hours remaining, only to find out later that the server is not responding again. What should I do in this case? I think log is still enabled on flash drive, should I attach the file?
-
happy to report that the system been up and running with no issues until now. thanks
-
Thank you for that. I ran the command and will report back if it does crash again.
-
Thanks will do and see what happens, may I ask where or how do you know it is an issue related to i915 Driver? I want to learn more about diagnosing / troubleshooting on my own. Ill report back if any crash happens after doing what is mentioned in the release notes.
-
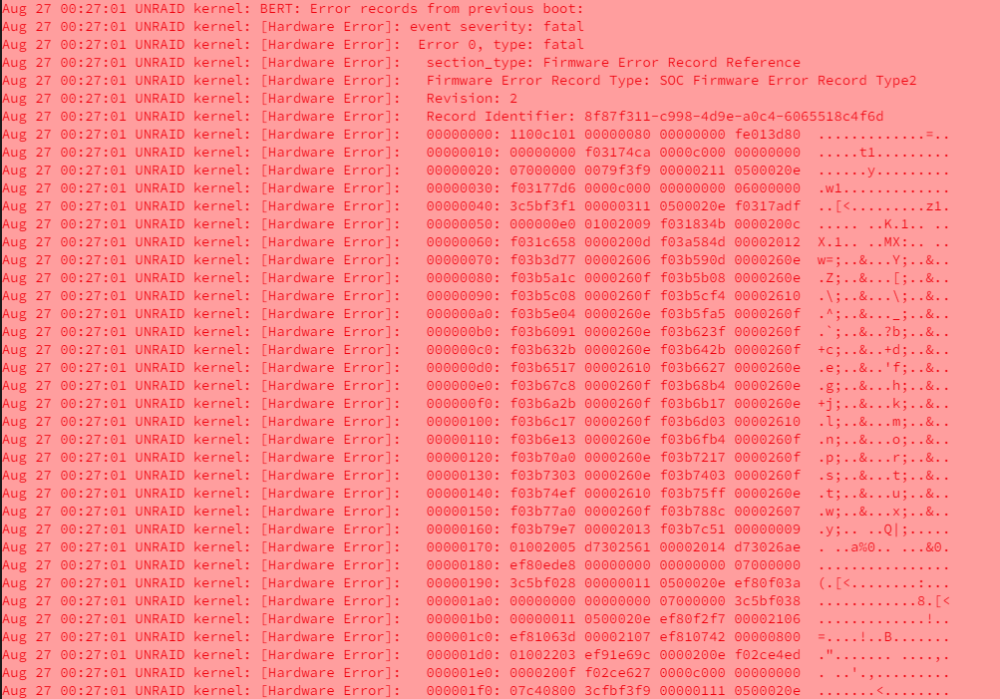
Good day people, I was running on 6.11 (can't remember which version exactly) I recently decided to change my server chassis from Rosewill RSV-R4000U to RSV-L4412U, for swapping disks if ever needed since I was nearing 2 years of current HDD use, then I thought, new chassis, why not upgrade to Unraid 6.12.3 ? And so I did some research, tried to look for anything that I have to be aware of, but in the sea of information it was hard to find anything indicative of any failures and everything I read kept indicating that upgrading to 6.12 was a breeze and there will be no issues. and so I did, and now I regret, first issue was unraid didn't want to boot at all after the upgrade, I kept getting hardware error messages ( that I still get until now - attached below ) at boot, it was very hard to capture, because the moment that screen comes up, it would go blank about one second later and the system would just freeze, I had to long press the power button to get it back, but that happened more than once and I wasn't comfortable doing that so I decided to keep it powered down, and I just removed all disks then went online to try to find out the cause but it was really hard to pin point the issue. I got a new USB dongle, I restored a backup from unraid connect, and still the same then I read somewhere online that unraid now can run using UEFI so I did try that and viola it doesn't throw a lot of errors and when it gets stuck the screen doesn't go blank or lose signal, then I decided to start in safe mode, and thankfully it did end up booting in safe mode and I can see my settings are intact, I read online to disable plugins and so I did and installed 4 plugins ( Unassigned Devices, CA, Dynamix System Temperature and Unraid Connect) , and then I restarted the server and it booted back normally and I started the array and all was well, until it froze some few hours later. So I decided to do a fresh install and then move the config files back to the new install maybe that would change the outcome or so I thought. I continued reading online anyways and I found something about macvlan vs ipvlan, I tried to find such an option on unraid on how to disable it but couldn't find it, so I just stopped using that one container that used a vlan setting, (And after this post I will remove vlan altogether from the Interface in network settings within unraid), rebooted and the server stayed up for 3 days all good until today when it also decided to freeze. I have no clue why it does freeze but here is what I already did, I enabled syslog mirroring and I will attach it hopefully something useful would come out of it, I have no clue how to read the syslog, can't understand it even though I tried, I only saw one pattern which doesn't make sense but it kept saying error and throwing the PID to CPU 3, not sure if this is something related or not. I also attached diagnostics of after the crash. even though I can ping the server, I cannot enter the GUI, the monitor has no signal so I will restart the server now, I will run a memtest. The hardware is the same, I only added an HBA (DELL H310 6Gbps SAS HBA FW:P20 9211-8i IT Mode ) to be able to actually use more HDDs. Also now I am using a PiKVM V3, so I switch from the KVM Screen HDMI to the PiKVM when I leave home for a long period ( like when I did 3 days ago and only came today to find the server frozen although I did use a VM for cloud gaming around 4 hours before the crash ) At the moment the PC specs are as follows Intel i7 11700 32GB DDR4 Ram (Corsair LPX) Asus H570 Pro Motherboard RTX 2060 Super (passed through for VMs) with a fake HDMI dongle attached 3 Seagate ironwolf nas hdds as parity and 2 data disks 8TB each 1tb nvme drive passed through for a VM 1tb SSD share 240gb ssd share 850W platinum PSU looking forward for help. and thanks in advance. syslog unraid-diagnostics-20230827-0047.zip
-
for anyone facing the same issue, what I did to fix this is to use VLANs. everything is still the same, I just changed the CCTV from a different subnet to instead have a VLAN tag nothing else and now plex shows the right IP address. thank you everyone for helping
-
apologies, I am actually using host not bridge, I probably said that because I tried setting to bridge and the issue didn't resolve, but yeah it is host and that is what made freak out when I was trying to solve this when I saw that even though it's set to host, plex says it is pointing to the other IP. either way I will virtualize unraid, I think that will make things much easier and cleaner. Thank you for the reply though I appreciate your time.
-
bridge network of unraid network on eth0, that is what I set originally and never changed or altered. But plex on docker page shows port assignment as question marks instead of 32400. in the web interface it points to the bridge of the other active ethernet port, I'm away from the server at the moment but I think it was eth4. in the network page I already set eth0 as default. so I'm still trying to figure out the issue. Everything works but sometimes the application does not work as expected and is slow to load but from the web everything seems fine even though it points to the wrong bridge
-
I hope this post isn't being ignored. until now everything is pointing me towards virtualizing unraid and just use it as a NAS and use proxmox for everything else, from my understanding unraid doesn't like working with more than one interface.
-
Good day good people, I am using unraid version 6.10.3 I have two issues that are annoying, and probably causing me some issues with plex remote access. Inside plex, in the remote access page, it shows the default host IP of my NIC im using for CCTV (192.168.99.2) the host ip (192.168.52.2) on eth0 (not named eth0 instead br0, in the logs it keeps changing names) which I already set in both plex options in the app itself and within the container settings on docker page, but it still uses the other IP mentioned above so it is causing plex apps outside the network not to connect, only the web based plex works when I access from outside the network. so the second issue might also be the same as the first, in the logs, and in pfsense I keep seeing logs of shim-br0 trying to hijack eth0 ip, and it goes back and forth every few seconds at times. I am not so sure how to reset these settings without breaking something, I've been using unraid only for one year which is when I started my homelab journey. I hope that there is nothing that I am missing, I tried to look everywhere, but couldn't find anything in regards to plex issue and default IP of NIC being used as Host for plex container. Thanks! unraid-diagnostics-20220911-2207.zip

