Rubene
Members
-
Joined
-
Last visited
-
First parity check finished with 732564000 errors, second did indeed finish with 0. All seems to be good now
-
Right, did not know that. Thanks!
-
I will! And thanks for confirming it's a known bug. Upgrading it is long overdue already. I’ve had some hesitation around it, which made me procrastinate a bit, but since I’m changing quite a lot already, this seems like the right time :)
-
It was the data drive that failed, not the parity. During the first replacement, I had: 5 TB parity drive (healthy) Failed 5 TB data disk New 8 TB disk available That would make the replacement data disk larger than the existing parity, which cannot. So I started with the parity swap procedure: use the 8 TB as parity, rebuild the failed data disk onto the old parity disk. And then I started rearranging the disks around to add another new 8TB disk. So quite a lot changed compared to original setup, that's why I needed a quick sanity check when I saw the parity errors... Only a new config would not have worked in this case, correct?
-
Thanks, that matches what I was suspecting. I'll let the current check finish and then run a second parity check which then should return 0 errors. I'll hold off with moving data around until that finished.
-
Hi all, I want to sanity-check whether what I’m seeing is expected or if I made a mistake. My original setup was: 1 parity disk: 5 TB 1 data disk in slot 1: 5 TB The 5 TB data disk failed after a power loss (both are old already, was about to happen at some point). Bought two new 8 TB disks to replace these disks (not at the same time, first the failed data disk). Data disks cannot be larger than parity, so I did the parity swap procedure: Assigned the new 8 TB disk to parity 1 Assigned the old parity drive to the data slot of the failed data drive (slot 1) Copied the parity information over The new 8 TB disk became parity Started array and data was rebuilt on the old parity disk which became data disk Completed without errors and the data is as expected. After that, I wanted to add the second new 8 TB disk to the array. It will replace the old 5 TB drive for critical data, the 5 TB disk will still be there but for non critical data until failure. For that reason, I wanted to rearrange the data disks: new 8 TB is slot 1, old 5 TB slot 2: Created new config Moved the 5 TB data disk from slot 1 to slot 2 (still the only data disk at this point) Checked "parity is already valid" Started the array. Stopped the array. Added the new 8 TB disk to slot 1 (disk had been precleared via unraid) Started the array and formatted the new slot 1 disk as xfs-encrypted Now I’m running a parity check and seeing this: First ~5 TB: no parity errors. After the 5 TB point: lots of parity errors/corrections (17553328 already at just 5.07 TB), increases rapidly. This started after the parity check hit the 5 TB mark (and thus passing / 'completing' the 5 TB data disk in slot 2) Both new disks are 8 TB. The old rebuilt data disk is 5 TB. Remarks: The new 8 TB parity disk may not have been zeroed before use, I tested it with badblocks on another Linux machine before installing it. Data is still present and as expected I have not formatted or changed the rebuilt 5 TB data disk. Although the new 8 TB data disk has been added to the array, it is still empty. No data on it yet. All disks (especially the old one) seem healthy I'm running an older unRAID version (6.10.3), upgrading is next on the list My current theory is that the 5–8 TB region of the new 8 TB parity disk may not have been initialized correctly during/after the parity swap, and only started mattering once I added the new 8 TB data disk. Since the first 5 TB checks clean, I’m hoping the rebuilt 5 TB data is ok and the corrections are only for the expanded region. Does this make sense? Should I let the correcting parity check finish, then run a second non-correcting parity check to confirm zero errors? tower-diagnostics-20260528-0646.zip
-
@Emilio Unfortunately not. Nextcloud already didn't quite meet my needs and with these problems added, I switched to just shared network volumes. Problem did not occur again, so it was definitely related to the Nextcloud docker container. But absolutely no idea what the reason may have been.
-
Same issue here suddenly since yesterday. I'm on 6.8.3 since it got released, never seen this issue before. Curious what triggered this. /etc/rc.d/rc.nginx restart seems like to fix it for now.
-
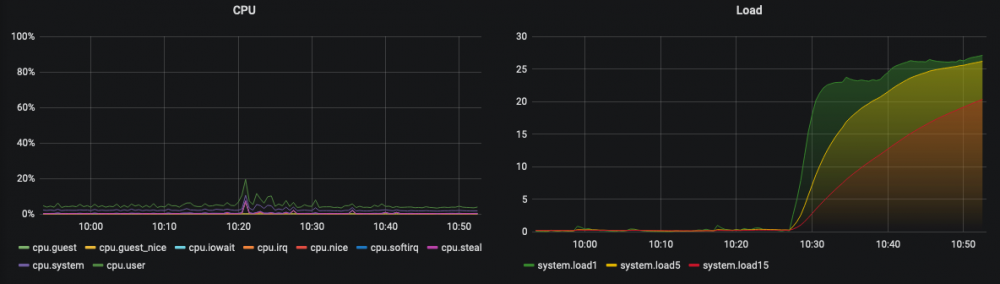
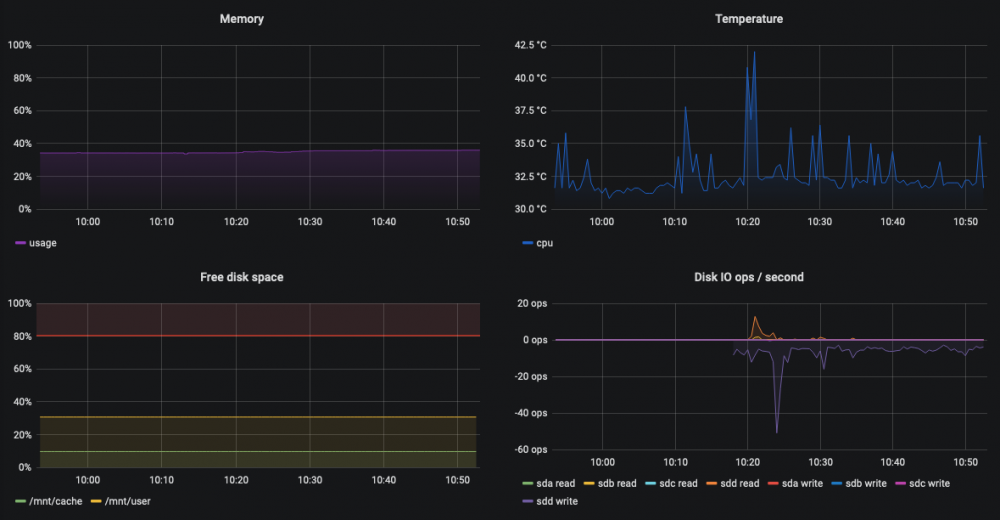
Indeed, looks like it has something to do with IO. But I don't suspect the disks. The appdata folder is located on the cache drive. The 2 hard drives were both asleep. Also the cache drive had barely any ops (see also the screenshot in my first post). I suspect it has something to do with network. There I see the most correlation, but i'm not entirely sure yet.
-
Today I had the issue again around 11.51. Syslog shows nothing special: May 3 10:38:37 Tower emhttpd: shcmd (77895): /etc/rc.d/rc.samba restart May 3 10:38:40 Tower root: Starting Samba: /usr/sbin/smbd -D May 3 10:38:40 Tower root: /usr/sbin/nmbd -D May 3 10:38:40 Tower root: /usr/sbin/wsdd May 3 10:38:40 Tower root: /usr/sbin/winbindd -D May 3 10:38:40 Tower emhttpd: shcmd (77904): smbcontrol smbd close-share 'x' May 3 10:55:13 Tower kernel: mdcmd (294): spindown 0 May 3 10:55:14 Tower kernel: mdcmd (295): spindown 1 May 3 12:02:59 Tower kernel: veth0d8fa17: renamed from eth0 May 3 12:02:59 Tower kernel: docker0: port 1(vethb96c1c0) entered disabled state --- Restarted a docker container May 3 12:02:59 Tower kernel: docker0: port 1(vethb96c1c0) entered disabled state May 3 12:02:59 Tower kernel: device vethb96c1c0 left promiscuous mode May 3 12:02:59 Tower kernel: docker0: port 1(vethb96c1c0) entered disabled state Again Nextcloud was not responding. Not able to stop / kill that particular container (other contains are able to stop/start). Managed to forcefully stop docker with /etc/rc.d/rc.docker force_stop but the load was still there. Looking at top and ps I noticed there were quite some php-fpm processes in the D state ("uninterruptible sleep (usually IO)"). No way of stopping these. Nextcloud uses php-fpm but I expect these processes are gone when the container is no longer running. Also netdata was running. The only correlation I see is an increased amount of TCP sockets, higher number of ipv4 UDP errors, ipv6 packets and errors. Issue is still very vague to me. Does anyone have any idea what this could be?
-
Thanks! Just did that. I was able to copy everything from Tools -> System log. But nothing around the time it started (10:27). At 11:31 I tried to stop the array. Apr 6 06:00:15 Tower root: /var/lib/docker: 18.9 GiB (20290076672 bytes) trimmed on /dev/loop2 Apr 6 06:00:15 Tower root: /mnt/cache: 217.2 GiB (233194831872 bytes) trimmed on /dev/mapper/sdd1 Apr 6 08:00:32 Tower kernel: mdcmd (62): spindown 0 Apr 6 08:00:33 Tower kernel: mdcmd (63): spindown 1 Apr 6 10:38:14 Tower webGUI: Successful login user root from 172.18.0.18 Apr 6 10:38:36 Tower login[24621]: ROOT LOGIN on '/dev/pts/0' Apr 6 10:39:38 Tower kernel: mdcmd (64): spindown 0 Apr 6 10:40:21 Tower nginx: 2020/04/06 10:40:21 [error] 10155#10155: *438771 upstream timed out (110: Connection timed out) while reading response header from upstream, client: 172.18.0.18, server: , request: "POST /webGui/include/Download.php HTTP/1.1", upstream: "fastcgi://unix:/var/run/php5-fpm.sock", host: "unraid.xxx.com", referrer: "https://unraid.xxx.com/Tools/Diagnostics" Apr 6 10:41:24 Tower kernel: mdcmd (65): spindown 1 Apr 6 11:31:29 Tower webGUI: Successful login user root from 192.168.2.55 Apr 6 11:31:39 Tower kernel: mdcmd (66): nocheck cancel Apr 6 11:31:40 Tower emhttpd: Spinning up all drives... Apr 6 11:31:40 Tower emhttpd: shcmd (8973): /usr/sbin/hdparm -S0 /dev/sdd Apr 6 11:31:40 Tower kernel: mdcmd (67): spinup 0 Apr 6 11:31:40 Tower kernel: mdcmd (68): spinup 1 Apr 6 11:31:40 Tower root: Apr 6 11:31:40 Tower root: /dev/sdd: Apr 6 11:31:40 Tower root: setting standby to 0 (off) Apr 6 11:31:45 Tower emhttpd: Stopping services... Apr 6 11:31:45 Tower root: Stopping docker_load Apr 6 11:31:46 Tower emhttpd: shcmd (8977): /etc/rc.d/rc.docker stop Apr 6 11:31:46 Tower kernel: br-b2a3f6552968: port 8(veth4088f17) entered disabled state
-
Hi, This is the fourth time this happened on my server: This has multiple impacts: - I cannot access certain Docker containers anymore (Nextcloud e.g.), but most of them are still running fine (all behind Traefik as reverse proxy). - Stopping (also forced), restarting, creating, deleting of Docker containers is no longer possible. Not via the GUI, terminal or Portainer. Commands are hanging. - Creating a diagnostics file is no longer possible. Not via GUI or terminal. - Stopping array is not possible anymore (hangs, think because docker is not responding) The only way to solve this is a (unclean) reboot. I think it is related to Nextcloud. All four times I was doing something with Nextcloud (altough Nextcloud is used often, so why only these four times?). Also since Nextcloud is not accessible anymore (gateway timeout). My guess is that it is network related, or could it be something else? And how to verify that? Like I said, its impossible to get a diagnostics report. I'm currently on 6.8.3, but happened also on 6.8.1. Some more graphs: Thanks!