


xBotRaid
Members
-
Joined
-
Last visited
-
For all future readers: So! After a while I can confidently say the issue is gone. Current uptime 11 days. Now as to what was the issue was exactly I cannot say for sure, since I got rid of some plugins after all, which I didn't need. But I have a strong suspicion, that the ultimate solution was as simple as disabling the c-states (and checking that the RAM is running at the correct speed, as suggested by JorgeB's guide. This since my current config, which lasted 11 days pretty much identical to the previous setup. The only differences being some uninstalled plugins, a re-flashing of Unraid and the removal of some plugins. Additionally I came across the RTL8168 Drivers from community applications, which I also installed, however I has worked reliably for 3 days without I too. Otherwise, same Hardware, Docker Containers and with neither pcie_aspm=off nor pci=noaer. So if anyone else comes across this issue, I would recommend you to: Follow JorgeB's guide on finding the correct RAM speed and disabling the c-states. Additionally, it makes sense to install the RTL Drivers (pick the right one for your system). If all that doesn't resolve the issue, try setting pcie_aspm=off or pci=noaer. Thanks for all the help along the way! Hope this helps if someone else has the same issue.
-
Update: Hopefully last update... 😅 After completely removing everything, except the essential parts, I still got the issue. Now however I found the same error in the syslog as detailed here. I disabled c-states and now I'm checking, with all the hardware, how long it will be up. Wish me luck! I hope this was the issue, could very well be a different issue I produced after resetting the motherboard however.
-
Hi, thanks for your input! Still find it kinda crazy it reboots so quickly, but ok. If the problem is hardware, are there any tips (or best guesses) on how to figure out where in hardware the problem could lie? (don't have the funds or spare parts to replace the whole server ;D) Bonus: Attached a tailscale diagnostics I had back when I was still using your plugin. Figured I might put it in here as well, if you need it to debug. Although for me doesn't matter since I don't use it anymore right now. But: Really cool plugin btw! RaidByte-tailscale-diag-20240329-085341.zip
-
My hope was short-lived... The server just crashed again within a few hours. But this time, completely differently and weirdly, which confuses me even more. I definitely need your advice on that one, since that's making no sense to me - at all. What happened? As I was setting up some stuff in HomeAssistant, one second later it didn't respond anymore. So I checked my Unraid dashboard (within 30 seconds), there it was up and running, but now displaying "Uptime 1 minutes", I went to the docker containers and it had the warning that they were still booting up. So within a minute my system went from "all docker containers up and running just fine, more than 1h uptime" to "1 min uptime, docker containers are still starting up". How's that even possible? If the system really crashed, it would need to boot up first again, and that usually takes like 5 minutes until I can first access the dashboard, now it was more like 30 seconds. First I thought I was crazy, however then it happened again. I was deleting some old docker containers, suddenly the UI didn't respond for like 10 seconds. Then I refreshed and again it said "Uptime 1 minutes" (maybe also 0, not sure) and the docker containers were starting again. How can that happen, that it crashes and then recovers in just about 15 seconds? Two more interesting observations: For the second crash, or whatever that was, I took a diagnostic before (...-2023) and after (...-2148). When comparing the syslog.txt in the before with the syslog-previous.txt in the after, they are obviously identical to the first few lines. But the only difference in fact, is just one line, and that's me logging into the webGUI. Thus nothing during the crash or shortly before has been logged by the syslog-server. I've noticed, between the different crashes the timezone (which should be CET, e.g. UTC+1) was always different, so the hour was wrong, but the minutes are correct. In the log of the first crash (...-1938) there's a "ntpd[1464]: kernel reports TIME_ERROR: 0x41: Clock Unsynchronized" error. According to the only result on this I found from another Unraid forum this can be ignored and happens on every startup, this however was once during boot up and once after all the docker containers booted up. That's all I have. Attached is: First Crash Diagnostic (...-1938.zip, raidbyte-diagnostics-20240329-1938.zip) BEFORE: Second Crash Diagnostic (...-2023, raidbyte-diagnostics-20240329-2023.zip) AFTER: Second Crash Diagnostic (...-2148, raidbyte-diagnostics-20240329-2148.zip) Thanks again for your help! I bought you a coffee/beer for your great help so far!
-
I had some success (I think), since my server worked just fine for 3 days (before lasted only <2 days). Then I decided to install the Tailscale Plugin. And shortly after the webGUI wasn't accessible anymore (different this time anyhow, since the login was quickly accessible, but upon logging in it times out, with a reload landing back at the login window. This can be attributed to a common problem I found listed in this plugin. However, this does not indicate that this was the problem before, since before I used the docker version. But the server worked for 3 days, so that's a good sign. I'll try seeing how it behaves now over longer time without Tailscale, don't need it necessarily anyways. Thanks for your help, will mark yours as solution. If anything unusual occurs, I'll revive this thread.
-
Ok, thanks! I'll try that. I'll keep you updated if something interesting happens.
-
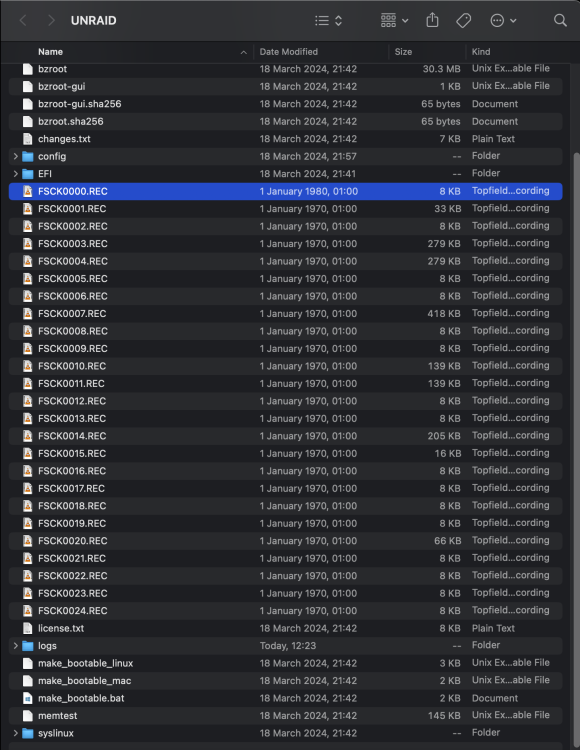
Yes, I did not know you can also post the diagnostics after reboot (with the syslog server enabled) and the syslog-previous.txt is included. What I always did so far is, before restarting, plugging in the flash drive into my laptop and retrieve the syslog (no -previous.txt or no .txt extension). I think it only gets renamed syslog-previous.txt after rebooting again. So yes, all syslogs are captured using the syslog server, directly moving the file on my flash drive to my laptop before rebooting the server. UPDATE: After it crashing again, I just tried to boot it up in safe-mode. Now it doesn't even start up anymore. It still shows the boot process via HDMI all the way to the point where I can log in using my credentials. But it's not accessible via webUI nor SSH. I tried Safe-Mode-GUI but this didn't work as it got stuck at a flashing cursor after boot-up. I attached some logs of the two previous boot attempts (syslog is the newest boot and syslog-previous the one before, both taken using syslog server). I also loaded up a fresh version of unraid on another SanDisk Cruzer, this one booted up just fine. Also noticed a couple of FSCK0000.REC files on my flash drive. syslog syslog-previous
-
Yes, I already enabled the mirror to flash option. All the syslogs I posted here are taken directly from the flash drive with the "Mirror syslog to flash" feature after it crashed. Correction: The diagnostics zip file in the main post is not taken with "Mirror syslog to flash". But all the other syslogs are.
-
Same as mentioned before, after a couple days I get complete failure on all ends: WebUI not accessible Connecting via SSH times out Connecting via SMB times out When connecting via HDMI only getting a black screen Now, as opposed to before, the Docker containers are also not responding Then, after hard-reboot everything works again for about 1-2 days and then I get the same issue.
-
Restarted again, nothing seems to work. Got any idea what else this could be? (syslog attached) Thanks for your thorough help, it is greatly appreciated! syslog
-
Ok, sadly using both pcie_aspm=off and pci=noaer, didn't resolve the issues. However, I got new syslogs and noticed a new issue also present in the previous syslogs. In syslog3 (using pcie_aspm=off) I got the last few lines saying: Mar 22 15:20:19 RaidByte kernel: eth0: renamed from vetha3633d2 Mar 22 15:20:19 RaidByte kernel: IPv6: ADDRCONF(NETDEV_CHANGE): veth8d0eb2b: link becomes ready Mar 22 15:20:19 RaidByte kernel: br-cfc1bfc30214: port 1(veth8d0eb2b) entered blocking state Mar 22 15:20:19 RaidByte kernel: br-cfc1bfc30214: port 1(veth8d0eb2b) entered forwarding state Mar 22 15:20:20 RaidByte kernel: br-cfc1bfc30214: port 7(veth5e20028) entered blocking state Mar 22 15:20:20 RaidByte kernel: br-cfc1bfc30214: port 7(veth5e20028) entered disabled state Mar 22 15:20:20 RaidByte kernel: device veth5e20028 entered promiscuous mode Mar 22 15:20:23 RaidByte kernel: eth0: renamed from vethd6d954e Mar 22 15:20:23 RaidByte kernel: IPv6: ADDRCONF(NETDEV_CHANGE): veth5e20028: link becomes ready Mar 22 15:20:23 RaidByte kernel: br-cfc1bfc30214: port 7(veth5e20028) entered blocking state Mar 22 15:20:23 RaidByte kernel: br-cfc1bfc30214: port 7(veth5e20028) entered forwarding state Similarly in syslog4 (using pci=noaer): Mar 23 03:53:15 RaidByte kernel: eth0: renamed from veth7fb01b6 Mar 23 03:53:15 RaidByte kernel: IPv6: ADDRCONF(NETDEV_CHANGE): vethc29b4d6: link becomes ready ... Mar 23 04:13:54 RaidByte kernel: eth0: renamed from vethd1c1ad9 Mar 23 04:13:54 RaidByte kernel: IPv6: ADDRCONF(NETDEV_CHANGE): veth2079265: link becomes ready ... Mar 23 04:14:03 RaidByte kernel: eth0: renamed from vethf8969d6 Mar 23 04:14:03 RaidByte kernel: IPv6: ADDRCONF(NETDEV_CHANGE): vethe35ff87: link becomes ready ... Mar 23 04:14:05 RaidByte kernel: device veth1200252 entered promiscuous mode Mar 23 04:14:45 RaidByte kernel: IPv6: ADDRCONF(NETDEV_CHANGE): veth1200252: link becomes ready Mar 23 04:14:45 RaidByte kernel: br-cfc1bfc30214: port 6(veth1200252) entered blocking state Mar 23 04:14:45 RaidByte kernel: br-cfc1bfc30214: port 6(veth1200252) entered forwarding state Mar 23 04:15:01 RaidByte Docker Auto Update: Community Applications Docker Autoupdate finished Mar 23 12:28:20 RaidByte webGUI: Successful login user root from 192.168.0.54 (Note: last line) Seemingly some IPv6 address conflict, when scanning the old log files, this message is always present. Also to note: Just before the server went down at syslog3, one minute before I connected using Tailscale (setting the server as Exit Node), maybe that has something to do with it as well? Searching online didn't seem to fully understand what the problem is here. As when it comes to my network setup: I recently directly connected my server to the router by ethernet (before had to do some ugly wifi repeater stuff due to our infrastructure), this also matches up approximately when the issues started appearing. "IPv4 address assignment" is set to Automatic (so DHCP should set IP, however there is a value in "IPv4 address" I guess this gets ignored when in Automatic?) "Network protocol" is set to "IPv4 only" On my router I set the server to staticly use 192.168.0.10 Bonding is enabled with mode "active-backup (1)" with eth0 as bonding member. VLANs are disabled. So for now I'm going to set it back to pcie_aspm=off since the AER error was gone at least and hope to find a solution for these network issues. syslog3 syslog4
-
Sounds like a good idea. Thus, changes made: Set pcie_aspm=off, instead of pci=noaer and rebooted
-
Update: As said, I did a fresh install on a newly bought USB device (the popular SanDisk Cruzer Blade to be precise). Sadly, the issue occurred twice again in the last day. SSH and webUI not responding. Luckily I have some more logs (attached), however I don't know if they help. Let's break it down. First Crash (syslog1) Starts with the following message I encountered in the other syslogs as well: Mar 19 11:31:20 RaidByte kernel: pcieport 0000:00:01.3: AER: Corrected error received: 0000:00:00.0 Mar 19 11:31:20 RaidByte kernel: pcieport 0000:00:01.3: PCIe Bus Error: severity=Corrected, type=Data Link Layer, (Receiver ID) Mar 19 11:31:20 RaidByte kernel: pcieport 0000:00:01.3: device [1022:1453] error status/mask=00000040/00006000 Mar 19 11:31:20 RaidByte kernel: pcieport 0000:00:01.3: [ 6] BadTLP I read in a wiki post (german), that this is due to a bug in the AER driver, that a log message does not get deleted (even though corrected) and thus overloading the system. According to other unraid forum posts (like this one), as a workaround one can disable the advanced log messages using pci=noaer in the syslinux config. So to address this, I went ahead and set it. Let's see how it goes. Then interestingly an error only seen in this log file: Mar 19 17:59:22 RaidByte kernel: usb 7-4: USB disconnect, device number 8 Mar 19 17:59:23 RaidByte kernel: usb 7-4: new full-speed USB device number 9 using xhci_hcd Mar 19 17:59:23 RaidByte kernel: Bluetooth: hci0: HCI Read Default Erroneous Data Reporting command is advertised, but not supported. Mar 19 17:59:23 RaidByte kernel: Bluetooth: hci0: HCI Read Transmit Power Level command is advertised, but not supported. Mar 19 17:59:23 RaidByte kernel: Bluetooth: hci0: HCI LE Set Random Private Address Timeout command is advertised, but not supported. Mar 19 18:02:45 RaidByte kernel: usb 7-4: USB disconnect, device number 9 ... Mar 19 22:37:45 RaidByte kernel: usb 7-4: new full-speed USB device number 29 using xhci_hcd Mar 19 22:37:45 RaidByte kernel: usb 7-4: device descriptor read/64, error -71 Mar 19 22:37:46 RaidByte kernel: usb 7-4: device descriptor read/64, error -71 ... Mar 20 04:06:44 RaidByte kernel: br-cfc1bfc30214: port 13(veth9ef81a9) entered blocking state Mar 20 04:06:44 RaidByte kernel: br-cfc1bfc30214: port 13(veth9ef81a9) entered disabled state Mar 20 04:06:44 RaidByte kernel: device veth9ef81a9 entered promiscuous mode Mar 20 04:06:52 RaidByte kernel: eth0: renamed from veth228d9bb Mar 20 04:06:52 RaidByte kernel: IPv6: ADDRCONF(NETDEV_CHANGE): veth9ef81a9: link becomes ready Mar 20 04:06:52 RaidByte kernel: br-cfc1bfc30214: port 13(veth9ef81a9) entered blocking state Mar 20 04:06:52 RaidByte kernel: br-cfc1bfc30214: port 13(veth9ef81a9) entered forwarding state Mar 20 04:06:54 RaidByte Docker Auto Update: Community Applications Docker Autoupdate finished (Note from me: Last line of log) A lot of errors about usb 7-4 (my UGREEN Bluetooth USB dongle for the VM), I didn't encounter these before, except the `device descriptor read/64, error -71` error. I believe this was not the problem before, since I didn't see that message before. Anyhow I removed the Bluetooth Dongle to eliminate it as a probable cause of the issue. Second Crash (syslog2) Now here it gets even more confusing. It seems as if there were two SIGTERMs (power-off command), both of which I think not to have initiated. See for yourself: Mar 20 11:27:17 RaidByte emhttpd: read SMART /dev/nvme0n1 Mar 20 11:27:17 RaidByte emhttpd: read SMART /dev/sda Mar 20 11:27:18 RaidByte emhttpd: Starting services... Mar 20 11:27:18 RaidByte emhttpd: shcmd (17): /etc/rc.d/rc.samba restart Mar 20 11:27:18 RaidByte wsdd2[1771]: 'Terminated' signal received. Mar 20 11:27:18 RaidByte nmbd[1761]: [2024/03/20 11:27:18.072045, 0] ../../source3/nmbd/nmbd.c:59(terminate) Mar 20 11:27:18 RaidByte nmbd[1761]: Got SIGTERM: going down... ... Mar 20 21:00:00 RaidByte winbindd[21720]: initialize_winbindd_cache: clearing cache and re-creating with version number 2 Mar 20 21:00:00 RaidByte emhttpd: shcmd (33579): /etc/rc.d/rc.avahidaemon restart Mar 20 21:00:00 RaidByte root: Stopping Avahi mDNS/DNS-SD Daemon: stopped Mar 20 21:00:00 RaidByte avahi-daemon[7433]: Got SIGTERM, quitting. Mar 20 21:00:00 RaidByte avahi-dnsconfd[7442]: read(): EOF Mar 20 21:00:00 RaidByte avahi-daemon[7433]: Leaving mDNS multicast group on interface br0.IPv4 with address 192.168.0.10. Mar 20 21:00:00 RaidByte avahi-daemon[7433]: avahi-daemon 0.8 exiting. Mar 20 21:00:00 RaidByte root: Starting Avahi mDNS/DNS-SD Daemon: /usr/sbin/avahi-daemon -D ... Mar 20 21:01:54 RaidByte kernel: br0: port 1(bond0) entered disabled state Mar 20 21:01:54 RaidByte kernel: eth0: 0xffffc9000006d000, 2c:f0:5d:5e:84:9d, IRQ 51 Mar 20 21:01:55 RaidByte tips.and.tweaks: Tweaks Applied Mar 20 21:01:55 RaidByte unassigned.devices: Mounting 'Auto Mount' Remote Shares... (Note: Last line of log) Other than that I didn't find anything (not even an AER error). Maybe someone else can find something interesting. Changes made, to prevent future crashes: Set pci=noaer in syslinux to prevent AER error bug Unplugged Bluetooth Dongle Let's see if that helps. If you have any other ideas what the issue could be here I'd love to hear it! Thanks! syslog2 syslog1
-
Thanks a lot for the suggestion! I tried to reformat the drive and put the backup on there. This caused the webUI to not show at all (which confirms your point). Afterwards I decided to do a fresh install and bought a new USB drive. Copied some of the backup's config files on a fresh install, no problems yet. I'll mark this as solution if the issue doesn't reappear in the following days. Have a nice evening!
-
Hello! I have been running a server for over 5 years now without any major problems. Now however I face an issue which is on one hand really hard to debug since it's sporadic but also hard to evaluate what the issue is, since I have no errors or so. Let's jump right into it! Issue: Always after like 2-3 days after boot-up the system is not accessible anymore. Neither via WebUI nor SSH. However, the docker-containers still seem to work just fine. For example I can access Plex, SABnzbd or Radarr. On the other hand my Traefik is not responding, so my website is down, I can only access the services locally. Also the services seem to have trouble communicating with themselves, e.g. Radarr shows that SABnzbd is not accessible. After a hard-reboot the server is fully accessible again. However, the same problem usually occurs again after a couple days. Logs: Firstly, you can find my syslog (two actually, March 11 and 14) captured via the syslog server's feature "Mirror syslog to flash" and a diagnostics file (after reboot, since I cannot access anything) attached. Sadly I don't seem to find anything interesting inside. The logs just seem to stop at March 14 02:15:23, even though I hard-shutdown the server today on March 16 at around 15:30 (in this example I first realised the server stopped responding on March 14 at around 12:00, but didn't have time to do anything). Just to check, I also enabled the "Local syslog folder", which shows the last message and me shutting it down: Mar 14 00:48:49 RaidByte emhttpd: read SMART /dev/sdc Mar 14 01:19:01 RaidByte emhttpd: spinning down /dev/sdc Mar 14 01:19:03 RaidByte emhttpd: spinning down /dev/sde Mar 14 02:03:04 RaidByte emhttpd: read SMART /dev/sde Mar 14 02:15:23 RaidByte emhttpd: read SMART /dev/sdc Mar 16 15:35:54 RaidByte root: Delaying execution of fix common problems scan for 10 minutes Mar 16 15:35:54 RaidByte unassigned.devices: Mounting 'Auto Mount' Devices... Mar 16 15:35:54 RaidByte emhttpd: Starting services... Mar 16 15:35:54 RaidByte emhttpd: shcmd (59): /etc/rc.d/rc.samba restart Mar 16 15:35:54 RaidByte wsdd2[10426]: 'Terminated' signal received. Mar 16 15:35:54 RaidByte nmbd[10416]: [2024/03/16 15:35:54.270850, 0] ../../source3/nmbd/nmbd.c:59(terminate) Mar 16 15:35:54 RaidByte nmbd[10416]: Got SIGTERM: going down... The only suspicious thing I found was this BadTPL error one day before the logs stop. I don't know it this is related, or what it means but it seems to have been "corrected"? Mar 13 22:03:06 RaidByte emhttpd: read SMART /dev/sdb Mar 13 22:10:14 RaidByte kernel: pcieport 0000:00:01.3: AER: Corrected error received: 0000:00:00.0 Mar 13 22:10:14 RaidByte kernel: pcieport 0000:00:01.3: PCIe Bus Error: severity=Corrected, type=Data Link Layer, (Receiver ID) Mar 13 22:10:14 RaidByte kernel: pcieport 0000:00:01.3: device [1022:1453] error status/mask=00000040/00006000 Mar 13 22:10:14 RaidByte kernel: pcieport 0000:00:01.3: [ 6] BadTLP Mar 13 22:12:44 RaidByte emhttpd: read SMART /dev/sdc In the other file on March 11, there's also such an error. Additionally we can see this: Mar 11 10:28:05 RaidByte kernel: Buffer I/O error on dev sdb1, logical block 2179, lost async page write Mar 11 10:28:05 RaidByte kernel: device offline error, dev sdb, sector 4405507 op 0x0:(READ) flags 0x0 phys_seg 1 prio class 2 Mar 11 10:28:05 RaidByte kernel: FAT-fs (sdb1): unable to read inode block for updating (i_pos 70455344) Mar 11 10:28:05 RaidByte kernel: device offline error, dev sdb, sector 18884 op 0x1:(WRITE) flags 0x0 phys_seg 1 prio class 2 followed by many more of this type and just before I reboot again this: Mar 11 10:28:05 RaidByte kernel: FAT-fs (sdb1): FAT read failed (blocknr 2179) Mar 11 10:28:05 RaidByte kernel: FAT-fs (sdb1): unable to read inode block for updating (i_pos 70648355) Mar 11 10:28:05 RaidByte kernel: SQUASHFS error: Failed to read block 0x3c2c820: -5 Mar 11 10:28:05 RaidByte kernel: SQUASHFS error: Unable to read fragment cache entry [3c2c820] Mar 11 10:28:05 RaidByte kernel: SQUASHFS error: Unable to read fragment cache entry [3c2c820] Mar 11 10:28:05 RaidByte kernel: SQUASHFS error: Unable to read page, block 3c2c820, size a0ac Steps taken to try and mitigate: Hard Reboot (Problem occurs again after few days) Change USB-Port of Unraid Drive Change WebUI port from 1001 to an unused number below 1000, since I read in another forum with similar issues that one should use a port below 1000. Replug Ethernet Cable Fresh Install Switched out USB drive with freshly bought SanDisk Cruzer Blade Setting pcie_aspm=off Unplugging Bluetooth Dongle (caused some logs once) Setting pci=noaer in syslinux to prevent AER error bug Removing Tailscale Plugin Solution: Assuming it was, Disabling c-states. Setting the right RAM frequency. Both of which is explained in this guide. raidbyte-diagnostics-20240316-1610.zip syslog-mar14.log syslog-mar11.log

