freezingkiwis

Members
  • Posts

    6
  • Joined

  • Last visited

Everything posted by freezingkiwis

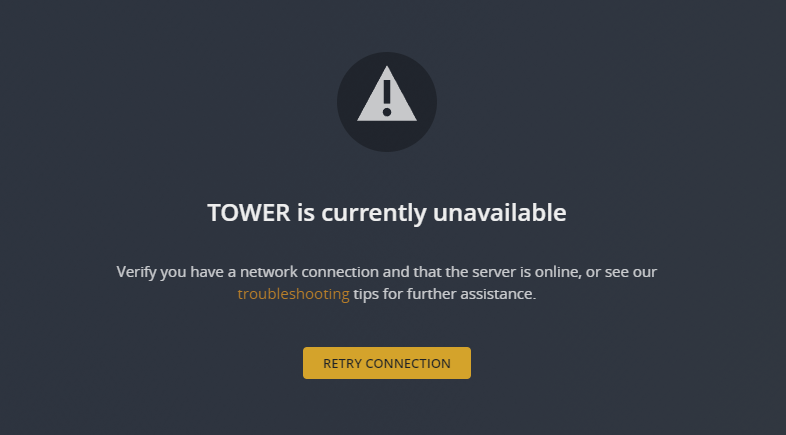
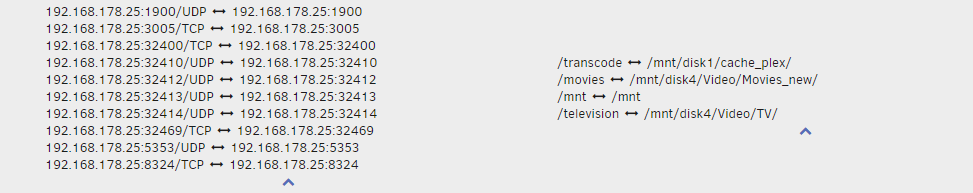
  1. So, plex-linuxserver running in Docker on Unraid. Plex found at: http://192.168.178.25:32400/web/index.html <- I can connect to this and browse it, and successfully setup my Plex server and established 3 libraries last night: Today, I'm receiving this error that TOWER is currently unavailable: This was available 12 hours ago when I set things up. I'm 100% sure that the TOWER server is available, but why is plex-linuxserver responding like this? These are my settings in the Docker container, and I feel like I'm missing something but have no idea what it should be: I've had this working successfully in the past for many many years, but recently swapped out some hard drives. One of my drives is 100% full and I'm currently in the process of moving the files to another drive, could this be causing this???
  2. OK, post reboot, diagnostics collected almost immediately "20210213-1447-after-reboot-before-ReiserFS". Parity check was started, so I allowed that to run for ~11 hours, finding no errors: Processor and RAM are nice and low, nothing in particular is happening on the server now: And I've attached diagnostics again, after all of the above "20210214-1415-after-Parity-check". I've successfully run FCP, no errors or warnings found. I can successfully connect to my server over the network, and browse all drives. I'm about to start copying some files to the server, probably will attempt all 4 drives (this server is primarily my backup), and will see how things pan out. Not expecting to run out of space on a hard drive, but should I give it a go / avoid it? Anything else I should track / tail / keep an eye out for??? tower-diagnostics-20210213-1447-after-reboot-before-ReiserFS.zip tower-diagnostics-20210214-1415-after-Parity-check.zip
  3. OK, I just browsed to the Settings page to run the FCP again, and now the UI seems to be hanging on every single page, can't load a single thing. Here's the tail of my syslog: Feb 12 21:02:53 Tower nginx: 2021/02/12 21:02:53 [error] 6029#6029: *305660 upstream timed out (110: Connection timed out) while reading response header from upstream, client: 192.168.178.60, server: , request: "POST /plugins/community.applications/scripts/notices.php HTTP/1.1", upstream: "fastcgi://unix:/var/run/php5-fpm.sock", host: "192.168.178.25", referrer: "http://192.168.178.25/Apps" Feb 12 21:02:53 Tower nginx: 2021/02/12 21:02:53 [error] 6029#6029: *305299 upstream timed out (110: Connection timed out) while reading response header from upstream, client: 192.168.178.60, server: , request: "POST /plugins/community.applications/include/exec.php HTTP/1.1", upstream: "fastcgi://unix:/var/run/php5-fpm.sock", host: "192.168.178.25", referrer: "http://192.168.178.25/Apps" Feb 12 21:07:26 Tower nginx: 2021/02/12 21:07:26 [error] 6029#6029: *305996 upstream timed out (110: Connection timed out) while reading upstream, client: 192.168.178.60, server: , request: "GET /Docker HTTP/1.1", upstream: "fastcgi://unix:/var/run/php5-fpm.sock:", host: "192.168.178.25", referrer: "http://192.168.178.25/Dashboard" Feb 12 21:14:26 Tower nginx: 2021/02/12 21:14:26 [error] 6029#6029: *306628 upstream timed out (110: Connection timed out) while reading response header from upstream, client: 192.168.178.60, server: , request: "POST /plugins/community.applications/scripts/notices.php HTTP/1.1", upstream: "fastcgi://unix:/var/run/php5-fpm.sock", host: "192.168.178.25", referrer: "http://192.168.178.25/Settings" Feb 13 03:40:01 Tower root: mover: cache not present, or only cache present Feb 13 10:10:46 Tower php-fpm[6004]: [WARNING] [pool www] server reached max_children setting (50), consider raising it Feb 13 10:10:48 Tower login[26586]: ROOT LOGIN on '/dev/pts/1' Feb 13 10:12:46 Tower nginx: 2021/02/13 10:12:46 [error] 6029#6029: *352732 upstream timed out (110: Connection timed out) while reading response header from upstream, client: 192.168.178.123, server: , request: "POST /plugins/community.applications/scripts/notices.php HTTP/1.1", upstream: "fastcgi://unix:/var/run/php5-fpm.sock", host: "192.168.178.25", referrer: "http://192.168.178.25/Dashboard" Feb 13 10:12:46 Tower nginx: 2021/02/13 10:12:46 [error] 6029#6029: *352729 upstream timed out (110: Connection timed out) while reading response header from upstream, client: 192.168.178.123, server: , request: "POST /webGui/include/DashboardApps.php HTTP/1.1", upstream: "fastcgi://unix:/var/run/php5-fpm.sock", host: "192.168.178.25", referrer: "http://192.168.178.25/Dashboard" Feb 13 10:59:13 Tower php-fpm[6004]: [WARNING] [pool www] server reached max_children setting (50), consider raising it Attached is the last 100 lines of my syslog. Unfortunately I'm losing my house power this morning so I need to switch off the server, but it's been running for at least 2 days since the issue, which occurred on either evening of 10/Feb or morning of 11/Feb (I left a backup running to disk3 overnight). syslog.txt
  4. Whoa. Whoa. Whoa. Seems an obvious culprit could indeed be the drive(s). I'm running 4 of the things. Oh damn.
  5. Wish I could but I can't remember, but if I'm being honest, I don't think this was the cause. I ran FCP once I started having issues, my gut says it hung on 3% due to these issues, not caused them.
  6. I've seen similar reports like here, but mine is slightly different in that there are no dockers running, so unsure what to look for. Here's the details: UNRAID Dashboard shows one core @ 100% When running top, there's nothing obvious in the CPU column, however I can see 24.9 wa, which would indicate 1 of the 4 cores is at 100% waiting on something: top - 20:57:30 up 2 days, 6:14, 1 user, load average: 319.27, 319.06, 318.26 Tasks: 608 total, 1 running, 607 sleeping, 0 stopped, 0 zombie %Cpu(s): 0.3 us, 0.2 sy, 0.0 ni, 74.7 id, 24.7 wa, 0.0 hi, 0.0 si, 0.0 st MiB Mem : 7866.9 total, 236.3 free, 981.9 used, 6648.7 buff/cache MiB Swap: 0.0 total, 0.0 free, 0.0 used. 5966.1 avail Mem PID USER PR NI VIRT RES SHR S %CPU %MEM TIME+ COMMAND 19097 root 20 0 6976 3464 2408 R 0.7 0.0 0:00.04 top 6029 root 20 0 149904 8548 3780 S 0.3 0.1 1:06.58 nginx 15089 root 20 0 690796 32716 18916 S 0.3 0.4 3:52.37 containerd 18930 root 20 0 104952 12676 6936 S 0.3 0.2 0:00.05 php-fpm 1 root 20 0 2468 1740 1632 S 0.0 0.0 0:15.82 init 2 root 20 0 0 0 0 S 0.0 0.0 0:00.02 kthreadd 3 root 0 -20 0 0 0 I 0.0 0.0 0:00.00 rcu_gp 4 root 0 -20 0 0 0 I 0.0 0.0 0:00.00 rcu_par_gp 6 root 0 -20 0 0 0 I 0.0 0.0 0:00.00 kworker/0:0H-kblockd 8 root 0 -20 0 0 0 I 0.0 0.0 0:00.00 mm_percpu_wq 9 root 20 0 0 0 0 S 0.0 0.0 0:02.71 ksoftirqd/0 I can't successfully run diagnostics, I simply receive no response: root@Tower:~# root@Tower:~# diagnostics Starting diagnostics collection... I can't see much the Docker page on the GUI, however I know I have 2 Dockers installed, but no Dockers running, there were none running yesterday when i could successfully access this screen: I receive this never-ending loop on the Apps screen: I can access the server over the network, but don't seem to be able to access disk3 (whereas the other disks are successful). disk3 I was copying files to yesterday, and it looks like it ran out of space (curious if this has caused it): I also know I tried to run the Fix Common Problems plugin yesterday and it stopped about 3% through. Attached to this is the results of ps -x, this is about as far as my investigation can take me. Any thoughts / advice as to next steps? What caused this? What is the process waiting on? What's hanging? What do I need to kill to resolve this, and how do I not cause this next time? ps-x.rtf