


Ninjadude101
Members
-
Joined
-
Last visited
-
@trurl I'm not sure if it's relevant or a different issue altogether, but today my unraid terminal (via web UI) keeps disconnecting and reconnecting - this happened before when I first logged this issue (although I think I forgot to mention it). Current log file is 7% so not too bad yet but it IS preventing me from using the terminal. Checked the logs, and there's a lot of this currently: Aug 23 11:47:53 Empress nginx: 2021/08/23 11:47:53 [alert] 10743#10743: worker process 8217 exited on signal 6 Aug 23 11:47:55 Empress nginx: 2021/08/23 11:47:55 [alert] 10743#10743: worker process 8277 exited on signal 6 Aug 23 11:47:57 Empress nginx: 2021/08/23 11:47:57 [alert] 10743#10743: worker process 8339 exited on signal 6 Aug 23 11:47:59 Empress nginx: 2021/08/23 11:47:59 [alert] 10743#10743: worker process 8408 exited on signal 6 Aug 23 11:48:01 Empress nginx: 2021/08/23 11:48:01 [alert] 10743#10743: worker process 8477 exited on signal 6 Aug 23 11:48:03 Empress nginx: 2021/08/23 11:48:03 [alert] 10743#10743: worker process 8581 exited on signal 6 Aug 23 11:48:05 Empress nginx: 2021/08/23 11:48:05 [alert] 10743#10743: worker process 8637 exited on signal 6 Aug 23 11:48:07 Empress nginx: 2021/08/23 11:48:07 [alert] 10743#10743: worker process 8699 exited on signal 6 Aug 23 11:48:09 Empress nginx: 2021/08/23 11:48:09 [alert] 10743#10743: worker process 8761 exited on signal 6 Aug 23 11:48:11 Empress nginx: 2021/08/23 11:48:11 [alert] 10743#10743: worker process 8831 exited on signal 6 Aug 23 11:48:13 Empress nginx: 2021/08/23 11:48:13 [alert] 10743#10743: worker process 9018 exited on signal 6 Aug 23 11:48:15 Empress nginx: 2021/08/23 11:48:15 [alert] 10743#10743: worker process 9082 exited on signal 6 Aug 23 11:48:17 Empress nginx: 2021/08/23 11:48:17 [alert] 10743#10743: worker process 9177 exited on signal 6 Aug 23 11:48:19 Empress nginx: 2021/08/23 11:48:19 [alert] 10743#10743: worker process 9257 exited on signal 6 Aug 23 11:48:21 Empress nginx: 2021/08/23 11:48:21 [alert] 10743#10743: worker process 9358 exited on signal 6 Aug 23 11:48:23 Empress nginx: 2021/08/23 11:48:23 [alert] 10743#10743: worker process 9420 exited on signal 6 Aug 23 11:48:25 Empress nginx: 2021/08/23 11:48:25 [alert] 10743#10743: worker process 9563 exited on signal 6 Aug 23 11:48:27 Empress nginx: 2021/08/23 11:48:27 [alert] 10743#10743: worker process 9636 exited on signal 6 Aug 23 11:48:29 Empress nginx: 2021/08/23 11:48:29 [alert] 10743#10743: worker process 9711 exited on signal 6 Aug 23 11:48:31 Empress nginx: 2021/08/23 11:48:31 [alert] 10743#10743: worker process 9779 exited on signal 6
-
Ah - I think the confusion comes from the fact I also have a domains share - that one is only allowed on disk6 and cache drive. I'll keep an eye like you said, but it could be a few weeks before anything interesting happens. Thanks for the help! Dan
-
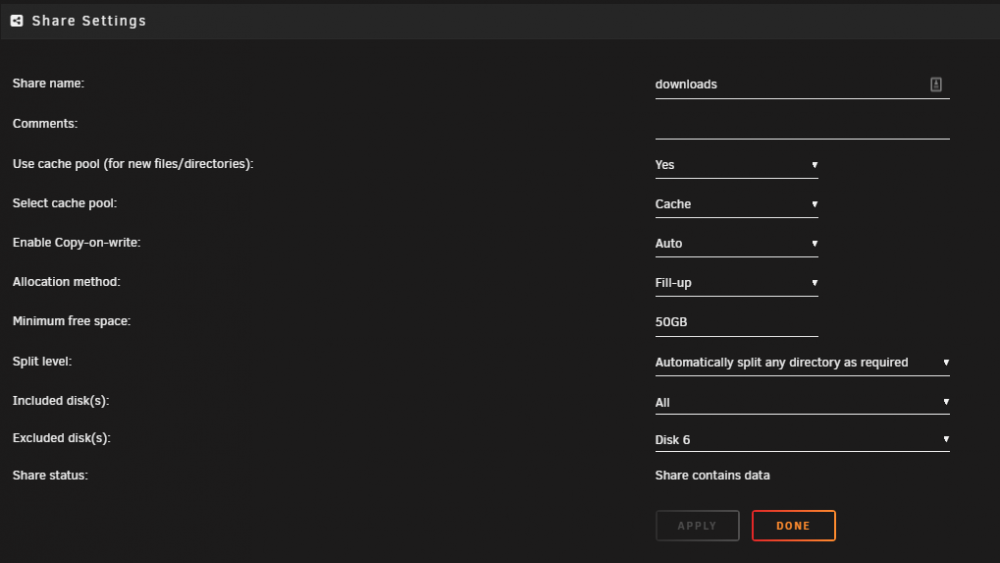
I notice at this point that the downloads share does NOT have free reign like I said - I am not sure why I excluded disk 6 but I will probably remove that. I will also likely change the allocation method to high water, I didn't realise it was using fill-up. Left these alone before taking the screenshot though so I'm not tampering with the investigation Thanks Dan
-
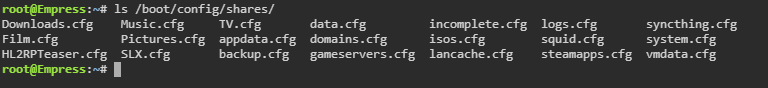
I guess I should rename that Downloads.cfg to downloads.cfg Thanks Dan
-
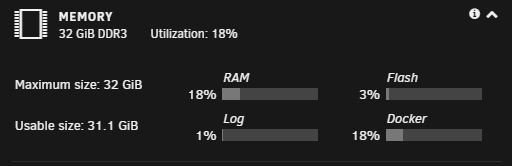
It looks like this now: Which is pretty much as expected - when this has happened before, the Log has always gone back to a reasonable size after a reboot, and will stay like that until it starts going crazy again (which may be a month from now). I do have a downloads share, but not a Downloads share. I am not sure where you are seeing the Downloads share? I've checked with ls against all disks and the cache and can confirm that there does not appear to be a Downloads (capital D) folder in the root of any of them. It's possible at one point in time I DID have a Downloads share but I must have changed the name some time ago. The downloads share has free reign to use all disks in the array, and it is set to use the cache but move to the array when the mover runs. Thanks Dan
-
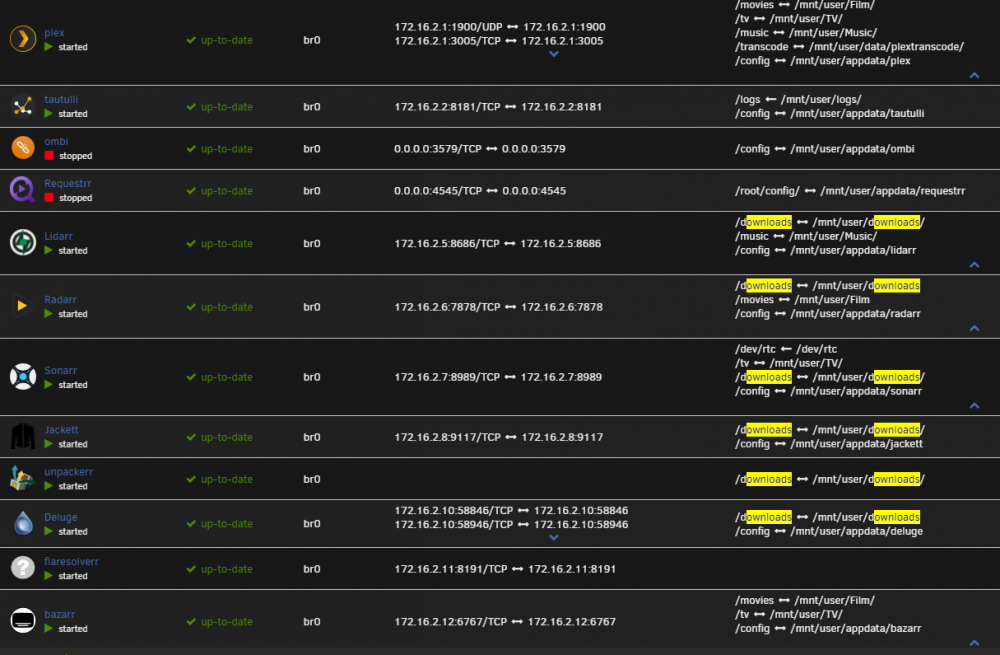
Name Container Writable Log --------------------------------------------------------------------- binhex-krusader 1.92 GB 35.6 MB 57.6 kB DiskSpeed 1.23 GB 0 B 23.2 MB jenkins-master 1.05 GB 0 B 23.2 MB Octoprint-A30 907 MB 5.18 MB 18.8 MB Octoprint-Prusa 907 MB 5.06 MB 52.3 kB Octoprint-E180 902 MB 0 B 23.2 MB Sonarr 807 MB 178 MB 5.89 MB plex 801 MB 138 MB 119 kB Lidarr 800 MB 457 MB 1.40 MB LANCache 624 MB 69.7 kB 384 kB Draw.io 534 MB 0 B 23.2 MB flaresolverr 440 MB 4.95 MB 465 kB speedtest 440 MB 82.6 kB 2.67 kB Requestrr 420 MB 0 B 23.2 MB HL2RPTeaser 383 MB 3.88 MB 1.85 kB RGForum 383 MB 3.81 MB 1.86 kB bazarr 380 MB 9.27 kB 11.6 MB Jackett 370 MB 109 MB 8.68 MB Radarr 358 MB 50.3 MB 1.88 MB swag 357 MB 0 B 23.2 MB RGDatabase 352 MB 0 B 23.2 MB ombi 289 MB 0 B 23.2 MB trilium 267 MB 0 B 23.2 MB Deluge 260 MB 304 kB 6.10 MB QDirStat 248 MB 23.6 kB 67.1 kB nginx 182 MB 0 B 23.2 MB tautulli 158 MB 38.8 MB 1.79 MB DHCP 117 MB 0 B 23.2 MB GM_BalanceTest 117 MB 3.88 MB 11.6 kB GM_BalanceTest_2 117 MB 3.88 MB 12.4 kB cadvisor 69.6 MB 0 B 1.21 kB OpenSpeedTest 55.5 MB 0 B 23.2 MB AdGuard-Home 51.4 MB 0 B 23.2 MB Authelia 49.9 MB 0 B 23.2 MB network-multitool 38.1 MB 0 B 23.2 MB unpackerr 4.47 MB 0 B 1.44 MB --------------------------------------------------------------------- Total size 16.4 GB 1.04 GB 407 MB I'm checking the likely candidates for that folder mapping issue - you are correct that I have a downloads share, at /mnt/user/downloads/ and all containers which are intentionally making use of it have it mapped internally to /downloads, but I will check the settings within the applications to see if I've made a typo somewhere... I suspect it's either Lidarr, Radarr, or Sonarr to be honest, but the path mappings in the settings on those isn't amazingly organised. These are all the ones which have that share mapped, or are somehow related to that share: Thanks Dan
-
Did that a while ago now, can't remember exactly why but I'm sure it had filled up and caused me headaches having to reinstall all the containers - I just wanted to avoid it happening again. If there is still a container filling it up, is there a way to determine which one? Dan
-
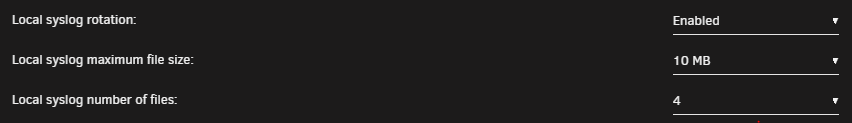
Ok, have restarted the server gracefully and the diagnostics are attached. With regard to the syslog server, I have it set up as described under the "Local Syslog Server" section in the link you posted, albeit, the share is not cache-only (though I might change that, makes sense). - EDIT - Actually I would like to point out that the syslog rotation settings do not appear to be working as expected. Here are the settings regarding that: Yet, the single file in that share is currently ~31MB. Thanks Dan empress-diagnostics-20210810-1447.zip
-
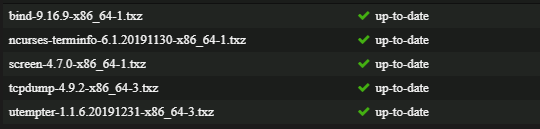
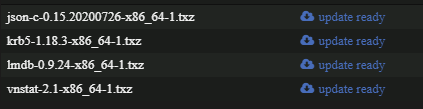
Good question. I'll be honest, I was surprised to see that many installed - I thought I had only used it for one or two things... Though it escapes me right now which of these I actually need. Dan
-
Btw, in the ~30 minutes or so it's taken me to write the first post, the logs has grown to 37%.
-
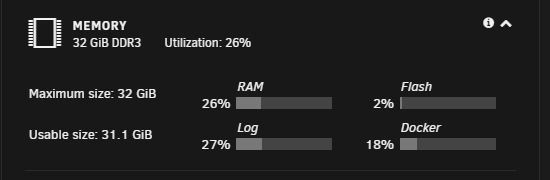
Hi all, I'm having a problem with my Unraid 6.9.2 server lately, whereby it will suddenly start filling up the logs (I am talking specifically about the "Log" value shown in the "Memory" section on the Dashboard page of the web ui). Seen here: I'll grant you, 27% isn't that bad, but this has happened before (at a guess about once a month), this morning it was at 10% or so and previously I haven't noticed until the Log was at 100%. Since I want to figure out why this is happening and put a stop to it, the last time it happened, I set up a local syslog server so that I could retain the logs after a reboot. I would post diagnostics however trying to retrieve them via the web ui just hangs, seemingly forever. I've had a quick look over the logs from my PC (trying to view them in the web ui also hangs and shows a white page), and I notice a lot of this: Aug 10 12:40:15 Empress kernel: nginx[22272]: segfault at 0 ip 0000000000000000 sp 00007ffe39131ec8 error 14 in nginx[400000+22000] Aug 10 12:40:15 Empress kernel: Code: Unable to access opcode bytes at RIP 0xffffffffffffffd6. Aug 10 12:40:15 Empress nginx: 2021/08/10 12:40:15 [alert] 10570#10570: worker process 22272 exited on signal 11 Aug 10 12:40:15 Empress nginx: 2021/08/10 12:40:15 [crit] 22275#22275: ngx_slab_alloc() failed: no memory Aug 10 12:40:15 Empress nginx: 2021/08/10 12:40:15 [error] 22275#22275: shpool alloc failed Aug 10 12:40:15 Empress nginx: 2021/08/10 12:40:15 [error] 22275#22275: nchan: Out of shared memory while allocating channel /dockerload. Increase nchan_max_reserved_memory. Aug 10 12:40:15 Empress nginx: 2021/08/10 12:40:15 [error] 22275#22275: *5505839 nchan: error publishing message (HTTP status code 507), client: unix:, server: , request: "POST /pub/dockerload?buffer_length=0 HTTP/1.1", host: "localhost" Aug 10 12:40:16 Empress nginx: 2021/08/10 12:40:16 [crit] 22275#22275: ngx_slab_alloc() failed: no memory Aug 10 12:40:16 Empress nginx: 2021/08/10 12:40:16 [error] 22275#22275: shpool alloc failed Aug 10 12:40:16 Empress nginx: 2021/08/10 12:40:16 [error] 22275#22275: nchan: Out of shared memory while allocating channel /cpuload. Increase nchan_max_reserved_memory. Aug 10 12:40:16 Empress nginx: 2021/08/10 12:40:16 [error] 22275#22275: *5505840 nchan: error publishing message (HTTP status code 507), client: unix:, server: , request: "POST /pub/cpuload?buffer_length=1 HTTP/1.1", host: "localhost" Aug 10 12:40:16 Empress nginx: 2021/08/10 12:40:16 [crit] 22275#22275: ngx_slab_alloc() failed: no memory Aug 10 12:40:16 Empress nginx: 2021/08/10 12:40:16 [error] 22275#22275: shpool alloc failed Aug 10 12:40:16 Empress nginx: 2021/08/10 12:40:16 [error] 22275#22275: nchan: Out of shared memory while allocating channel /disks. Increase nchan_max_reserved_memory. Aug 10 12:40:16 Empress nginx: 2021/08/10 12:40:16 [error] 22275#22275: *5505841 nchan: error publishing message (HTTP status code 507), client: unix:, server: , request: "POST /pub/disks?buffer_length=1 HTTP/1.1", host: "localhost" Aug 10 12:40:16 Empress nginx: 2021/08/10 12:40:16 [crit] 22275#22275: ngx_slab_alloc() failed: no memory Aug 10 12:40:16 Empress nginx: 2021/08/10 12:40:16 [error] 22275#22275: shpool alloc failed Aug 10 12:40:16 Empress nginx: 2021/08/10 12:40:16 [error] 22275#22275: nchan: Out of shared memory while allocating channel /shares. Increase nchan_max_reserved_memory. Aug 10 12:40:16 Empress nginx: 2021/08/10 12:40:16 [error] 22275#22275: *5505842 nchan: error publishing message (HTTP status code 507), client: unix:, server: , request: "POST /pub/shares?buffer_length=1 HTTP/1.1", host: "localhost" Aug 10 12:40:17 Empress nginx: 2021/08/10 12:40:17 [crit] 22275#22275: ngx_slab_alloc() failed: no memory Aug 10 12:40:17 Empress nginx: 2021/08/10 12:40:17 [error] 22275#22275: shpool alloc failed Aug 10 12:40:17 Empress nginx: 2021/08/10 12:40:17 [error] 22275#22275: nchan: Out of shared memory while allocating channel /cpuload. Increase nchan_max_reserved_memory. Aug 10 12:40:17 Empress nginx: 2021/08/10 12:40:17 [error] 22275#22275: *5505843 nchan: error publishing message (HTTP status code 507), client: unix:, server: , request: "POST /pub/cpuload?buffer_length=1 HTTP/1.1", host: "localhost" Aug 10 12:40:17 Empress nginx: 2021/08/10 12:40:17 [crit] 22275#22275: ngx_slab_alloc() failed: no memory Aug 10 12:40:17 Empress nginx: 2021/08/10 12:40:17 [error] 22275#22275: shpool alloc failed Aug 10 12:40:17 Empress nginx: 2021/08/10 12:40:17 [error] 22275#22275: nchan: Out of shared memory while allocating channel /var. Increase nchan_max_reserved_memory. Aug 10 12:40:17 Empress nginx: 2021/08/10 12:40:17 [alert] 22275#22275: *5505844 header already sent while keepalive, client: 172.16.0.68, server: 0.0.0.0:80 I can't get into the terminal via the web ui (this also hangs), but I am doubtful that I have run out of memory as I have 32GB and it's usually only consuming about 10-15% of that. How can I troubleshoot this? I have the docker service running, currently 18 containers are up. I have the VM service enabled however no VMs are currently running. The plugins I have installed are: Auto Turbo Write Mode (Squid) Community Applications (Squid) Disk Location (Olehj) Docker Folder (GuildDart) Dynamix SSD Trim (Dynamix) File Activity (Dlandon) Fix Common Problems (Squid) IPMI Tools (Dmacias) NerdPack GUI (Dmacias) Network Stats (Dorgan) Nvidia Driver (Ich777) Open Files (Dlandon) SSH Config Tool (Docgyver) (Not sure if this one is enabled - it states incompatibility with this version of Unraid) Theme Engine (Skitals) Tips and Tweaks (Dlandon) Unassigned Devices (Dlandon) Unassigned Devices Plus (Dlandon) unBALANCE (Jbrodriguez) User Scripts (Squid) Wake On Lan (Dmacias) Looking forward to your reply Dan
-
Unfortunately it's already enabled I haven't tried that yet but I ran the server details through a PSU calculator and even if I over-exaggerate on the number of drives etc, my PSU should have plenty of overhead. It's about 400-460W recommended but the fitted PSU is 750W. I'll endeavour to follow the other suggestion (temporary unraid server using an entirely different machine - one where this card can work in Windows) tomorrow. Thanks
-
The card only takes power from the motherboard and it SHOULD be enough but that's something I need to check - maybe with all the hard drives I've added since the time it worked has caused a shortage of power? Not sure what above 4G decoding is so will look into that. It's a pain in the butt but yes if it comes to it I have another system I can use to temporarily run unraid and test the card that way. The BIOS has been reset at least twice since I have been having the problem so I'm not convinced I could make a difference doing it again, and I am booting with Legacy Mode already so that's definitely not the issue. I will try the 4G decoding, check the power situation, and try the card in a temp unraid server and get back to you. Thanks
-
Oh yeah, good point - thanks. Unfortunately that made no difference to the problem - still can't find the card according to the plugin page and the nvidia-smi output. I have changed my driver selection to use the "Production branch" (I'm doubtful it makes any difference here but once it's working I want to stick to stable builds only). New diagnostics attached in case that's needed again. The server has been restarted twice - once after updating the plugin and once after changing the driver selection. The diagnostics are from the most recent boot. Thanks Dan empress-diagnostics-20210527-1805.zip
-
Ok thanks - I have upgraded Unraid to 6.9.2 and ACS is back on disabled since you said that doesn't matter. The plugin still shows "No devices were found" and nvidia-smi says the same. Diagnostics attached Thanks empress-diagnostics-20210527-1705.zip


