generalkenobi
Members
-
Joined
-
Last visited
Everything posted by generalkenobi
-
topherino, your post caused me to take a look at this again. Not sure if this will work for everyone, but I was able to get it working and no longer get the “Failed to load delegate from libedgetpu.so.1” errors. Here's what fixed it for me: Plug the Coral directly into a motherboard USB-C/USB-A port. Mine was on a front-panel hub. May not be the fix, but moving it off the hub eliminated one failure point. I needed to tell the kernel to keep the USB link awake. So, edit /boot/syslinux/syslinux.cfg and add these parameters to every append line you boot with: usbcore.quirks=1a6e:089a:k,18d1:9302:k usbcore.autosuspend=-1 Those are the Coral’s pre- and post-firmware USB IDs corresponding to Global Unichip Corp and Google Inc. My /boot/syslinux/syslinux.cfg file in full reads: default menu.c32 menu title Lime Technology, Inc. prompt 0 timeout 50 label Unraid OS menu default kernel /bzimage append initrd=/bzroot transparent_hugepage=never usbcore.quirks=1a6e:089a:k,18d1:9302:k usbcore.autosuspend=-1 label Unraid OS GUI Mode kernel /bzimage append initrd=/bzroot,/bzroot-gui usbcore.quirks=1a6e:089a:k,18d1:9302:k usbcore.autosuspend=-1 label Unraid OS Safe Mode (no plugins, no GUI) kernel /bzimage append initrd=/bzroot unraidsafemode label Unraid OS GUI Safe Mode (no plugins) kernel /bzimage append initrd=/bzroot,/bzroot-gui unraidsafemode label Memtest86+ kernel /memtest Reboot. When I run: dmesg | grep -i 1a6e I can see confirmation that the kernel commands persisted. I switched to the plain koush/scrypted image (not :nvidia) and drop --runtime=nvidia. While my Coral was not working, I was running on an RTX 3090, but obviously this isn't needed with the Coral. Check inside Scrypted: I checked inside the TENSORFLOW LITE OBJECT DETECTION plugin. Hit "Restart Plugin" to generate logs, and I see the following: coral edge tpu library loaded successfully edge tpus [{'type': 'usb', 'path': '/sys/bus/usb/devices/2-5'}] model: scrypted_yolov9s_relu_sep_320 Tensorflow Lite Object Detection: loaded @scrypted/tensorflow-lite Interpreter initialized on thread tflite_0 The Scrypted docker container also shows this in the logs: coral edge tpu library loaded successfullyBasically, I needed these syslinux quirks because without them the TPU seems to drop out, generating that "Failed to load delegate from libedgetpu.so.1" error. Note that I am still on Unraid 7.0.0.
-
Hi Unraid Community, TL;DR: USB Coral Edge TPU is detected on Unraid 7.0.0 but fails to initialize in the Scrypted Docker container (libedgetpu.so.1 error). Falls back to CPU inference. Tried USB passthrough, drivers, and privileged mode—still no luck. Any advice? I recently updated my server to Unraid 7.0.0 (from 6.12.4) and am encountering issues with setting up a USB Coral Edge TPU for TensorFlow Lite Object Detection in the Scrypted Docker container. While the Coral TPU is detected by the host, it fails to initialize within the container, resulting in fallback to CPU inference. System and Setup Details Unraid Host: Version: Unraid 7.0.0 Plugins Installed: Coral Accelerator Module Drivers by ich777 not needed for USB based Coral TPUs Relevant lsusb Output: Bus 002 Device 010: ID 18d1:9302 Google Inc. The Coral Edge TPU device is detected by the host. Scrypted Docker Container: Repository: koush/scrypted Network Type: Custom br0 (Internal 10G NIC, IP: 192.168.1.212) Volume Bindings: /mnt/disks/Scrypted/ -> /Volumes/Scrypted/ /dev/bus/usb -> /dev/bus/usb /dev/dri -> /dev/dri Privileged Mode: Enabled Error Details Scrypted Container Logs: unable to use Coral Edge TPU Failed to load delegate from libedgetpu.so.1 model: scrypted_yolov8n_320 /server/volume/plugins/@scrypted/tensorflow-lite/files/v14/scrypted_yolov8n_320/best_full_integer_quant.tflite /server/volume/plugins/@scrypted/tensorflow-lite/files/v14/scrypted_labels.txt i Tensorflow Lite Object Detection loaded @scrypted/tensorflow-lite and Coral edge tpu library loaded successfully edge tpus [{'type': 'usb', 'path': '/sys/bus/usb/devices/2-2'}] unable to use Coral Edge TPU Failed to load delegate from libedgetpu.so.1 The Coral Edge TPU is detected (via /sys/bus/usb/devices/2-2), but the TensorFlow Lite Object Detection plugin fails to load the required delegate library libedgetpu.so.1. Steps Taken Updated to Unraid 7.0.0 from 6.12.4. Installed the Coral Accelerator Module Drivers plugin by ich777. not needed for USB based Coral TPUs Verified USB passthrough setup: Mapped /dev/bus/usb and /dev/dri from the Unraid host to the container. Confirmed the Coral Edge TPU appears in the host's lsusb output. Enabled privileged mode for the Scrypted Docker container. Confirmed the Coral device is detected by TensorFlow Lite but fails to load the delegate library. Questions Has anyone successfully set up a USB Coral Edge TPU with the Scrypted Docker container on Unraid? Are there additional steps required for the USB version to work correctly? Is additional configuration needed to ensure the container can access the TPU’s delegate library (libedgetpu.so.1)? Are there compatibility concerns between TensorFlow Lite, the Coral Edge TPU runtime, and the Scrypted container? Please see attached logs. Let me know if additional logs or details are required. Thank you for your time and help! Any guidance or advice would be greatly appreciated. tower-diagnostics-20250117-2303.zip
-
Following back up on this. It seems that the old UPS was somehow cutting power to the outlet when it was overloaded. Moved this to another UPS and haven't had any problems since. Thanks all!
-
Hmm. Another restart after the power supply swap. Any other ideas? Since my last post, the parity check had finished. I moved it to another outlet on 1500W UPS. So, I don't think it's the outlet. My girlfriend overloaded the breaker with her hair dryer, but NUT did its job. I doubt it's the move to a different outlet. But maybe the UPS is faulty? Sep 15 10:22:34 Tower upsmon[5986]: UPS [email protected] on battery .... NUT is configured for shutdown after 5 min on battery Sep 15 10:27:35 Tower upsmon[5986]: Signal 10: User requested FSD Syslog is similar with nothing I can see. Restart occurs at Sep 15 12:47:31 in syslog. I ran sensors to get CPU temps now (with docker and parity check running and ~5% cpu load). Don't know what it was before restart. But I wondered about overheating the CPU. Those seem fine too. root@Tower:~# sensors coretemp-isa-0000 Adapter: ISA adapter Package id 0: +44.0°C (high = +80.0°C, crit = +100.0°C) Core 0: +42.0°C (high = +80.0°C, crit = +100.0°C) Core 4: +42.0°C (high = +80.0°C, crit = +100.0°C) Core 8: +41.0°C (high = +80.0°C, crit = +100.0°C) Core 12: +43.0°C (high = +80.0°C, crit = +100.0°C) Core 16: +44.0°C (high = +80.0°C, crit = +100.0°C) Core 20: +42.0°C (high = +80.0°C, crit = +100.0°C) Core 24: +40.0°C (high = +80.0°C, crit = +100.0°C) Core 28: +42.0°C (high = +80.0°C, crit = +100.0°C) Core 32: +40.0°C (high = +80.0°C, crit = +100.0°C) Core 33: +40.0°C (high = +80.0°C, crit = +100.0°C) Core 34: +40.0°C (high = +80.0°C, crit = +100.0°C) Core 35: +40.0°C (high = +80.0°C, crit = +100.0°C) Core 36: +42.0°C (high = +80.0°C, crit = +100.0°C) Core 37: +42.0°C (high = +80.0°C, crit = +100.0°C) Core 38: +42.0°C (high = +80.0°C, crit = +100.0°C) Core 39: +42.0°C (high = +80.0°C, crit = +100.0°C) Core 40: +42.0°C (high = +80.0°C, crit = +100.0°C) Core 41: +42.0°C (high = +80.0°C, crit = +100.0°C) Core 42: +42.0°C (high = +80.0°C, crit = +100.0°C) Core 43: +42.0°C (high = +80.0°C, crit = +100.0°C) Core 44: +38.0°C (high = +80.0°C, crit = +100.0°C) Core 45: +38.0°C (high = +80.0°C, crit = +100.0°C) Core 46: +38.0°C (high = +80.0°C, crit = +100.0°C) Core 47: +38.0°C (high = +80.0°C, crit = +100.0°C) nvme-pci-0300 Adapter: PCI adapter Composite: +49.9°C (low = -273.1°C, high = +81.8°C) (crit = +84.8°C) Sensor 1: +49.9°C (low = -273.1°C, high = +65261.8°C) Sensor 2: +52.9°C (low = -273.1°C, high = +65261.8°C) acpitz-acpi-0 Adapter: ACPI interface temp1: +27.8°C (crit = +105.0°C) eth0-pci-0600 Adapter: PCI adapter PHY Temperature: +62.0°C MAC Temperature: +62.0°C eth2-pci-0200 Adapter: PCI adapter PHY Temperature: +53.0°C MAC Temperature: +53.0°C syslog
-
I swapped with a new power supply. So far, it’s been up for 25 hours with no issues. Parity check is running and has corrected over 11,000 errors. Yikes. This may be solved. Holding out hope it remains stable over the next few days. Thanks for the suggestions.
-
Thanks. Those are good points. I turned on syslog to flash and got these logs. The last restart was around 12:40 today. It booted back up at "Sep 13 12:40:20." This restart is after I had stopped the array and let it sit idle. The lines preceding that are: Sep 13 12:37:03 Tower emhttpd: spinning down /dev/sdf Sep 13 12:37:12 Tower emhttpd: spinning down /dev/sdd Sep 13 12:37:20 Tower emhttpd: spinning down /dev/sdk Sep 13 12:37:20 Tower emhttpd: spinning down /dev/sdi Sep 13 12:37:37 Tower emhttpd: spinning down /dev/sdg Sep 13 12:37:46 Tower emhttpd: spinning down /dev/sde Sep 13 12:37:46 Tower emhttpd: spinning down /dev/sdl Sep 13 12:38:09 Tower emhttpd: read SMART /dev/sdf Sep 13 12:38:09 Tower emhttpd: spinning down /dev/sdj Sep 13 12:38:09 Tower emhttpd: spinning down /dev/sdc Sep 13 12:38:18 Tower emhttpd: read SMART /dev/sdd Sep 13 12:38:18 Tower emhttpd: spinning down /dev/sdh Which doesn't look bad to me. I'll try a power supply swap next once I work out if I have enough SATA power cables. syslog
-
TL;DR: Unraid server keeps restarting every 90 mins. Tried disabling VM and Docker, rolling back versions, and memory tests—all no fix. Swapped CPU and changed from PCI SATA to HBA adapter a month ago; was stable but now unstable again. Running on i9-13900K, Asus ProArt Z690, 64GB RAM. No clues in rsyslog or kernel panics. Open to any suggestions or insights from diagnostics. I have had issues with Unraid restarting roughly every 90 minutes or so. I have the diagnostics attached. Things I've tried: Disable VM Manager and Docker and leave disabled - no fix. Change Docker to ipvlan - no fix. Rollback from 6.12.4 to 6.12.2 - no fix. Rollback from 6.12.2 to 6.11.5 - no fix. I pulled out memory sticks and memtest for 24 hours straight with all passes. I had a cache SSD disk ("cache_ssd") that had some bad sectors. I removed it from the system just in case, though it is still connected. I just haven't the time to open the case. A month ago, I swapped to a new but the same model CPU, thinking I had kernel panics caused by the CPU. I previously had issues per my previous post. However, the system was stable for a month straight with no issues when I changed from a PCI SATA card to an HBA adapter. I have an i9-13900K on an Asus ProArt Z690-CREATOR WIFI with 64 GB. No GPU installed. I'm using the onboard 10G port for primary connection. I have a 10GBe PCI card to get me a direct connection to my backup Unraid server to rsync data back and forth. But that's been offline for a while. I have (8) 18TB disks with (1) parity. And I have a NVMe drive and SSD marked as cache, but I'm really just using them to serve docker containers to not stress the array. I set up a rsyslog server at attached that as well. It leaves no trace before a reboot. I don't see any kernel panics the way I did a month ago. I am at a loss for what to do next. Any wild ideas from anyone? Or someone that sees something in the diagnostics that I don't? tower-diagnostics-20230912-2120.zip messages
-
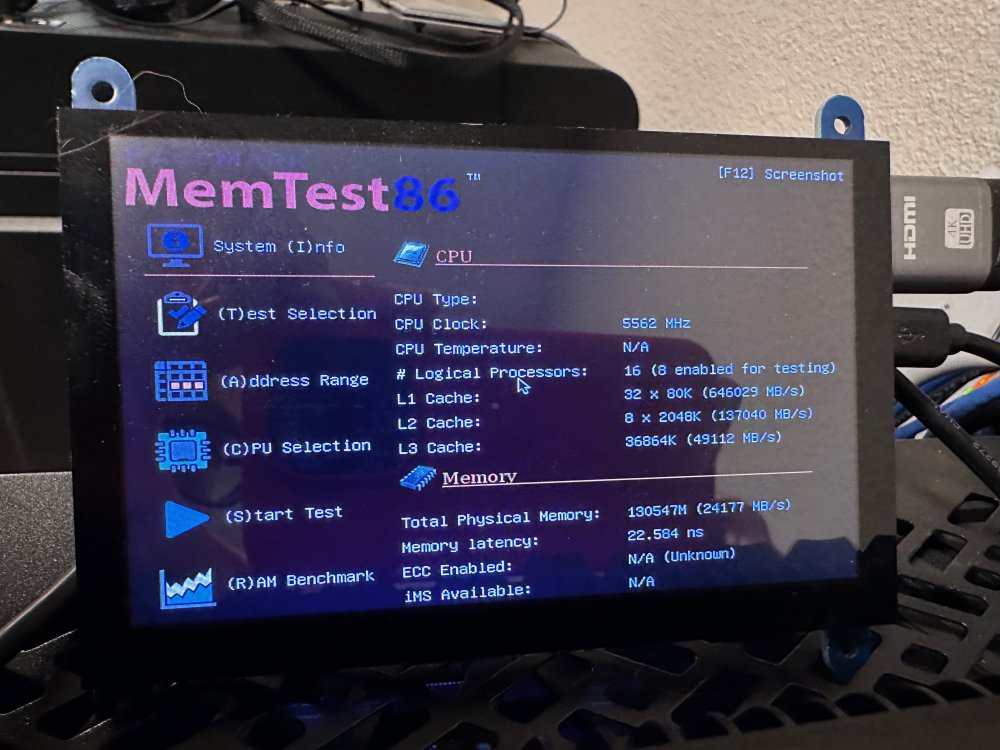
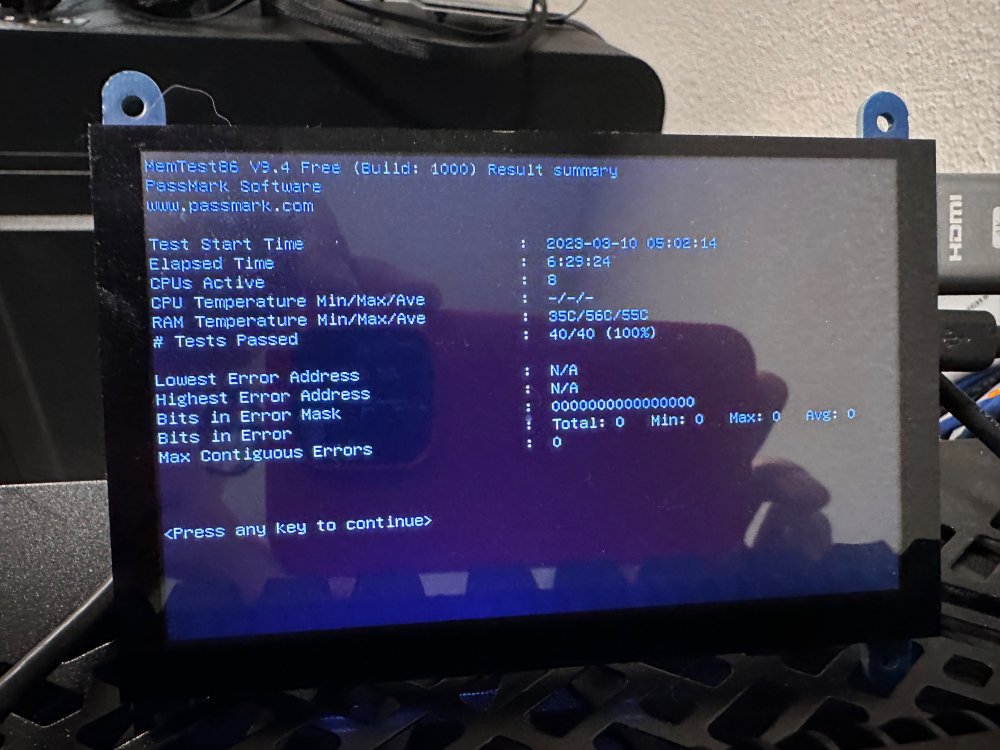
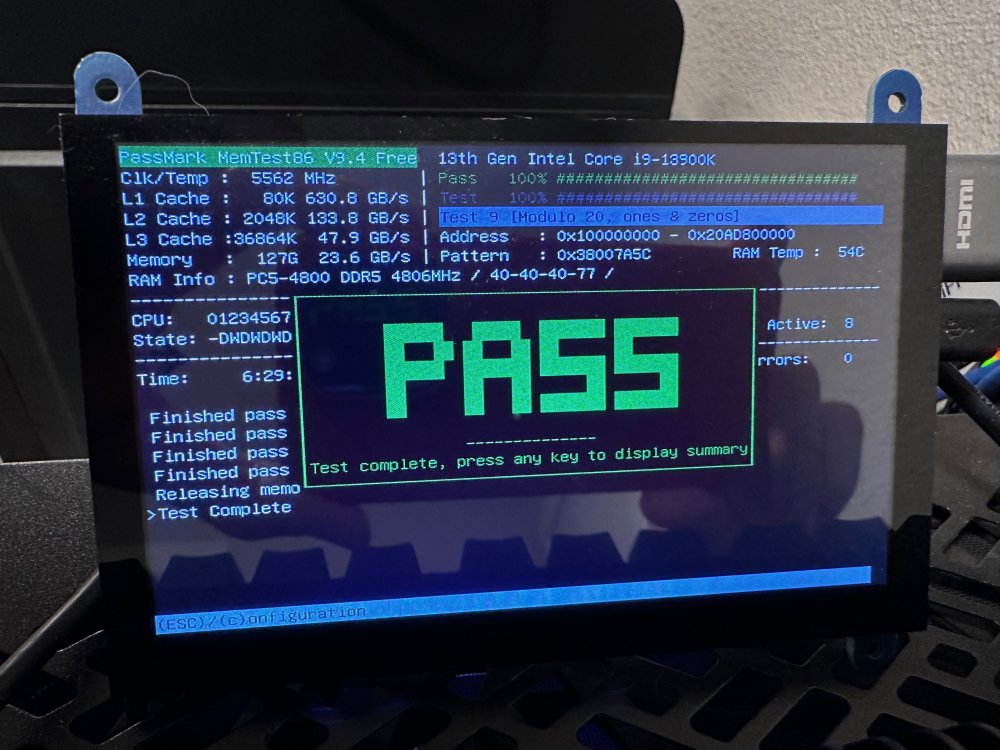
Memory test passed fine - see results I tried starting and then stopping each container individually and then watching the logs: Starting the Plex container caused this error: Mar 10 13:22:32 Tower kernel: Plex Script Hos[24901]: segfault at 0 ip 00001490f655efdb sp 00007ffd79bded50 error 6 in libpython27.so[1490f6436000+179000] Mar 10 13:22:32 Tower kernel: Code: 48 83 c4 20 49 89 c5 48 8b 7d d0 48 ff 0f 75 07 48 8b 47 08 ff 50 30 48 8b 03 4c 39 f8 76 22 48 8d 48 f8 48 89 0b 48 8b 78 f8 <48> ff 0f 75 0a 48 8b 47 08 ff 50 30 48 8b 0b 48 89 c8 4c 39 f9 77 Mar 10 13:22:44 Tower kernel: Plex Tuner Serv[24915]: segfault at 58 ip 000014dc1dbefd0f sp 000014dc1bfd86e8 error 4 in ld-musl-x86_64.so.1[14dc1dba8000+53000] Mar 10 13:22:44 Tower kernel: Code: 00 00 00 48 8b 44 24 f8 48 89 47 20 0f 28 44 24 e8 0f 11 47 10 0f 28 44 24 d8 0f 11 07 48 85 f6 74 05 8b 06 89 47 10 31 c0 c3 <f6> 47 10 0f 75 10 b9 10 00 00 00 31 c0 f0 0f b1 0f 9b 85 c0 74 07 And starting Sonarr: Mar 10 13:24:12 Tower kernel: BUG: kernel NULL pointer dereference, address: 0000000000000030 Mar 10 13:24:12 Tower kernel: #PF: supervisor read access in kernel mode Mar 10 13:24:12 Tower kernel: #PF: error_code(0x0000) - not-present page Mar 10 13:24:12 Tower kernel: PGD 58db05067 P4D 58db05067 PUD 211f60067 PMD 0 Mar 10 13:24:12 Tower kernel: Oops: 0000 [#4] PREEMPT SMP NOPTI Mar 10 13:24:12 Tower kernel: CPU: 8 PID: 29534 Comm: pgrep Tainted: G D 5.19.17-Unraid #2 Mar 10 13:24:12 Tower kernel: Hardware name: ASUS System Product Name/ProArt Z690-CREATOR WIFI, BIOS 1720 08/12/2022 Mar 10 13:24:12 Tower kernel: RIP: 0010:do_dentry_open+0x212/0x2bf Mar 10 13:24:12 Tower kernel: Code: 00 48 85 d2 74 0e 48 83 7a 58 00 74 07 81 4b 44 00 00 40 00 81 63 40 3f fc ff ff bd ea ff ff ff 48 8b 00 48 8d bb 98 00 00 00 <48> 8b 70 30 e8 cc fc f7 ff 48 b8 00 40 00 00 00 00 40 00 48 23 43 Mar 10 13:24:12 Tower kernel: RSP: 0018:ffffc90001997cc8 EFLAGS: 00010206 Mar 10 13:24:12 Tower kernel: RAX: 0000000000000000 RBX: ffff888186b22c00 RCX: 0000000000000000 Mar 10 13:24:12 Tower kernel: RDX: 0000000000000000 RSI: ffffffff820e517e RDI: ffff888186b22c98 Mar 10 13:24:12 Tower kernel: RBP: 00000000ffffffea R08: 0000000000000dc0 R09: 0000000000000001 Mar 10 13:24:12 Tower kernel: R10: 0000000000000000 R11: 0000000000000fe0 R12: ffff888100677938 Mar 10 13:24:12 Tower kernel: R13: ffff888186b22c10 R14: ffffffff812866e8 R15: 0000000000000000 Mar 10 13:24:12 Tower kernel: FS: 00001457cb2827c0(0000) GS:ffff88a02d200000(0000) knlGS:0000000000000000 Mar 10 13:24:12 Tower kernel: CS: 0010 DS: 0000 ES: 0000 CR0: 0000000080050033 Mar 10 13:24:12 Tower kernel: CR2: 0000000000000030 CR3: 00000004e736a005 CR4: 0000000000770ee0 Mar 10 13:24:12 Tower kernel: PKRU: 55555554 Mar 10 13:24:12 Tower kernel: Call Trace: Mar 10 13:24:12 Tower kernel: <TASK> Mar 10 13:24:12 Tower kernel: path_openat+0x950/0xaa9 Mar 10 13:24:12 Tower kernel: do_filp_open+0x55/0xb8 Mar 10 13:24:12 Tower kernel: ? getname_flags+0x29/0x152 Mar 10 13:24:12 Tower kernel: ? kmem_cache_alloc+0x11a/0x143 Mar 10 13:24:12 Tower kernel: do_sys_openat2+0x6c/0xd9 Mar 10 13:24:12 Tower kernel: do_sys_open+0x3a/0x5a Mar 10 13:24:12 Tower kernel: do_syscall_64+0x68/0x81 Mar 10 13:24:12 Tower kernel: entry_SYSCALL_64_after_hwframe+0x63/0xcd Mar 10 13:24:12 Tower kernel: RIP: 0033:0x1457cb4470f1 Mar 10 13:24:12 Tower kernel: Code: 75 37 89 f0 25 00 00 41 00 3d 00 00 41 00 74 29 80 3d fa b4 0e 00 00 74 4d 89 da 48 89 ee bf 9c ff ff ff b8 01 01 00 00 0f 05 <48> 3d 00 f0 ff ff 77 77 48 83 c4 68 5b 5d c3 48 8d 84 24 80 00 00 Mar 10 13:24:12 Tower kernel: RSP: 002b:00007ffce139ae90 EFLAGS: 00000202 ORIG_RAX: 0000000000000101 Mar 10 13:24:12 Tower kernel: RAX: ffffffffffffffda RBX: 0000000000000000 RCX: 00001457cb4470f1 Mar 10 13:24:12 Tower kernel: RDX: 0000000000000000 RSI: 00007ffce139af20 RDI: 00000000ffffff9c Mar 10 13:24:12 Tower kernel: RBP: 00007ffce139af20 R08: 0000000000000038 R09: 0000000000000073 Mar 10 13:24:12 Tower kernel: R10: 0000000000000000 R11: 0000000000000202 R12: 00007ffce139b150 Mar 10 13:24:12 Tower kernel: R13: 0000000000409530 R14: 0000000000000020 R15: 00007ffce139b150 Mar 10 13:24:12 Tower kernel: </TASK> Mar 10 13:24:12 Tower kernel: Modules linked in: xt_mark xt_nat veth xt_CHECKSUM ipt_REJECT nf_reject_ipv4 xt_tcpudp ip6table_mangle ip6table_nat iptable_mangle vhost_net tun vhost vhost_iotlb tap xt_conntrack xt_MASQUERADE nf_conntrack_netlink nfnetlink xfrm_user xfrm_algo xt_addrtype iptable_nat nf_nat nf_conntrack nf_defrag_ipv6 nf_defrag_ipv4 br_netfilter bridge xfs nfsd auth_rpcgss oid_registry lockd grace sunrpc md_mod efivarfs ip6table_filter ip6_tables iptable_filter ip_tables x_tables af_packet 8021q garp mrp stp llc bonding tls igc atlantic i915 iosf_mbi drm_buddy i2c_algo_bit ttm drm_display_helper drm_kms_helper drm btusb btrtl btbcm btintel bluetooth intel_gtt nvme agpgart i2c_i801 input_leds wmi_bmof x86_pkg_temp_thermal intel_powerclamp coretemp kvm_intel kvm crct10dif_pclmul crc32_pclmul crc32c_intel ghash_clmulni_intel aesni_intel crypto_simd cryptd intel_cstate intel_uncore i2c_smbus thunderbolt ecdh_generic led_class ecc i2c_core nvme_core joydev ahci libahci syscopyarea sysfillrect Mar 10 13:24:12 Tower kernel: sysimgblt fb_sys_fops tpm_crb tpm_tis thermal fan wmi tpm_tis_core video tpm backlight acpi_tad acpi_pad button unix [last unloaded: igc] Mar 10 13:24:12 Tower kernel: CR2: 0000000000000030 Mar 10 13:24:12 Tower kernel: ---[ end trace 0000000000000000 ]--- Mar 10 13:24:12 Tower kernel: RIP: 0010:do_dentry_open+0x1ee/0x2bf Mar 10 13:24:12 Tower kernel: Code: 28 48 83 7a 18 00 75 07 48 83 7a 28 00 74 08 0d 00 00 04 00 89 43 44 48 8b 83 d0 00 00 00 48 8b 90 90 00 00 00 48 85 d2 74 0e <48> 83 7a 58 00 74 07 81 4b 44 00 00 40 00 81 63 40 3f fc ff ff bd Mar 10 13:24:12 Tower kernel: RSP: 0018:ffffc9000b81fcc8 EFLAGS: 00010206 Mar 10 13:24:12 Tower kernel: RAX: ffff888125fa3a3a RBX: ffff8881a333be00 RCX: 0000000000000000 Mar 10 13:24:12 Tower kernel: RDX: 3ad0000000000000 RSI: ffffffff820e517e RDI: ffff8881097ac0b0 Mar 10 13:24:12 Tower kernel: RBP: 0000000000000000 R08: 0000000000000dc0 R09: 0000000000000001 Mar 10 13:24:12 Tower kernel: R10: 0000000000000000 R11: 0000000000000fe0 R12: ffff888125fa38b8 Mar 10 13:24:12 Tower kernel: R13: ffff8881a333be10 R14: ffffffff812866e8 R15: 0000000000000000 Mar 10 13:24:12 Tower kernel: FS: 00001457cb2827c0(0000) GS:ffff88a02d200000(0000) knlGS:0000000000000000 Mar 10 13:24:12 Tower kernel: CS: 0010 DS: 0000 ES: 0000 CR0: 0000000080050033 Mar 10 13:24:12 Tower kernel: CR2: 0000000000000030 CR3: 00000004e736a005 CR4: 0000000000770ee0 Mar 10 13:24:12 Tower kernel: PKRU: 55555554 I tried again with just Plex: Mar 10 13:26:36 Tower kernel: traps: Plex Script Hos[1798] general protection fault ip:1532784d97d0 sp:7fff7c0816e8 error:0 in ld-musl-x86_64.so.1[1532784c9000+53000] And then again with just Sonarr: No errors A third time with just Plex: Mar 10 13:29:15 Tower kernel: Plex Script Hos[7454]: segfault at 0 ip 000014d27435efdb sp 00007fff3e6131d0 error 6 in libpython27.so[14d274236000+179000] Mar 10 13:29:15 Tower kernel: Code: 48 83 c4 20 49 89 c5 48 8b 7d d0 48 ff 0f 75 07 48 8b 47 08 ff 50 30 48 8b 03 4c 39 f8 76 22 48 8d 48 f8 48 89 0b 48 8b 78 f8 <48> ff 0f 75 0a 48 8b 47 08 ff 50 30 48 8b 0b 48 89 c8 4c 39 f9 77 Mar 10 13:29:15 Tower kernel: Plex Script Hos[7529]: segfault at 149b16b8ad50 ip 0000149b16b8ad50 sp 00007fff6ac706b8 error 15 Mar 10 13:29:15 Tower kernel: Code: 00 00 48 c8 02 18 9b 14 00 00 07 00 00 00 00 00 00 00 f3 f3 e7 29 50 4a 87 ee 00 00 00 00 69 6d 70 6f 72 74 09 00 00 00 00 00 <41> 00 00 00 00 00 00 00 48 c8 02 18 9b 14 00 00 06 00 00 00 00 00 And then with most others container except Plex and Sonarr on: Presently with no errors, but going to leave it on. Attaching my docker configurations for both Plex and Sonarr...I just PDFed them, not sure if there is a better way to share. And updated diagnostics zip file too. And just the syslog file for convenience Are the Linux Server Plex or Hotio Sonarr containers known to be problematic? tower-diagnostics-20230310-1433.zip Tower_Plex.pdf Tower_Sonarr.pdf syslog-192.168.1.201.log
-
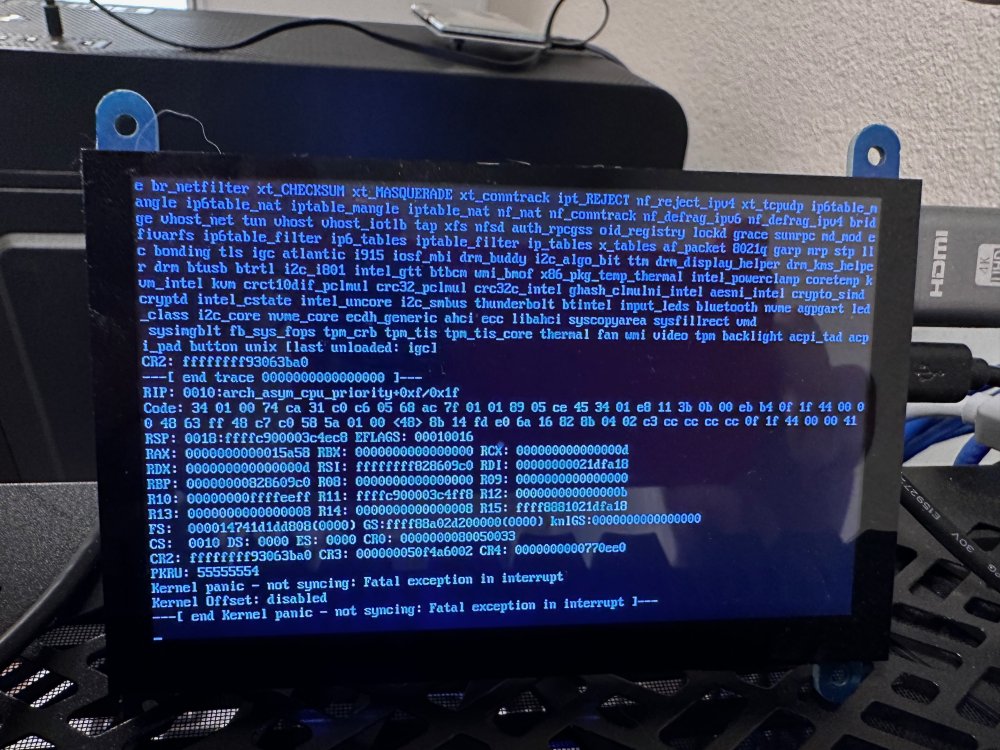
Hi all, I've got a relatively new build, perhaps two months old now, that seems stable with Unraid until I start Docker containers. I'm in the process of trying to start containers one-by-one to see which one is causing the issues. But, is there a better way? I'm trying to set up a remote syslog service to see if I can capture anything meaningful. Here is a picture of a small HDMI monitor I have attached while I had this command running. My hope was I'd catch an error in the act and get something useful. tail -f /var/log/syslog This means little to me. Since I've seen it done here, I'm attaching two difference diagnostics files. The 20230218 file was right before or around the time of a kernel panic (not from the pic above). And the second is just a recent one, though I've made some drive changes. After each panic, which would be an unclean shutdown, I'm letting parity check happen which with my array takes around 24 hours. So it's slow going checking the Dockers. My suspicion is that using the iGPU on multiple containers may have something to do with it? Or a specific version of Plex causing issues? And some of the *arrs have been heavy on my system in this past too. Is there other info I can provide that may narrow the search down? Other things I've tried: I've done a memtest which came back fine after two passes. I've moved all SATA cables other than three to the Mobo onboard ports. I am using one of these PCIe SATA Cards for the two cache SSDs and one drive. I know that's less ideal than a HBA. I recently bought this LSI 9220-8i, which was supposed to be flashed with IT mode (I'm not sure), but I couldn't get Unraid to recognize the drives. I've pulled every other card out besides that PCIe SATA card, the drives, the flash drive, and my mini HDMI screen (powered by rear USB ports). Other basic specs: i9-13900K ASUSTeK COMPUTER INC. ProArt Z690-CREATOR WIFI , Version Rev 1.xx American Megatrends Inc., Version 1720 Corsair DOMINATOR PLATINUM RGB DDR5 128GB (4x32GB) 5200MHz All array drives are WD181KFGX 18TB drives Cache SSDs are Samsung SSD 870 EVO 1TB and Samsung SSD 850 EVO 2TB. My most used cache drive is NVMe: Samsung SSD 980 1TB. tower-diagnostics-20230218-1145.zip tower-diagnostics-20230308-2143.zip