


Fotis Yanchev
Members
-
Joined
-
Last visited
-
Hello, have the Unraid installation for an year - did all the setup back then, but suddenly Wireguard stopped working (was using it to access remotely the shares from my remote windows location) Just checking the docker apps: - Swag - is working no error - CloudflaredTunnel - have a custom domain - remotely I can access the dashboard through my domain - DuckDns - is ok, handling the IP changes - requested static IP from ISP, should be available later today or tomorrow. Wireguard tunnel -- where should it point for local endpoint - local IP of server, custom domain or duckdns address. Read that its good to use Remote tunneled access (have no idea and could not find peer type access explained, so to be able to choose the correct one in different scenarios) I have a router from ISP with 192.168.1.1 mask and my router after the ISP with 192.168.0.1 which gives a dedicated address for the server. Have created a UDP port forward from 192.168.1.1:51820 to 192.168.0.1:51820 I think its correct. Done same for swag, plex and other services. Whatever I do create a peer add it to my phone via file or QR -core, turn it on, it shows green but not able to connect to shares as before and Date received Data send stays at 0. I really do not if the issue is directly with Wireguard setup, or it conflicts with the other docker containers somehow. Would appreciate any help or advice. Thank you in advance for your time and efforts.
-
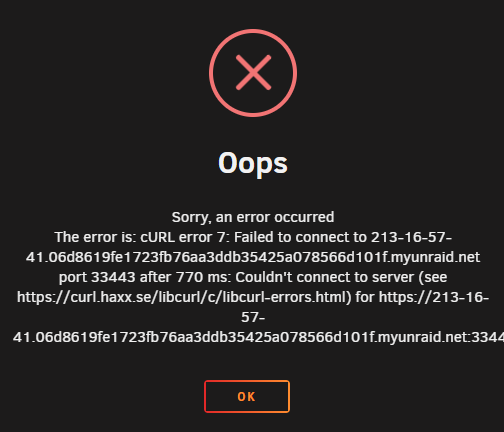
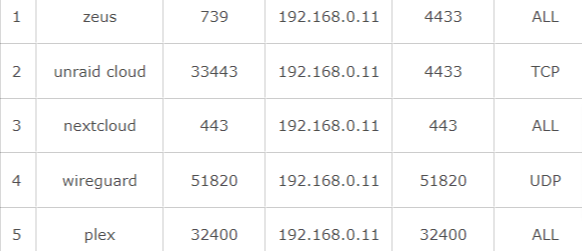
Dear Unraiders, have updated Unraid to current version 6.12.6, have reinstalled the Unraid connect plugin but still can not get it to work and access the server remotely. When I am checking the port-forwarding I get this error: Router is TP-link and the port forwarding are there: I have also DuckDns installed and setup. Attaching also the Unraid Api logs, if those are of help. logs.gz
-
Hi, having my first Unraid since January, after initial setup it was running flawlessly. Unfortunately since last week I have problem accessing the server and apps: - my servers page shows the server online - but clicking on remote access does not open the link. - when on LAN - I can open the link and access the server - some of the apps in Docker work, other not - have not change anything in the last month. Adguard does not open, Nextcloud also not accessible. Radarr, Sonarr and others work. - WireGuard is running on PC - but I can not access the shared folder, which I could last week. - checked router port forwarding - its set as initially. Rebooting machine and routers did not helped either. Do not know where to look for the problem - is it something with DNS or something else. Any advice where to look will be highly appreciated. Thanks in advance. Appreciate your time and efforts. zeus-diagnostics-20220826-0708.zip
-
Thank you both. The 1 days of nvme does not bother me at all, mentioned it in case it causes the problem. Running 6.9.2, will try the solution and if it works I will mark it as solved. Regards
-
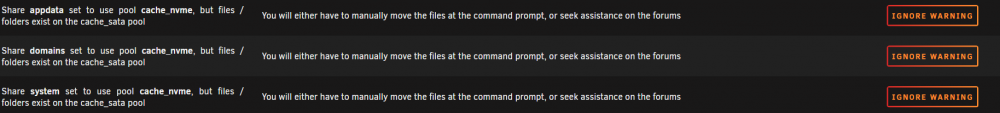
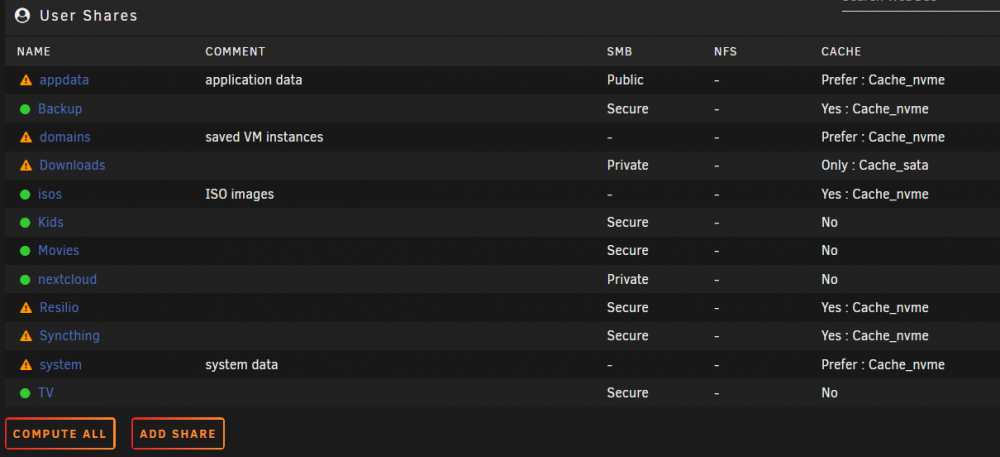
I did not change the pool, 30 days ago it was set as described, cache_sata only for Downloads and the anything else uses cache_nvme. Above errors are from today without any changes made to shares. Will look up in above links.
-
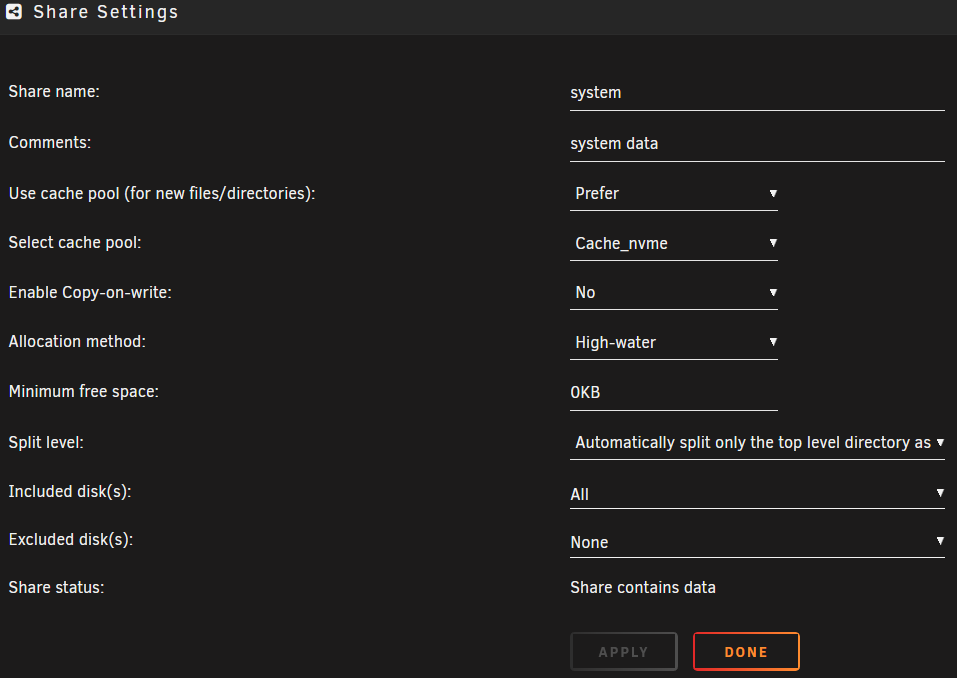
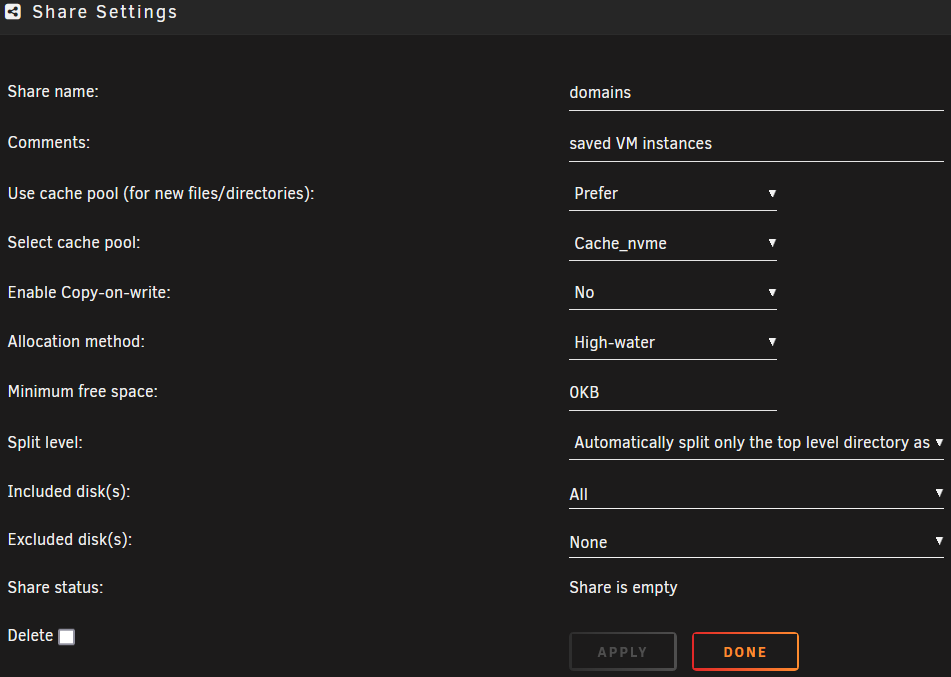
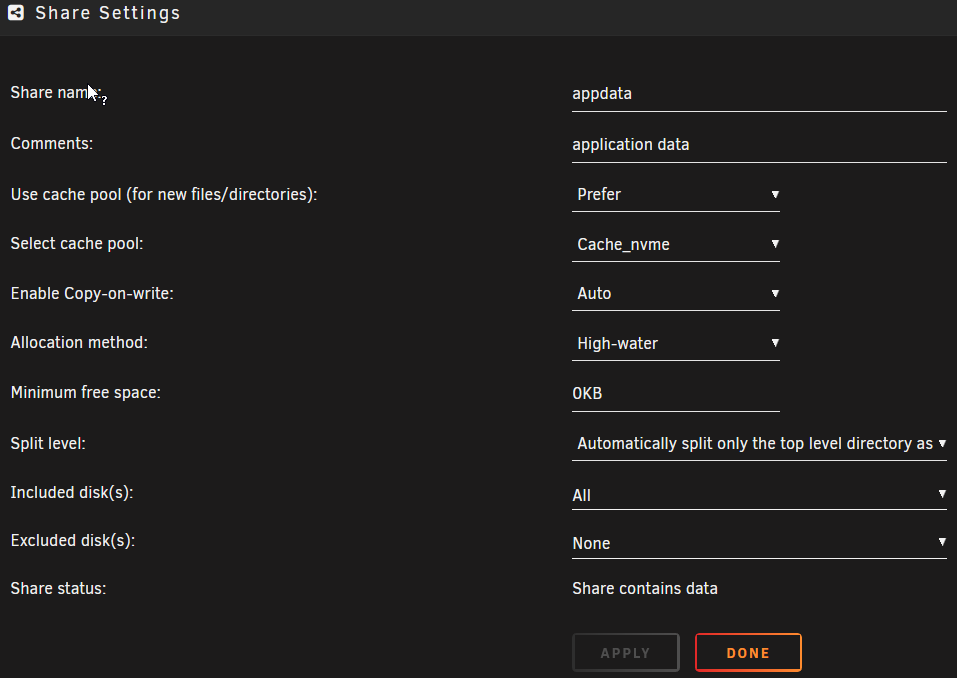
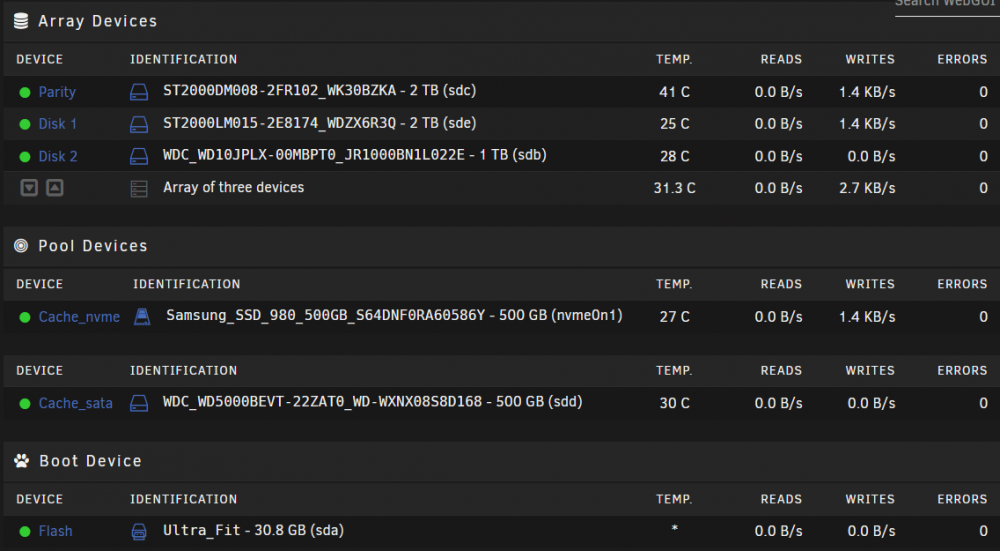
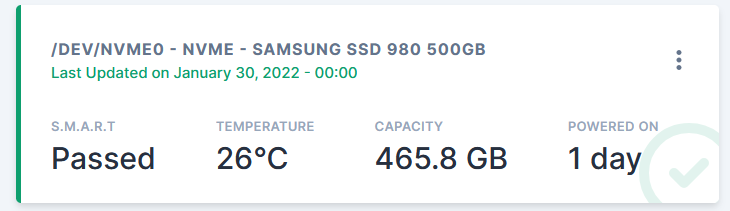
Hi Newbie here, have my first Unraid server for several weeks, all ok until today. The Fix Common errors plugin found errors on appdata, system and domains. Attaching also the share settings for your ref. I have 2 cache pools, one is cache_nvme and one is cache_sata. The cache_sata is used with qbittorent to only download files and when ready are moved to the arrays for storage. Its an old sata I had laying around. The cache_nvme is a new nvme disk used for cache for the rest and also for system chares. Checked Scrutiny and it shows the disk powered on 1 day?!? Although the system is running for 4 weeks. The other new disks in the system show the correct powered on date of 32 days. Any suggestions or ideas are welcomed and highly appreciated. As far as I could check all installed docker apps are OK and running. I do not have any VMs yet.
-
I will test and keep you updated. Its nothing urgent, enjoy of course your vacation. Will restart the server and try again, is there any log that I can run on the AdGuard home Exporter to investigate the reason for stopping after 10-20 sec. Maybe it could be of help for you. Sorry for dummy questions- its my first server with Unraid and just adding some apps/plugins and trying to get to know the whole thing.
-
No only Prometheus, installed both with Grafana just yesterday, will restart unRaid now and start the exporter. I know it takes time to load data in Grafana, but if the exporter stops, it will not load any data.
-
When I start the exporter and before it stops - I open the http://192.168.0.11:9617/metrics and it shows that data is feeding - if I refresh the page several times - lets say after 10-20 sec. it shows site as unreachable, at that time i check the exporter and it shows as stopped. When the exporter is running, at the link there is data visible, but Grafana does load any data - maybe the time the exporter is running is not enough for the data to be collected and shown in Grafana, but as said when the exporter is running the link shows the data, before the exporter stops.


-
Dear Ich777, read the whole treat, having following problem: I am using the Node exporter, its works fine with Grafana and prometheus.yml, feeding data etc. Thank you for your efforts. Secondly I wanted to set up the Adguard Home exporter too - installed it, added the additional line to promethus.yml with IP of the Adguard docker server (same as Unraid but with port 9617. Adguard Home Exporter is set with user pass and IP:3000 and its running. Restarting the Prometheus, when I open WebUI the Adguard home and node exporter are UP, loading 13300 Adguard to Grafana and targer Prometheus but no data is feeded. Going back to Adguard Exporter refreshing the page shows it as stopped - starting it and getting back to WebUI of Prometheus -but it shows the Adguard Home instance down with following error: Get "http://192.168.0.11:9617/metrics": dial tcp 192.168.0.11:9617: connect: connection refused If I restart the Adguard exporter and refresh Prometheus, some times it shows same error and sometimes its up,but Grafana does not show any data. What could be the reason for the Adguard home exporter to keep stopping when I refresh the page - in Backup pluging have set it to Don't stop, as suggested. Adguard Home is running in docker as host. Have Enabled host access in docker settings, although I am not running in a custom network. Would be great if you could suggest a solution. Your efforts and time taken is highly appreciated in advanced. Regards, Fotis


