


seifer
Members
-
Joined
-
Last visited
-
Alright, thank you for your time.
-
I do not have any other disk ATM to try unfortunately. Or at least, not a 12To one.
-
Yes, it is a Red Plus but not exactly the same model than the others, so what can I do? Is there a solution to avoid read errors? Is a RMA with WD possible?
-
I got another error on disk 5, performed a diagnostics.seifernas-diagnostics-20260609-1745.zip
-
Ok, if there is still no controller-related errors, what should I suspect?
-
Hi, 2 read errors, I join the diagnostics file and syslog from 3AM, read errors happened at 1:26AM. seifernas-diagnostics-20260607-1524.zip syslog1.log
-
As I have set the disk 5 on "no device" and put it back on the array, maybe that is the reason why. If I get another error, I will put the syslog again.
-
Here is the syslog. syslog.log
-
I've launched a data rebuild.
-
Hello, I'd like to know if my HDD is to replace or not. Nearly brand new, in the array for maybe 3 or 4 months for now. I still had 1 or 2 read errors on this one, here's the things I did: (HDD is 12To WD Red Plus, WDC_WD120EFGX) updated the PSU from 450W to 850W, I thought it could be the suspect, check cables (both SATA and PSU power), the disk has an isolated power cable from the PSU now, changed the SATA cables order on disks, the other disks are ok, performed an extrended SMART test 3 times, still no errors from the SMART tests Num Test_Description Status Remaining LifeTime(hours) LBA_of_first_error # 1 Extended offline Completed without error 00% 2519 - # 2 Short offline Completed without error 00% 2501 - # 3 Extended offline Completed without error 00% 2390 - # 4 Extended offline Completed without error 00% 1002 - # 5 Extended offline Completed without error 00% 850 - # 6 Extended offline Completed without error 00% 63 - # 7 Short offline Completed without error 00% 0 - the reallocated sector count is 0: # Attribute Name Flag Value Worst Threshold Type Updated Failed Raw Value 1 Raw read error rate 0x002f 200 100 051 Pre-fail Always Never 0 2 Throughput performance 0x0024 100 100 000 Old age Offline Never 0 3 Spin up time 0x0027 150 150 021 Pre-fail Always Never 13466 4 Start stop count 0x0032 100 100 000 Old age Always Never 7 5 Reallocated sector count 0x0033 200 200 140 Pre-fail Always Never 0 7 Seek error rate 0x002e 100 100 000 Old age Always Never 0 8 Seek time performance 0x0024 100 100 000 Old age Offline Never 0 9 Power on hours 0x0032 097 097 000 Old age Always Never 2590 (3m, 18d, 22h) 10 Spin retry count 0x0032 100 100 000 Old age Always Never 0 11 Calibration retry count 0x0032 100 100 000 Old age Always Never 0 12 Power cycle count 0x0032 100 100 000 Old age Always Never 7 192 Power-off retract count 0x0032 200 200 000 Old age Always Never 1 193 Load cycle count 0x0032 200 200 000 Old age Always Never 16 194 Temperature celsius 0x0022 114 112 000 Old age Always Never 38 196 Reallocated event count 0x0032 200 200 000 Old age Always Never 0 197 Current pending sector 0x0032 200 200 000 Old age Always Never 0 198 Offline uncorrectable 0x0030 100 100 000 Old age Offline Never 0 199 UDMA CRC error count 0x0032 200 200 000 Old age Always Never 0 200 Multi zone error rate 0x0008 100 100 000 Old age Offline Never 0 SMART error log: ATA Error Count: 6 (device log contains only the most recent five errors) CR = Command Register [HEX] FR = Features Register [HEX] SC = Sector Count Register [HEX] SN = Sector Number Register [HEX] CL = Cylinder Low Register [HEX] CH = Cylinder High Register [HEX] DH = Device/Head Register [HEX] DC = Device Command Register [HEX] ER = Error register [HEX] ST = Status register [HEX] Powered_Up_Time is measured from power on, and printed as DDd+hh:mm:SS.sss where DD=days, hh=hours, mm=minutes, SS=sec, and sss=millisec. It "wraps" after 49.710 days. Error 6 occurred at disk power-on lifetime: 2588 hours (107 days + 20 hours) When the command that caused the error occurred, the device was active or idle. After command completion occurred, registers were: ER ST SC SN CL CH DH -- -- -- -- -- -- -- 40 43 00 20 81 2f 40 Error: UNC at LBA = 0x002f8120 = 3113248 Commands leading to the command that caused the error were: CR FR SC SN CL CH DH DC Powered_Up_Time Command/Feature_Name -- -- -- -- -- -- -- -- ---------------- -------------------- 60 08 98 b0 80 2f 40 08 20:21:51.601 READ FPDMA QUEUED 60 08 90 d0 7f 2f 40 08 20:21:51.600 READ FPDMA QUEUED 60 08 88 a8 7f 2f 40 08 20:21:51.600 READ FPDMA QUEUED 60 08 80 a8 7e 2f 40 08 20:21:51.600 READ FPDMA QUEUED 60 08 78 38 7e 2f 40 08 20:21:51.600 READ FPDMA QUEUED Error 5 occurred at disk power-on lifetime: 2538 hours (105 days + 18 hours) When the command that caused the error occurred, the device was active or idle. After command completion occurred, registers were: ER ST SC SN CL CH DH -- -- -- -- -- -- -- 40 43 00 40 71 2f 40 Error: UNC at LBA = 0x002f7140 = 3109184 Commands leading to the command that caused the error were: CR FR SC SN CL CH DH DC Powered_Up_Time Command/Feature_Name -- -- -- -- -- -- -- -- ---------------- -------------------- 60 08 b0 b8 6f 2f 40 08 1d+16:46:15.578 READ FPDMA QUEUED 60 08 a8 90 6c 2f 40 08 1d+16:46:15.573 READ FPDMA QUEUED 60 10 a0 10 6b 2f 40 08 1d+16:46:15.572 READ FPDMA QUEUED 60 08 98 a8 6a 2f 40 08 1d+16:46:15.571 READ FPDMA QUEUED 60 08 90 78 69 2f 40 08 1d+16:46:15.571 READ FPDMA QUEUED Error 4 occurred at disk power-on lifetime: 2501 hours (104 days + 5 hours) When the command that caused the error occurred, the device was active or idle. After command completion occurred, registers were: ER ST SC SN CL CH DH -- -- -- -- -- -- -- 40 43 00 68 88 2f 40 Error: UNC at LBA = 0x002f8868 = 3115112 Commands leading to the command that caused the error were: CR FR SC SN CL CH DH DC Powered_Up_Time Command/Feature_Name -- -- -- -- -- -- -- -- ---------------- -------------------- 60 08 50 a8 7c 2f 40 08 03:21:53.707 READ FPDMA QUEUED 60 08 30 c0 78 2f 40 08 03:21:53.701 READ FPDMA QUEUED 60 08 28 b0 78 2f 40 08 03:21:53.701 READ FPDMA QUEUED 60 08 20 a0 78 2f 40 08 03:21:53.701 READ FPDMA QUEUED 60 10 78 98 77 2f 40 08 03:21:53.700 READ FPDMA QUEUED Error 3 occurred at disk power-on lifetime: 2494 hours (103 days + 22 hours) When the command that caused the error occurred, the device was active or idle. After command completion occurred, registers were: ER ST SC SN CL CH DH -- -- -- -- -- -- -- 40 43 00 00 83 2f 40 Error: UNC at LBA = 0x002f8300 = 3113728 Commands leading to the command that caused the error were: CR FR SC SN CL CH DH DC Powered_Up_Time Command/Feature_Name -- -- -- -- -- -- -- -- ---------------- -------------------- 60 08 d0 a8 7c 2f 40 08 2d+03:45:35.299 READ FPDMA QUEUED 60 08 c8 c0 78 2f 40 08 2d+03:45:35.290 READ FPDMA QUEUED 60 08 c0 b0 78 2f 40 08 2d+03:45:35.290 READ FPDMA QUEUED 60 08 b8 a0 78 2f 40 08 2d+03:45:35.290 READ FPDMA QUEUED 60 08 b0 a0 77 2f 40 08 2d+03:45:35.286 READ FPDMA QUEUED Error 2 occurred at disk power-on lifetime: 2328 hours (97 days + 0 hours) When the command that caused the error occurred, the device was active or idle. After command completion occurred, registers were: ER ST SC SN CL CH DH -- -- -- -- -- -- -- 40 43 00 90 85 2f 40 Error: UNC at LBA = 0x002f8590 = 3114384 Commands leading to the command that caused the error were: CR FR SC SN CL CH DH DC Powered_Up_Time Command/Feature_Name -- -- -- -- -- -- -- -- ---------------- -------------------- 60 08 90 78 83 2f 40 08 44d+22:44:12.319 READ FPDMA QUEUED 60 08 78 e8 82 2f 40 08 44d+22:44:12.317 READ FPDMA QUEUED 60 08 88 d8 82 2f 40 08 44d+22:44:12.316 READ FPDMA QUEUED 60 10 78 b0 82 2f 40 08 44d+22:44:12.316 READ FPDMA QUEUED 60 10 80 68 82 2f 40 08 44d+22:44:12.315 READ FPDMA QUEUEDI linked the SMART report. If someone has already encountered this, do you know if this is will be ok for a warranty exchange with WD? Thank you. seifernas-smart-20260604-1549.zip
-
It seems that I figured out what was the problem. It's been two whole days without any freeze at all, I have a USB dongle to reach 2.5gbps because my mobo only hits 1gbps. Once the realtek plugin was removed, no more crashes for now. I hope this will continue this way.
-
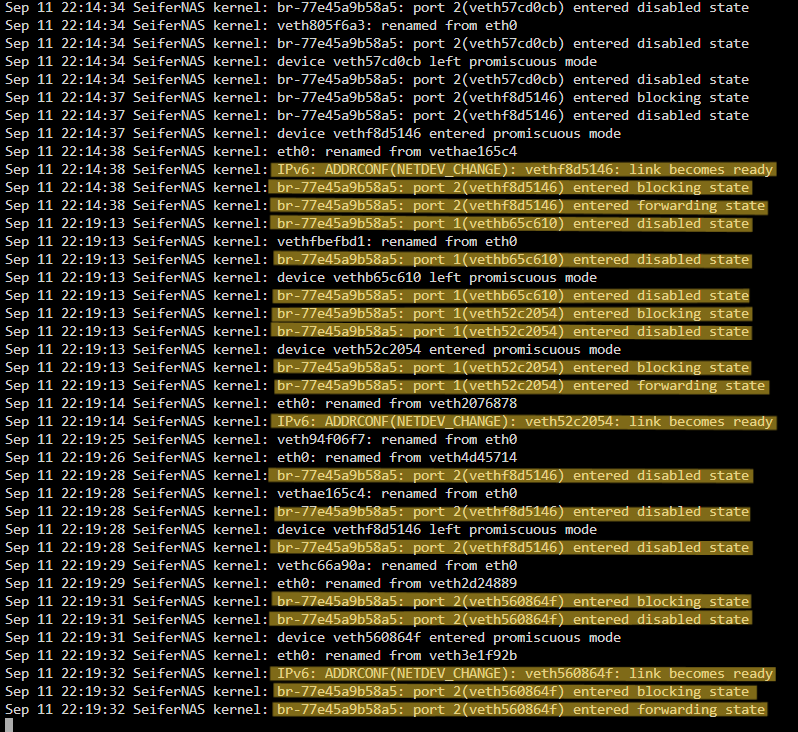
Hi, I had a new freeze today, at 10:40, I had to restard the system because even SSH was unreacheable. But I cannot notice why in the syslog. These are the lines just before restarting the system, I do not see anything weird though : Sep 11 10:42:44 SeiferNAS kernel: mdcmd (36): set md_write_method 1 Sep 11 10:42:44 SeiferNAS kernel: Sep 11 10:42:44 SeiferNAS root: Delaying execution of fix common problems scan for 10 minutes Sep 11 10:42:45 SeiferNAS emhttpd: /usr/local/emhttp/plugins/user.scripts/backgroundScript.sh "/tmp/user.scripts/tmpScripts/GPU Idle/script" >/dev/null 2>&1 Sep 11 10:42:45 SeiferNAS emhttpd: Starting services... Sep 11 10:42:45 SeiferNAS emhttpd: shcmd (55): /etc/rc.d/rc.samba restart Sep 11 10:42:45 SeiferNAS wsdd2[5693]: 'Terminated' signal received. Sep 11 10:42:45 SeiferNAS winbindd[5696]: [2024/09/11 10:42:45.023962, 0] ../../source3/winbindd/winbindd_dual.c:1950(winbindd_sig_term_handler) Sep 11 10:42:45 SeiferNAS winbindd[5698]: [2024/09/11 10:42:45.023960, 0] ../../source3/winbindd/winbindd_dual.c:1950(winbindd_sig_term_handler) Sep 11 10:42:45 SeiferNAS winbindd[5696]: Got sig[15] terminate (is_parent=1) Sep 11 10:42:45 SeiferNAS winbindd[5698]: Got sig[15] terminate (is_parent=0) Sep 11 10:42:45 SeiferNAS winbindd[5943]: [2024/09/11 10:42:45.024016, 0] ../../source3/winbindd/winbindd_dual.c:1950(winbindd_sig_term_handler) Sep 11 10:42:45 SeiferNAS winbindd[5943]: Got sig[15] terminate (is_parent=0) Sep 11 10:42:45 SeiferNAS wsdd2[5693]: terminating. I joined the syslog as usual. EDIT : I have checked the port on my docker, and 2 of them had the same port, so I fixed it, it has runned smoothly for some hours and it crashed again, but I have been able to access the GUI so I performed a clean reboot but before that I downloaded the diagnostics file. I have been able to access the log while the crash was on going, and I kept an eye over the syslog, and I notice when the following lines appeared, this have caused the crash, so I think it is network related. Is it? I noticed also that in my Unifi Network Controller Docker, these lines appeared too : syslog.log seifernas-diagnostics-20240911-2220.zip updated syslog.log

-
Ok, right, I am actually setting this off, I will see if the crashes will come back or not. Thanks for help!
-
I just have purchased a Ugreen USB device to get my NAS to 2,5gbps, installed the plugon realtek to get the drivers. But, as I read on some topics, I have the bonding option enabled, could this affect the network stability? I read that bonding could cause network instability with some network peripherals.
-
So the server once again freezes, here's the logs. syslog.log


