


TexTra
Members
-
Joined
-
Last visited
Everything posted by TexTra
-
Additionally, I disabled and enabled the docker in the settings. I restarted pihole, pihole exporter and prometheus as well. But unfortunately without changes.
-
It was just for example. The following is what I get from the exporter. Seems that these are the standard metrics from prometheus, right?: # HELP go_gc_duration_seconds A summary of the pause duration of garbage collection cycles. # TYPE go_gc_duration_seconds summary go_gc_duration_seconds{quantile="0"} 2.692e-05 go_gc_duration_seconds{quantile="0.25"} 2.9898e-05 go_gc_duration_seconds{quantile="0.5"} 8.6085e-05 go_gc_duration_seconds{quantile="0.75"} 9.2229e-05 go_gc_duration_seconds{quantile="1"} 0.000146322 go_gc_duration_seconds_sum 0.000465349 go_gc_duration_seconds_count 6 # HELP go_goroutines Number of goroutines that currently exist. # TYPE go_goroutines gauge go_goroutines 13 # HELP go_info Information about the Go environment. # TYPE go_info gauge go_info{version="go1.16.3"} 1 # HELP go_memstats_alloc_bytes Number of bytes allocated and still in use. # TYPE go_memstats_alloc_bytes gauge go_memstats_alloc_bytes 4.585536e+06 # HELP go_memstats_alloc_bytes_total Total number of bytes allocated, even if freed. # TYPE go_memstats_alloc_bytes_total counter go_memstats_alloc_bytes_total 1.7187472e+07 # HELP go_memstats_buck_hash_sys_bytes Number of bytes used by the profiling bucket hash table. # TYPE go_memstats_buck_hash_sys_bytes gauge go_memstats_buck_hash_sys_bytes 1.44732e+06 # HELP go_memstats_frees_total Total number of frees. # TYPE go_memstats_frees_total counter go_memstats_frees_total 30808 # HELP go_memstats_gc_cpu_fraction The fraction of this program's available CPU time used by the GC since the program started. # TYPE go_memstats_gc_cpu_fraction gauge go_memstats_gc_cpu_fraction 9.487412532269557e-06 # HELP go_memstats_gc_sys_bytes Number of bytes used for garbage collection system metadata. # TYPE go_memstats_gc_sys_bytes gauge go_memstats_gc_sys_bytes 4.95464e+06 # HELP go_memstats_heap_alloc_bytes Number of heap bytes allocated and still in use. # TYPE go_memstats_heap_alloc_bytes gauge go_memstats_heap_alloc_bytes 4.585536e+06 # HELP go_memstats_heap_idle_bytes Number of heap bytes waiting to be used. # TYPE go_memstats_heap_idle_bytes gauge go_memstats_heap_idle_bytes 6.0817408e+07 # HELP go_memstats_heap_inuse_bytes Number of heap bytes that are in use. # TYPE go_memstats_heap_inuse_bytes gauge go_memstats_heap_inuse_bytes 5.7344e+06 # HELP go_memstats_heap_objects Number of allocated objects. # TYPE go_memstats_heap_objects gauge go_memstats_heap_objects 6209 # HELP go_memstats_heap_released_bytes Number of heap bytes released to OS. # TYPE go_memstats_heap_released_bytes gauge go_memstats_heap_released_bytes 5.812224e+07 # HELP go_memstats_heap_sys_bytes Number of heap bytes obtained from system. # TYPE go_memstats_heap_sys_bytes gauge go_memstats_heap_sys_bytes 6.6551808e+07 # HELP go_memstats_last_gc_time_seconds Number of seconds since 1970 of last garbage collection. # TYPE go_memstats_last_gc_time_seconds gauge go_memstats_last_gc_time_seconds 1.6481599131176507e+09 # HELP go_memstats_lookups_total Total number of pointer lookups. # TYPE go_memstats_lookups_total counter go_memstats_lookups_total 0 # HELP go_memstats_mallocs_total Total number of mallocs. # TYPE go_memstats_mallocs_total counter go_memstats_mallocs_total 37017 # HELP go_memstats_mcache_inuse_bytes Number of bytes in use by mcache structures. # TYPE go_memstats_mcache_inuse_bytes gauge go_memstats_mcache_inuse_bytes 4800 # HELP go_memstats_mcache_sys_bytes Number of bytes used for mcache structures obtained from system. # TYPE go_memstats_mcache_sys_bytes gauge go_memstats_mcache_sys_bytes 16384 # HELP go_memstats_mspan_inuse_bytes Number of bytes in use by mspan structures. # TYPE go_memstats_mspan_inuse_bytes gauge go_memstats_mspan_inuse_bytes 71536 # HELP go_memstats_mspan_sys_bytes Number of bytes used for mspan structures obtained from system. # TYPE go_memstats_mspan_sys_bytes gauge go_memstats_mspan_sys_bytes 81920 # HELP go_memstats_next_gc_bytes Number of heap bytes when next garbage collection will take place. # TYPE go_memstats_next_gc_bytes gauge go_memstats_next_gc_bytes 7.681904e+06 # HELP go_memstats_other_sys_bytes Number of bytes used for other system allocations. # TYPE go_memstats_other_sys_bytes gauge go_memstats_other_sys_bytes 922720 # HELP go_memstats_stack_inuse_bytes Number of bytes in use by the stack allocator. # TYPE go_memstats_stack_inuse_bytes gauge go_memstats_stack_inuse_bytes 557056 # HELP go_memstats_stack_sys_bytes Number of bytes obtained from system for stack allocator. # TYPE go_memstats_stack_sys_bytes gauge go_memstats_stack_sys_bytes 557056 # HELP go_memstats_sys_bytes Number of bytes obtained from system. # TYPE go_memstats_sys_bytes gauge go_memstats_sys_bytes 7.4531848e+07 # HELP go_threads Number of OS threads created. # TYPE go_threads gauge go_threads 11 # HELP process_cpu_seconds_total Total user and system CPU time spent in seconds. # TYPE process_cpu_seconds_total counter process_cpu_seconds_total 0.24 # HELP process_max_fds Maximum number of open file descriptors. # TYPE process_max_fds gauge process_max_fds 40960 # HELP process_open_fds Number of open file descriptors. # TYPE process_open_fds gauge process_open_fds 10 # HELP process_resident_memory_bytes Resident memory size in bytes. # TYPE process_resident_memory_bytes gauge process_resident_memory_bytes 2.1041152e+07 # HELP process_start_time_seconds Start time of the process since unix epoch in seconds. # TYPE process_start_time_seconds gauge process_start_time_seconds 1.64815964972e+09 # HELP process_virtual_memory_bytes Virtual memory size in bytes. # TYPE process_virtual_memory_bytes gauge process_virtual_memory_bytes 1.356128256e+09 # HELP process_virtual_memory_max_bytes Maximum amount of virtual memory available in bytes. # TYPE process_virtual_memory_max_bytes gauge process_virtual_memory_max_bytes 1.8446744073709552e+19 # HELP promhttp_metric_handler_requests_in_flight Current number of scrapes being served. # TYPE promhttp_metric_handler_requests_in_flight gauge promhttp_metric_handler_requests_in_flight 1 # HELP promhttp_metric_handler_requests_total Total number of scrapes by HTTP status code. # TYPE promhttp_metric_handler_requests_total counter promhttp_metric_handler_requests_total{code="200"} 32 promhttp_metric_handler_requests_total{code="500"} 0 promhttp_metric_handler_requests_total{code="503"} 0 Now I've waited ca. 20 min. How long does it take before the metrics show up normally? Yes, I doubled checked it again right now. I took it from the pihole Settings > API/Web Interface > Show API Token and copied the RAW API Token into the pihole exporter configuration. I wanted just to be on the safe side
-
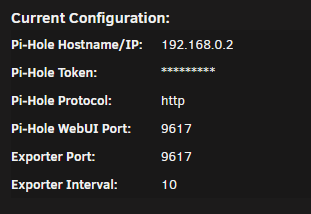
Hello @ich777, i've set up pihole for unraid and it is running. I set the network type to "custom:br0" and gave pihole a fixed ip adress (192.168.0.2). My unraids IP is 192.168.0.161 Now I installed your pihole exporter and enabled "Host access to custom networks" as mentioned by you. In the pihole exporter settings I set the configuration as below: I added follwing lines to the prometheus.yaml: - job_name: 'pihole' static_configs: - targets: ["192.168.0.161:9617"] # Pi-Hole In Prometheus I can see that the pihole exporter is up and running: But when I'm checking the metrics, there are no "pihole_*" metrics available. Instead there are the same metrics I get from the node exporter (i.e): # HELP go_goroutines Number of goroutines that currently exist. # TYPE go_goroutines gauge go_goroutines 12 # HELP go_info Information about the Go environment. # TYPE go_info gauge go_info{version="go1.16.3"} 1 # HELP go_memstats_alloc_bytes Number of bytes allocated and still in use. # TYPE go_memstats_alloc_bytes gauge go_memstats_alloc_bytes 4.92672e+06 # HELP go_memstats_alloc_bytes_total Total number of bytes allocated, even if freed. # TYPE go_memstats_alloc_bytes_total counter go_memstats_alloc_bytes_total 5.724904e+06 # HELP go_memstats_buck_hash_sys_bytes Number of bytes used by the profiling bucket hash table. # TYPE go_memstats_buck_hash_sys_bytes gauge Then I changed the IP in the prometheus.yaml file from the unraid IP (192.168.0.161) to the pihole IP (192.168.0.2). But then prometheus runs into a "connection refused" error: What am I missing here? Greetings


-
hi @saber1. danke dir für die schnelle antwort. den thread hatte ich gar nicht gesehen. Mit dem Script passt das nun super!
-
Hallo zusammen, ich habe nochmal ein wenig ausprobiert und bin schließlich auf einen Teil der Lösung gestoßen: Es war noch ein User in Unraid angelegt, mit welchem ich testweise in Windows die Shares als Netzlaufwerk verbunden hatte. Der User stimmte allerdings NICHT mit meinem lokalen Windows User überein. Scheinbar kamen sich beide irgendwie in die Quere, denn als ich diesem User in Unraid alle Rechte auf die Shares entzogen habe, kam ich auch nicht mehr in Windows über "Netzwerk" (und somit mit meinem neu angelegten Unraid User) auf die Shares. Windows versuchte die Anmeldung immer mit dem User der Netzlaufwerke (der allerdings keine Rechte mehr hatte) Diesen User habe ich nun in Windows gelöscht und dessen Netzlaufwerke getrennt (https://itler.net/windows-gespeicherte-netzwerkpasswoerter-loeschen/) Der Zugriff über "Netzwerke" klappt nun wie gewünscht. Allerdings bin ich noch etwas unzufrieden, da ich die Shares auf die zugegriffen werden soll in Unraid grundsätzlich auf "Export = Yes" setzen muss, ansonsten werden sie in Windows nicht angezeigt. Allerdings hat nicht jeder User auf jeden Share Zugriff und ich würde den Usern gerne nur die Shares anzeigen lassen auf welche sie auch Zugriff haben. Hat da jemand eine Idee? Oder ist das nur mit Netzlaufwerken möglich? Viele Grüße
-
Hallo liebe Unraid Gemeinde, ich bin gerade dabei verschiedene User auf meinem Unraid Server anzulegen. Da alle Clients per Windows 10 zugreifen, habe ich die User in Unraid mit deren Windows 10 Usernamen und Passwort angelegt. Vorteil ist, dass sich die User in Windows dann die Shares nicht einbinden müssen, sondern über "Netzwerk" auf die Shares zugreifen können. Ich habe nun alle entsprechenden Shares unter "SMB Security Settings" auf Export = Yes gesetzt, da mit Yes (hidden) die Shares in Windows nicht sichtbar wären. Security steht auf Private. Die Userrechte unter "SMB User Access" hatte ich bis dahin nicht vergeben, also alles auf "No Access". Der Zugriff in Windows auf die Shares ist aber für alle User trotzdem möglich. So kann ich den Usern ja ausschließlich Zugriff auf alle oder keine Shares gewähren. Weiß von euch da jemand mehr? Habe ich irgend etwas vergessen einzustellen oder ist das schlicht nicht möglich? Danke schon mal und viele Grüße


