





Jebberino84
Members
-
Joined
-
Last visited
-
I apologize for not immediately answering a couple weeks ago when you asked about which ones were persistant syslogs. I had a super busy weekend that week and things have only gotten more hectic here with other non-technical home issues that needed to be taken care of before we hosted for the holidays this year. Again, I do appreciate your help. I believe the logs for the previous session (2025-11-18_0157) might have been the one that should have covered the issue because the new logs that started 2025-11-08_2129 would have been created after the forced reboot, but unfortunately I'm not 100% sure since it's been so long and because as I mentioned in my post on November 7th, I'm pretty sure the syslog stops logging information when the server crashes with the crond error. I planned on waiting until the system crashed again with the same crond error before posting so we had multiple instances of data to help distinguish what was happening, but the next time it crashed was last night November 20th and when I rebooted I was met with an error at the top of my screen that said "your flash drive is corrupted or offline". Because of this Flash Drive Error and because I suspected this possible issue and made sure to purchase a legitimate San Disk USB and not use some I got off Amazon, I decided to replace the USB last night and forgot to look for any diags or logs. I have it back up and running on the new flash drive as of this morning, and if the system crashes again with the crond error, I'll copy any diags and syslogs I can and post again.
-
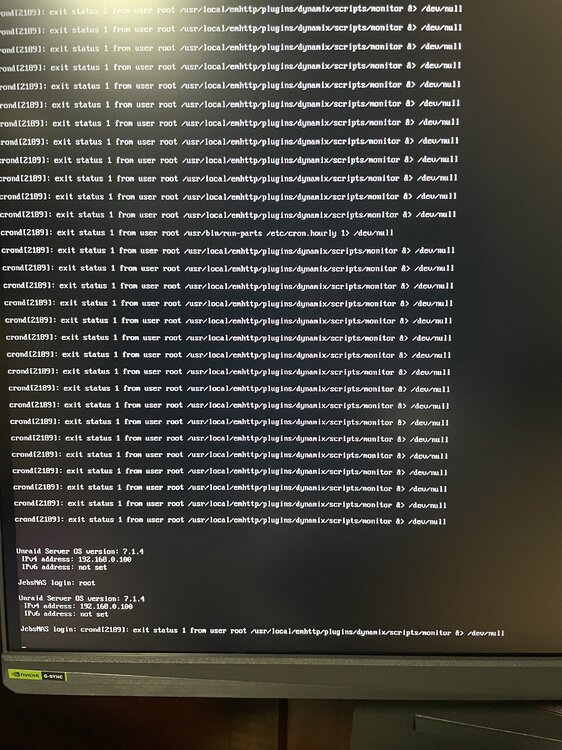
Unfortunately, you were right! This time it didn't even last a day and a half before the server started acting up again. Attached are the latest diags, syslogs, and a pic of what I'm seeing when connected directly to the Unraid server. Trying to log in does nothing but cause the login message to repeat and ask for credentials again. The Crond error is the same one I've been seeing since I first started posting here. Any help or guidance would be appreciated. To recap, I've replaced RAM, I've replaced the HBA, I've done smart tests, I've done mem tests, I've taken out the GPU and then put it back in, I've completely restored my NAS back to a fresh install of Unraid. Please let me know if you are able to find anything that might give a clue as to what is causing this. I'm in way over my head here. health-20251107-104301.log health-20251107-104413.log health-20251108-212322.log syslog_2025-11-08-2129 syslog-previous_2025-11-08-0157 jebsnas-diagnostics-20251108-2125.zip
-
Syslog server is running, but I'm not too confident anything will be shown in it since I included it in my past replies on this post, and it seems to quit logging when the system stops responding. I also included an extra script in my user scripts that will log the status of the networks to see if they are a contributing factor. I'll attach script below. I really am at a loss here since nothing seems to be logged or working when the server does this. I don't know what else to do that I haven't already tried. I've done drive tests, mem tests, changed out the LSI SAS HBA with a brand new one, etc. Nothing seems to log or provide a clue as to what the real underlying issue is. I've also updated BIOS so just about every piece of hardware has also been either tested, updated or replaced. For now, I guess I'll just wait until it crashes again and then I'll post Diags, Syslogs and anything else I can think of here to start over again. #!/bin/bash TS=$(date +"%Y%m%d-%H%M%S") OUT="/boot/logs/health-$TS.log" { echo "=== $TS ===" uptime date df -h df -i free -m ip -br addr # show docker network mode and running containers docker network ls docker ps --format "table {{.Names}}\t{{.Status}}\t{{.Networks}}" # recent kernel and syslog lines dmesg | tail -n 100 tail -n 200 /var/log/syslog } >> "$OUT" 2>&1
-
Hi all, I waited a while to re-post here because I did not want to bump an old thread without substance. Over the past 4–5 months I moved my data to a temporary NAS, which is now serving as my backup NAS in case I run into future issues, and I completely restored my Unraid server from scratch. I rebuilt the machine about 3–3.5 months ago and have since moved the data back. Since that time I have seen the same issue recur: the Web GUI and the directly connected CLI become unresponsive. This has happened about 3–4 times, so roughly once per month. Each time, just like before, I perform a hard reboot and the server acts like nothing was wrong until about a month later when the same issue returns. This morning it happened again, and I finally turned to AI to comb through my diagnostics and logs to help me find an issue. To my surprise, it found something that makes me hopeful. According to ChatGPT, “Docker is creating a macvlan network on br0. Intermittent GUI lockups and total network loss on Unraid are very commonly caused by macvlan call traces when containers have their own IPs on the same LAN as the host. The system can stay up for days or weeks, then suddenly drop the web GUI and SSH. Reboot fixes it until the next trace.” It believes this because Nginx logged “open socket #... left in connection ... aborting” and, according to AI, “Given your symptoms and the macvlan line, the most likely root cause is macvlan call traces.” Based on that, I changed the Docker setting “Docker custom network type” from “macvlan” to “ipvlan.” So far this has not caused any issues with my Docker containers or other applications running on this Unraid server. Thanks again to JorgeB for your help a few months ago. I was completely lost myself, so even if we did not find the issue at the time, you gave me direction and made me feel like I was doing something to attempt to fix it and you may have kept me from going completely bald pulling my hair out! I see your posts on this forum often and I appreciate your help. Hopefully I will go another few months and recognize that it is not happening anymore, and then remember to post here again to let everyone know whether this fix did or did not work. If you do not see another post on this thread, it is likely because this VLAN change for Docker services did finally fix the issue and I just forgot to repost. If anyone else has a similar issue, feel free to try this out.
-
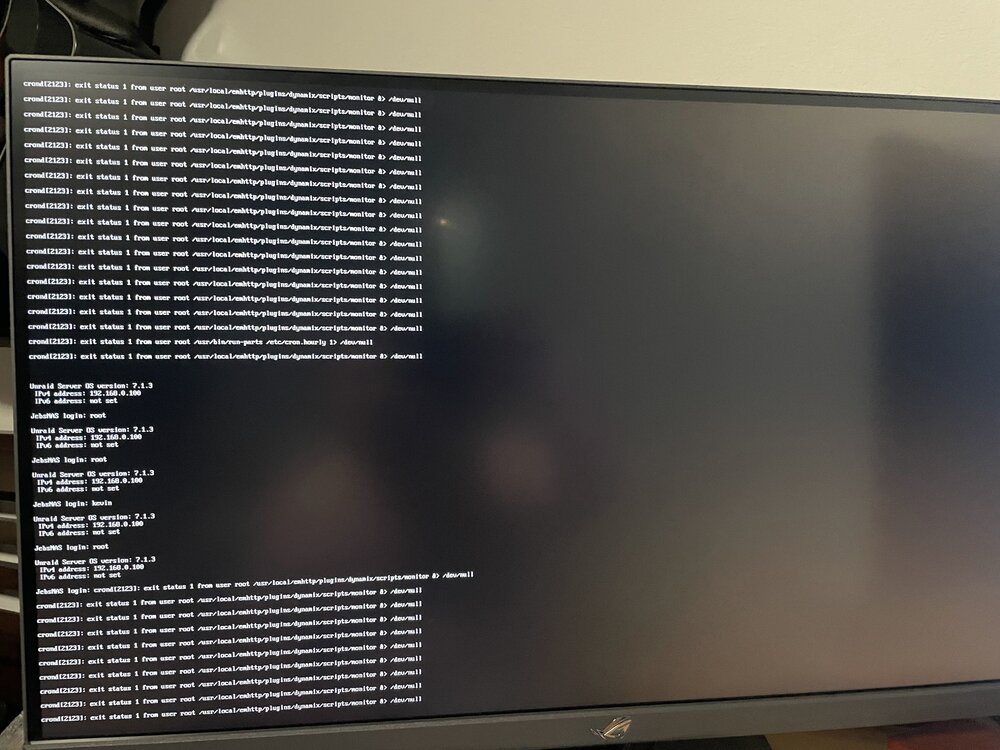
Hi, JorgeB! I did have the crond error happen again today. Attached below should be my Syslog, my diags, and a pic of the login screen showing that I am again unable to log into the server, even when physically attached via KVM. Looks like the logs stopped last night around 5:09 PM after some sort of nginx alert that caused an "abort". This seems to point as to why I am unable to reach the web GUI, but it doesn't tell me why I am then unable to log into the server, even via a direct KVM connection. The nginx error wouldn't bother me so much if it didn't cause my whole server to go down. Yesterday, the server had been up for a few days, so I felt confident starting to build the parity for a second parity disk. (disk WP026KC5) I figured that since the server was seemingly running fine again, and was able to complete it's own parity check, that this would be possible. I noticed that I was having the original "crond" error again this morning, and although I was unable to access the server to see shares or to login via Putty or KVM, I could see that the physical lights I have on my server that blink to show when disks were being accessed were blinking. I also noticed that I was able to access media via my plex server which runs on a docker container. I figured I'd let the computer keep running until I didn't see the lights blinking anymore, which would hopefully signify that the parity for the new drive was finally complete. The lights stopped blinking today a little after noon. I waited even longer and rebooted the server around 1:15 PM but unfortunately, the parity didn't take so I put the new disk back into unassigned devices. Please let me know if you guys can find what exactly is causing the issues with my server, and why it doesn't allow me to log in. Thanks once again for your time! jebsnas-diagnostics-20250625-1342.zip syslog-192.168.0.100.log
-
It figures that now I have someone else's attention looking at this, nothing is happening. I'm now on day 2 of not having to reboot the server when I wake up in the morning. It had been happening every night and even sometimes during the day too for the past ~2 weeks, and now all the sudden it's working fine. Sheesh! Just for the record, attached below is a pic of the parity check which finally completed. 0 errors and it took more than 22 hours! I'll make sure to update here the next time the server goes offline as long as it happens within the next 1-2 weeks. As a separate question, I'm not sure about the etiquette of this, but if it takes longer than 1-2 weeks for the server to drop offline by itself again, should I start a new thread or just continue commenting on this thread again?

-
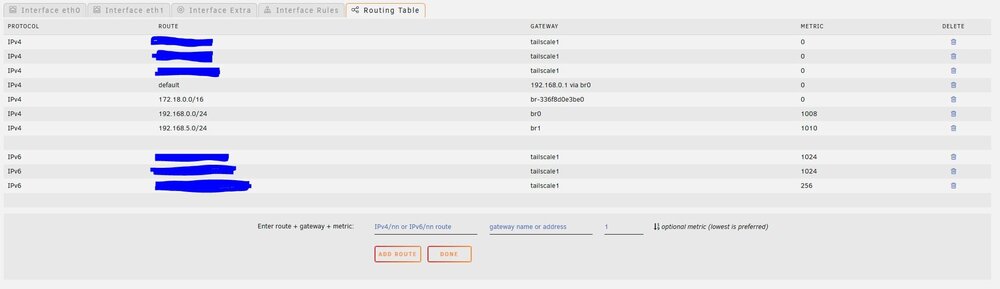
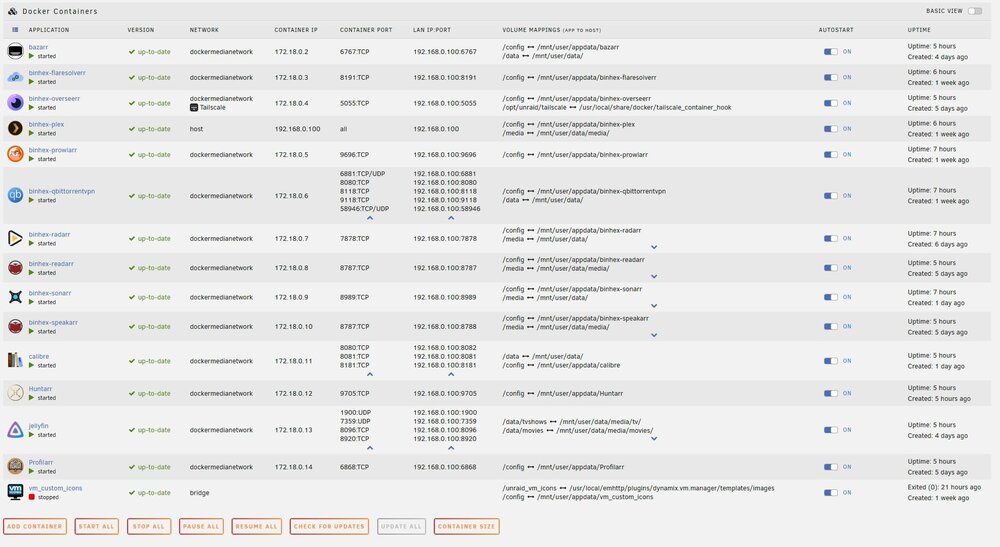
Got it. The Syslog should be attached below. I should first mention that this is the first morning in a long time where I woke up and didn't have to reboot the server because it stopped working. I will continue to monitor and troubleshoot as I don't believe the problem just fixed itself, but this is a refreshing change of pace. Regarding the Syslog, Something I did see on the Syslog server that seemed interesting, is that there are a lot of logs for: JebsNAS kernel: br-336f8d0e3be0: port 1(veth6d2d15e) entered blocking state JebsNAS kernel: br-336f8d0e3be0: port 1(veth6d2d15e) entered disabled state This doesn't entirely make sense to me, and it doesn't really explain the issues I've been having. I believe this to be a completely unrelated issue to the original issue I've been having. I'll explain my logic below. Please let me know if (or more likely where) my logic is flawed. If there is a fix for this issue which I'm not seeing, please let me know as I'd still like to stop those errors. However, I'm not entirely convinced fixing these blocking/disabled networking errors will fix my original issue. I do have a PCIe network card installed on my machine, and I have 2 ethernet cords attached to my server from my L3 switch/router. I have one cable attached to the motherboard and another attached to the network card. I see how these could originally cause STP errors, however, I set these up so the motherboard (and thus my Unraid server) is on my 192.168.0.0/24 network, and the PCIe NIC is attached to a 192.168.5.0/24 network. The network card connection I use to passthrough traffic to my Windows VM running Blue Iris. I see how these could have had some issues with Spanning Tree Protocol when I first connected them, but now that they are on different networks, I don't believe this would be what's causing my issue. Furthermore when I look at the Network Settings, I can see that the (blocking/disabled state) issue doesn't seem to be about the two cords, it seems to be with the internal loopback address. The logs mention br-336f8d0e3be0, which network settings says is related to the 172.18.0.0/16 route. Knowing the loopback address was a possible issue, this made me think about my docker containers since they are all on a network I created for them and would constantly speak to each other. Most of the logs here seem to be related to the docker containers anyway. I've also posted a picture of my docker tab after expanding all of the container and IP port columns. In it you can see that the dockers all have separate port numbers and are on their own "dockermedianetwork" network so they can speak to each other. The only one that wasn't setup this way was the Plex docker. I left Plex with this original configuration when I added all the other docker apps a while back, but just in case, after posting this I will be changing Plex to also use the dockermedianetwork network too. I'll see if this causes any other issues with Plex access and/or with fixing the blocking/disabled state errors on my next reboot. As mentioned above, I'm not convinced my original issue would be fixed by stopping whatever is causing the blocking/disabled state issue. This is because the error I was getting in my original post for this thread did not only affect the network, but the error also was affecting the server itself. When I plug in via KVM, I am not able to log in and also unable to perform shutdown or powerdown or any other commands since I can't log in. I don't see how a network issue could do this if I was bypassing the network with KVM? Thanks again for looking. If you see anything else that might require my attention, please let me know! Also, I will post another Syslog and Diags when the server goes down again. syslog-192.168.0.100.log
-
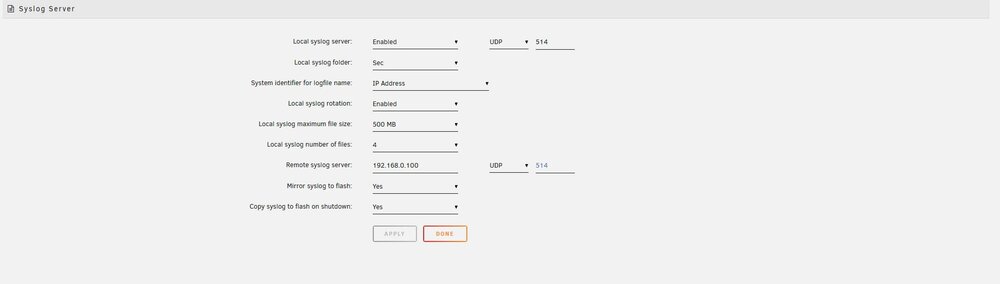
Sorry it's taken me so long to respond here. My server is now doing something somewhat new. It stopped allowing me to connect via the web GUI early this morning, probably 4-5 hours ago. But at that time I was able to login via a KVM connected directly to the server. I was even able to display results for ifconfig. However, I let the server continue to run in this state, and my wife even watched a Plex movie which I run in Docker from this server. I also have a Blue Iris program running from a Windows 10 VM I have in this server, but I am unable to connect to the VM. I logged out of the server a few hours ago when the GUI went down, and I just tried logging in again but now that didn't work either. Since I am unable to log in, it also won't let me use powerdown, or shutdown commands so it seems I had to reboot the server manually again with a hard press of the power button. This is a similar issue to the one I originally reported because I am unable to connect via web GUI interface, I am able to ping the machine, and I am also unable to login or powerdown the machine, but it is different because I am not getting the repeating crond error I originally described, and I am also still able to use at least one of the docker containers. I figured I'd mention this in case the diags do show what's going on. Attached should be the diags after a reboot after losing GUI as requested above. Please let me know if there is anything else I can give or do to help track down this issue. Thanks again for your time and help! And finally as kind of a side note, I thought I already had the Syslog server settings enabled and setup correctly in my previous diags. I attached a photo here of my current settings, if this is incorrect, please let me know. jebsnas-diagnostics-20250621-1254.zip
-
Hello again! Attached are my diags after clicking "reset" button in the stats section and then rebooting after that finished. Thanks again for your time! Please let me know if there is anything else I can do to help track down this issue. jebsnas-diagnostics-20250620-1511.zip
-
Hi, JorgeB! Ahhh. This is where I misunderstood. Totally my fault. I thought by the term "pool" we were talking about the group of array devices since that is usually what I think of when I think of Unraid. I should have known we were talking about the "cache" pool since that's the only thing in Unraid referred to as a pool. Thank you for clearing this up for me. I really hate the way my brain works sometimes. Below is my result from scrubbing the cache pool. Thanks again for your help!

-
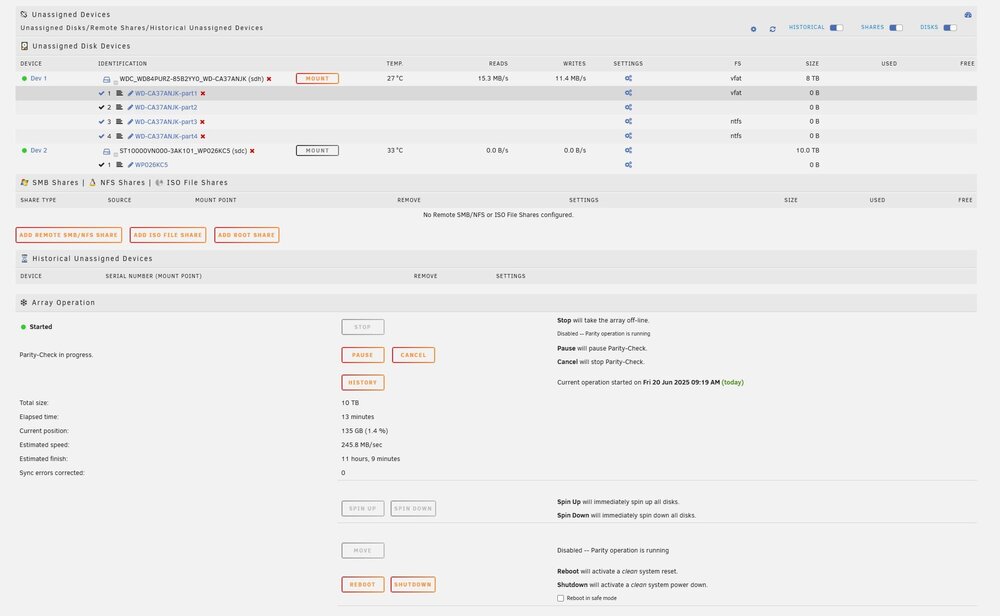
Hi, JorgeB! I apologize for my misunderstanding. Please help me clear this up and hopefully we can find where my logic is flawed. I respect your opinion and efforts and I see you post on here all the time helping people so I know you know what you're talking about. I believe this to be a flaw in my own understanding that I'm trying to get help with. I want to do what you're asking and I promise I am trying to do it. I believe by "scrub the pool and post the results from GUI" you are asking me to perform a parity check, and to then grab results of this parity check from the GUI and post them here. I believe that when Unraid performs and completes a parity check, it will say something like "completed with no errors" or something similar at the bottom of the "Main" tab where it gives information on the parity check, and this is what you want me to post? Please let me know if this is correct and I will attempt to post a picture or screen capture of this if I can get a parity check to complete. If this is not what you are looking for, please let me know exactly where in the GUI I should be able to find the information you are looking for. I promise, I am not just lazy and trying to not perform a parity check. I am just trying to explain why it hasn't been possible or easy for me to do so with the server going down all the time. The system started another parity check this morning when I had to restart the server again. In fact, I believe the parity check has been started on it's own almost every time my server has rebooted in the past couple of weeks because it's not being shut down gracefully. I will admit that many of the times the server was rebooted, I did stop the parity check because I didn't feel like it would do anything different than all of the other times it ran, but at least a few of the times it has rebooted (likely much more than a few) I let it continue to run the parity check until the server went down again. Because I have all 10TB drives in my server, it takes a long time to perform the parity check. I had to reboot my server again this morning because of the error described above caused it to stop working again last night before the parity check finished. The parity check has currently started again, and I will let all future parity checks continue and attempt to gather the result if it finishes before the server goes down again. In order to help in the meantime, I've also included a current screen capture of bottom of the main tab. As you can see from the picture attached, it currently says it will take ~11 hours to complete the parity check but my past experience tells me that it will likely take a bit longer. I believe the last times I saw it complete, it took closer to 13-16 hours. The issue I'm having with the parity checks in the past couple weeks, is they take so long to complete that many of the times it runs, my server stops working before the check completes. For instance, In the diagnostics I included below, you can see in the syslog-previous.txt log file that my server was rebooted yesterday at ~2:20 PM, and seemingly around 10:30 PM it went down again because that's where the log stops. I didn't reboot it again until this morning. I also want to note, that the parity-checks.log file does not include any line items from this instance (2:20PM - 10:30PM yesterday) when I rebooted the machine and let the check run. If I stop the parity check, it logs what it was able to do, but if it runs until the server goes down, nothing is logged about the parity check in the parity-checks.log file. This has been my experience so far, that the server can't complete the parity checks because they take longer to complete than the server stays online. The server also doesn't log when I do let the check run because it goes offline before the check finishes. I have also attached a copy of my parity-checks.log file found in /boot/config. In this file I believe there are a couple instances the parity check was able to complete in the past week before the server stopped working or I stopped the check. I believe the log for June 16 at 09:50:40 and the log for June 13 at 00:10:12 are times when the check was able to complete. I believe the "check P" log indicates they passed? If this is true, I'm hoping that this can serve as an indication that the parity check did complete after I began seeing this issue, and we can continue diagnosis and troubleshooting to figure out what is causing my server to stop working and send the crond errors described above. I want to re-iterate, please understand that I am not saying that I will not complete the parity check, I will still attempt to complete the parity check that is currently running after my reboot this morning, and I will try to capture the result before the server goes down again. I will also continue to let the parity checks run after all reboots from now on and see if I can capture one for you that completes. My last post was not an attempt to tell anyone that I refuse to do as you ask, it was only an attempt to explain the troubles I've been having and why I wasn't confident that it would be possible to complete the check and for me to capture the results in the GUI with the server going down all the time and the GUI being unresponsive. I also wanted to give as much other information that I believe might help in the meantime so that we cold continue troubleshooting while we waited for a successful parity check to complete, especially since I believe it may not be possible to get a successful parity check with the server going down all the time. Thank you again for your time! Please let me know if I am correct about the GUI results you're looking for, and if there is anything else we can do in the meantime while we wait for a parity check to complete that might rule out other possible issues. JorgeB, I really do appreciate everything you do for the community in these forums. Every time I have an Unraid issue and look things up myself I see threads littered with you're responses. Thank you for all that you do for this community. parity-checks.log jebsnas-diagnostics-20250620-0955.zip
-
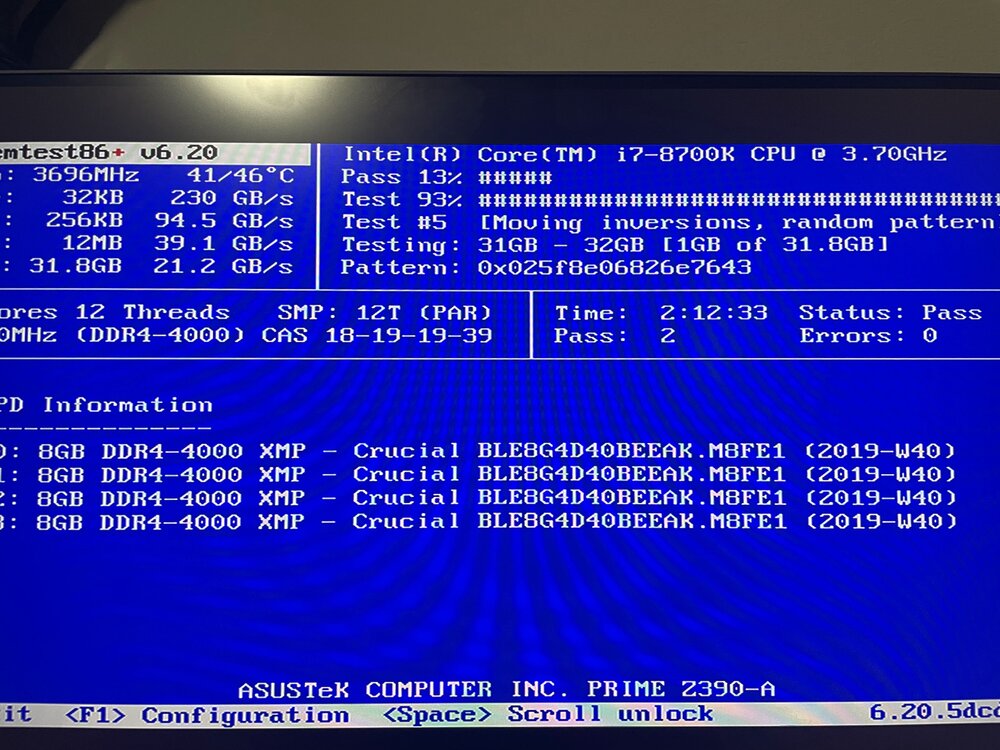
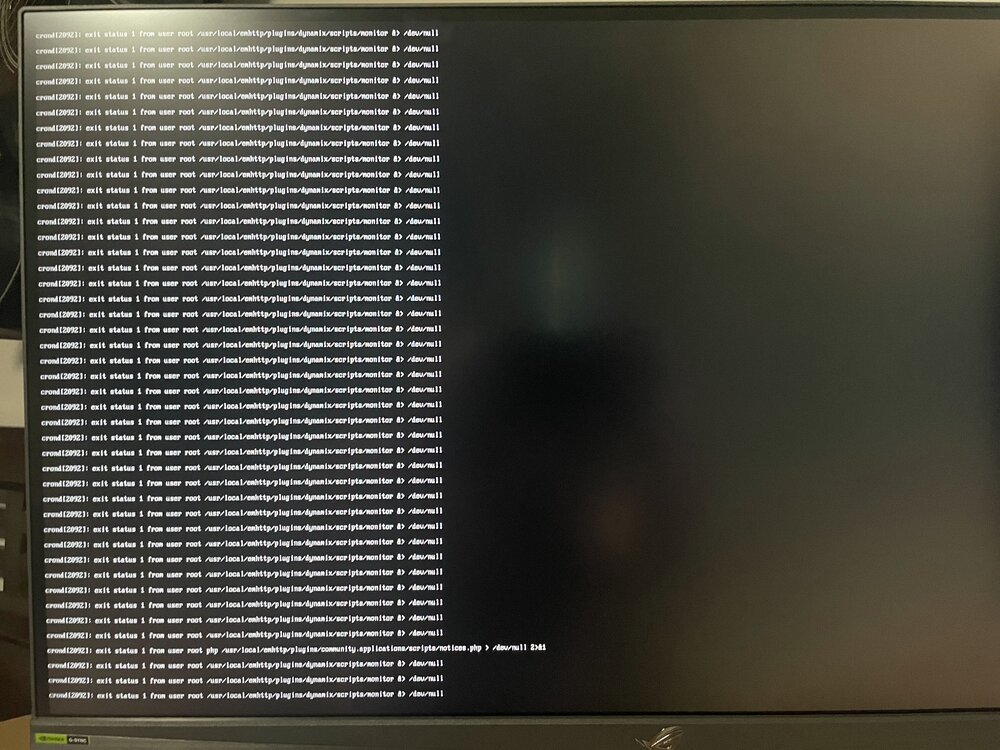
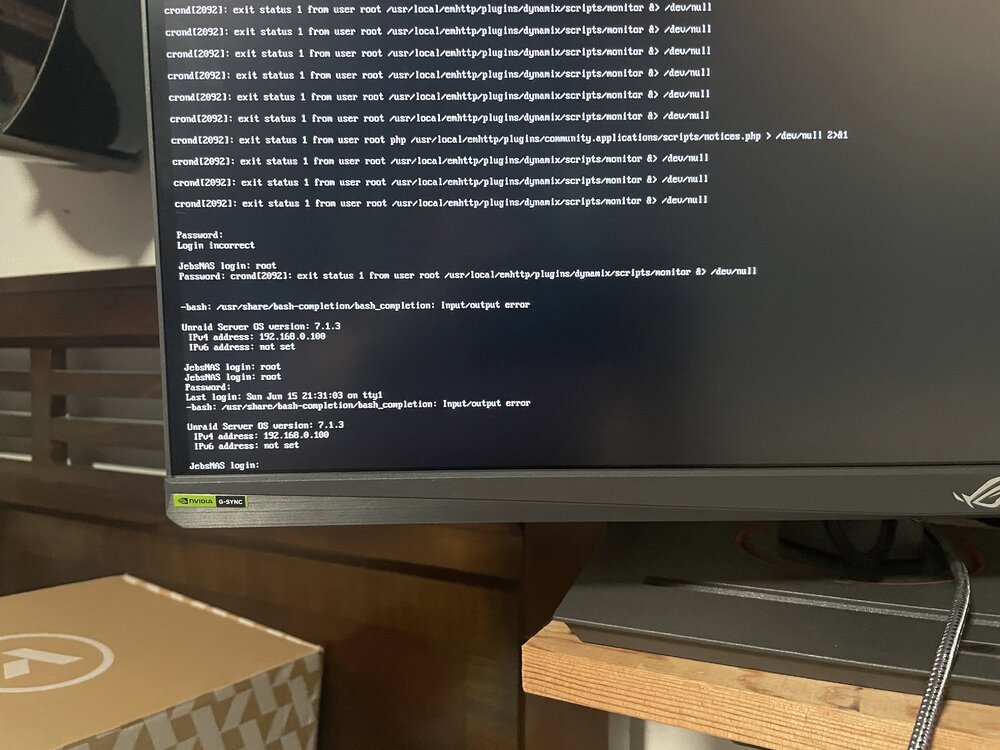
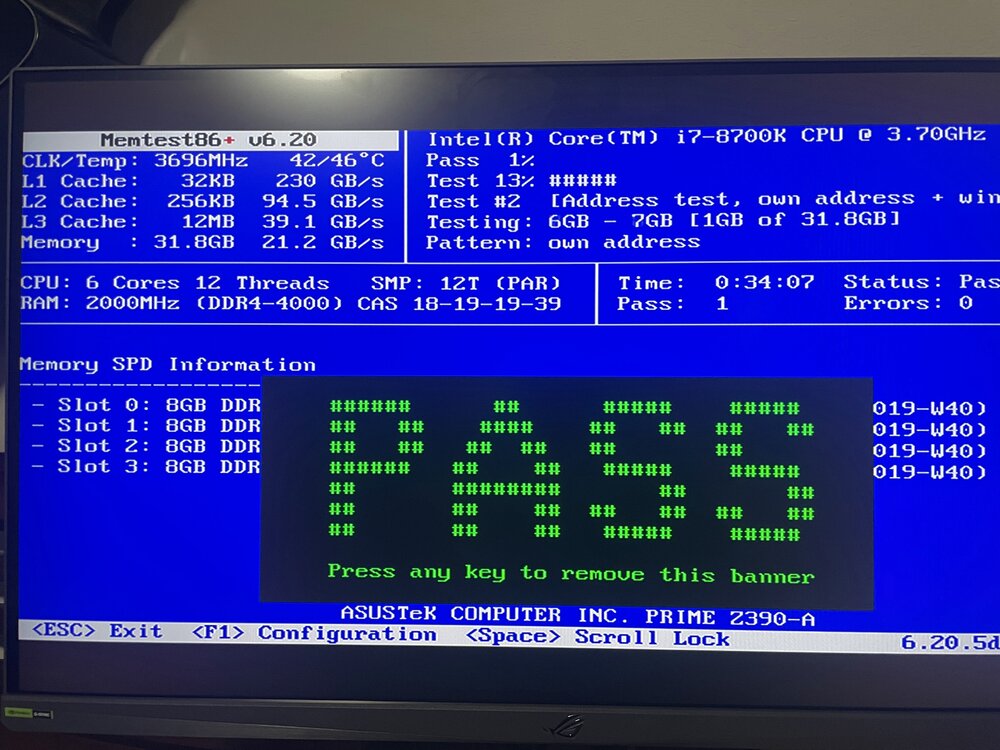
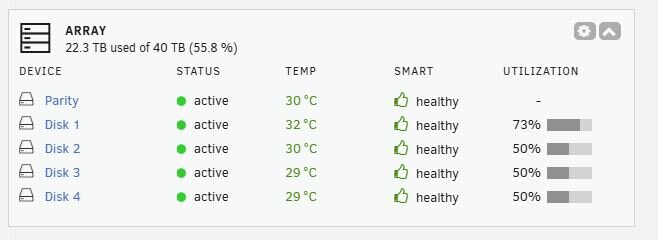
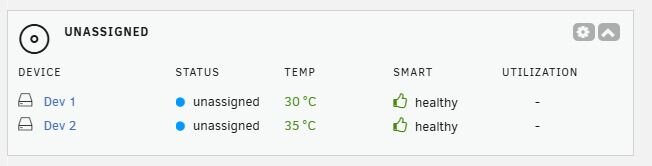
Hi, JorgeB! None of the drives technically dropped offline. I was going to add a second parity drive which I decided would be a good idea to order when this issue became frequent. I installed the drive in the computer a few days ago when I believed I solved the issue, but every time I've tried to build the 2nd parity in the past week, the server stops working before the rebuild can complete. I did get a parity check to complete on the original drives once last week before I added the new drive, so I don't believe this is what's causing the issue. I believe what you might be seeing is the new drive, not a bad one which it might look like from the diags. I forgot to mention in my original post, but I did do a smart test on all the drives last week when this issue first started becoming a common occurrence, and also a memtest. Everything passed. This, along with the fact that I was able to complete a full parity check last week after the issue began, makes me think it's not a bad drive issue. If you see anything else that makes you believe a bad drive is the culprit, please feel free to let me know and I will then try to identify the bad drive and replace it since I already have a new one. I'd need another way to diagnose/identify this though since the smart tests seem to have passed. I have 2 drives currently connected which are "unassigned". One of them is the new parity drive, and the other is a purple HDD that I use for a Windows VM running Blue Iris from this server. I do have a picture of my monitor showing the memtest. I let it run through 3 times. The second 2 times took a very long time to complete. I also have pictures of the unraid terminal after attaching my monitor directly to the server. In the first you can see the "crond" error that keeps repeating. In the second you can see what happens when I try to login to the server when kvm is attached directly. The final pictures I have attached here show all the drives currently part of the array and their smart passing, and also the 2 unassigned drives which have passed smart tests.
-
Periodically (currently every day for the past week) my server GUI will stop working and I get a refused to connect error when I try to log in via web GUI. When this happens, I am able to ping the server through cmd from my windows desktop. I also tried "telnet MyServerIP 445" but this resulted in an error. I don't remember the exact wording of the error. I believed this might be a networking issue but I don't really believe this is the issue because 1. the GUI and Unraid server work fine for about a day before it stops working, and 2. When I viewed the server terminal with a KVM, I get a repeated error: "crond[2096]: exit status 135 from user root /usr/local/emhttp/plugins/dynamix/scritps/monitor &> /dev/null" that is repeated about every 30seconds-1minute Attempts to type in my username and password on terminal to sign into the machine without the network and GUI would just display: "-bash: /usr/share/bash-completion/bash_completion: Input/output error Unraid server OS version 7.1.3 IPv4 address: MyServerIP IPv6 address: not set" After displaying this message it would bring me back to the login prompt. I eventually decided I had to reboot the server when this happens. powerdown and shutdown commands do nothing. I've also attempted to do a short press of the power button for a slightly more graceful shutdown and then gave the server ~15 minutes to try to shut itself down, but the server doesn't seem to respond to this either. I eventually have to long press power button when this happens. I'm currently running Unraid 7.1.3 but this has been happening periodically since I was on unraid 6.x.x. I have an asus prim z370-a motherboard. I mention this because I've replaced a few usb sticks by now, and I'm not sure if it's a flash drive problem, or possibly something with the motherboard/BIOS. This same error has happened about 10 times in the past couple weeks and is now happening at least once a day. I found this line in the diagnostics -> logs -> syslog-previous.txt file after one of my reboots and the error seems to have happened right before it wen't offline... "Jun 17 07:34:00 JebsNAS kernel: BTRFS info (device sdf1): bdev /dev/sdf1 errs: wr 1792460, rd 783, flush 17277, corrupt 20433, gen 0" This makes me think it was a problem with the flash drive? Is "/dev/sdf1" the flash drive? In some of my old diagnostics I also had lots of errors from the NUT Community Applications program and my Cyberpower UPS is the only other thing connected to the server via USB (besides keyboard and mouse) so I eventually uninstalled that program to see if this changed anything, but it still did this error last night. As far as NUT program diagnosing went, I was seeing a repeated error in my logs about a pollonly flag. I remembered I got this once before a long time ago, and I added the pollonly flag to the .conf file, but it disappeared at some point. After adding this flag again, it disappeared by the next time the server was turned on so I got rid of NUT altogether to see if that would help. I should also mention here if it is the usb drive that's failing, it's a brand new flash drive which replaced my old one less than a week ago when I was trying to diagnose this and believed the old one was having issues. I've tried switching the OS flash drive to a different usb port when I still had the old drive, and I've switched with the new one too. I've been using Unraid now for about 3 years, and although I love what I'm able to do with it as far as a home NAS goes, and the unraid forum community has been a really great and helpful place to get information since most of my issues have been asked and answered before, but I also feel like I've had nothing but bad usb drive problems since I've set this machine up. This must be my 4th or 5th time replacing the flash drive in only 3 years! Attached should be my last few diagnostics files which I've been keeping every time I have to restart the server for about the past week. If anyone has any information that may help me keep this server running, please let me know. Thank you all for your time and effort throughout the years. jebsnas-diagnostics-20250608-1829.zip jebsnas-diagnostics-20250609-1917.zip jebsnas-diagnostics-20250614-1623.zip jebsnas-diagnostics-20250617-1149.zip jebsnas-diagnostics-20250617-1951.zip jebsnas-diagnostics-20250617-1954.zip jebsnas-diagnostics-20250618-0907.zip jebsnas-diagnostics-20250618-1828.zip jebsnas-diagnostics-20250619-0833.zip
-
Thank you for this! It led me to my issue! I do remember there being a flag at the top of the screen before I restarted, saying the server needed a "restart for VM updates to take effect" or something along those lines. It looks like what happened was the "PCIe ACS override" option in Settings -> VM Manager somehow changed from whatever setting I had it at before to "Disabled". This meant that the GPU I was using to passthrough to one of my VMs shared an IOMMU group with the LSI 9300-8i HBA. I know I had this setup properly in the past, and I don't believe I changed this setting on my own, so I'm not sure why/how it happened, but regardless, it seems to be fixed now. I appreciate your help, JorgeB!!
-
What happened: After a restart, my LSI 9300-8i HBA stopped showing disks. I've had the card for almost 3 years, and it seems to have just stopped working. After doing some diagnosing myself, I believe I've ruled out the hardware as being the issue, but I'm open to suggestions on further diagnosis if someone still believes it's a hardware issue. What I've tried so far to fix/diagnose: - I tried reseating the HBA in the PXIE slot and reseating the mini-SAS HD connectors and the SATA connectors. - I moved some disks from the HBA to directly connected to Motherboard SATA ports. The hard drives I connected to the motherboard showed up. This ruled out the drives/disks as the issue. - I purchased a brand new LSI 9300-8i and hooked it up along with switching out for the new cables but the drives still aren't showing up. - I can see the "Avago Technologies MPT SAS3 BIOS" HBA screen when booting the computer, and the green light (heartbeat LED) flashes on the HBA card which seems to show that it is capable of general activity so to me, the issue is likely not the HBA card(s). - I've read many posts here so far, but most seem to either be about the HBA never working in their initial setup, or the issues are fixed by purchasing a new card. Since I've done both of these things, I'm unfortunately unable to diagnose this issue without help. Fun request: If someone does find some helpful information in my diagnostics files or elsewhere, could you please include in your response where you found the information? This request is to hopefully help spread knowledge or "teach a man to fish". I attempted looking into the diagnostics files myself, but I have no idea where to start or what to look for. Some of the places I thought I might find information but haven't are: - tried looking in config\disk.cfg, logs\syslog.txt, logs\vfio-pci.txt, and others but didn't see anything related to the HBA. Thank you, everyone for your help here and with past issues so far. I've had few issues with UNRAID, but when I have had issues this community has been excellent in helping me find what I'm looking for. jebsnas-diagnostics-20250604-1422.zip


