TechHut
Members
-
Joined
-
Last visited
-
All the guides I've come by were outdated, this took a bit to figure out, but I got everything mostly working. I'd love any suggestions to improve this setup if y'all have any. Assumptions This assumes you already have Grafana and InfluxDB 2 setup. These are super simple to setup just by searching the applications in the Unraid UI. Generally, these don't require any special configurations or changes. Add your configuration Before we add our Telegraf container we need to add our configuration. In this example we are placing it the default directory for Docker configurations on Unraid. Change anything here to better fit your setup. When working with my appdata directory in Unraid I generally use the Dynamix File Manager it's an awesome tool that makes navigating shares in the Unraid UI easy. First download the telegraf.conf file located in my repository and make any changes you'd like. Most everything the configuration should work as-is* Unraid, but you will need to edit the outputs plugin information to properly send data to your InfluxDB 2 bucket. Note: Use a new bucket specifically for this Unraid instance. *I'm still trying to figure out how to get smart monitoring to work. [[outputs.influxdb_v2]] urls = ["http://ip:8086"] token = "yourtoken" organization = "yourorg" bucket = "unraidbucket" In your appdata directory on Unraid make a new folder called telegraf. Within your telegraf folder upload the edited telegraf.conf file. The file path will look like this if you're following the default Unraid setup. /mnt/user/appdata/telegraf/telegraf.conf Setting up the container Use the official Telegraf container from the Applications page. We will be using the golift/telegraf in replacment of the office image as it includes some packages needed for full monitoring of the hardware. Change the following Repository: golift/telegraf Registry URL: https://hub.docker.com/golift/telegraf This container provides a telegraf docker image with added tools for monitoring disks, sensors, and IPMI. This exists because the base telegraf Docker image makes it very difficult to monitor some system metrics. Applications added: smartctl (smartmontools), ipmitool, nvme-cli, sensors (lm-sensors), mtr (mtr-tiny), sudo. Sudoers entries are added for smartctl, ipmitool and nvme. Add the following Extra Parameters: /bin/bash -c "/entrypoint.sh telegraf" Extra Argument: --user telegraf:$(stat -c '%g' /var/run/docker.sock) Start and verify Other than these adjustments everything should be able to be left as is included in the template. Check over everything and click on apply. Go to your Docker page in Unraid and check to see if the container is running. Check the log files to ensure there are no issues and that all the plugins are properly active. If there are no issues, we check to see if the data is being properly exported to InfluxDB 2. Head over to your dashboard and open the bucket you created for Unraid. It should look like the picture below. Go through the data make sure nothing is missing. In my installation I have 7 tags for Docker data under the _messurements ID and another tag for every plugin I have enabled. Grafana Dashboard This guide is part of a larger video where I highlight the entire setup the embedded video starts at 26:52, when I add the data source in Grafana and use an awesome dashboard to monitor Unraid. Unraid System Dashboard V2 (InfluxQL) - 7233
-
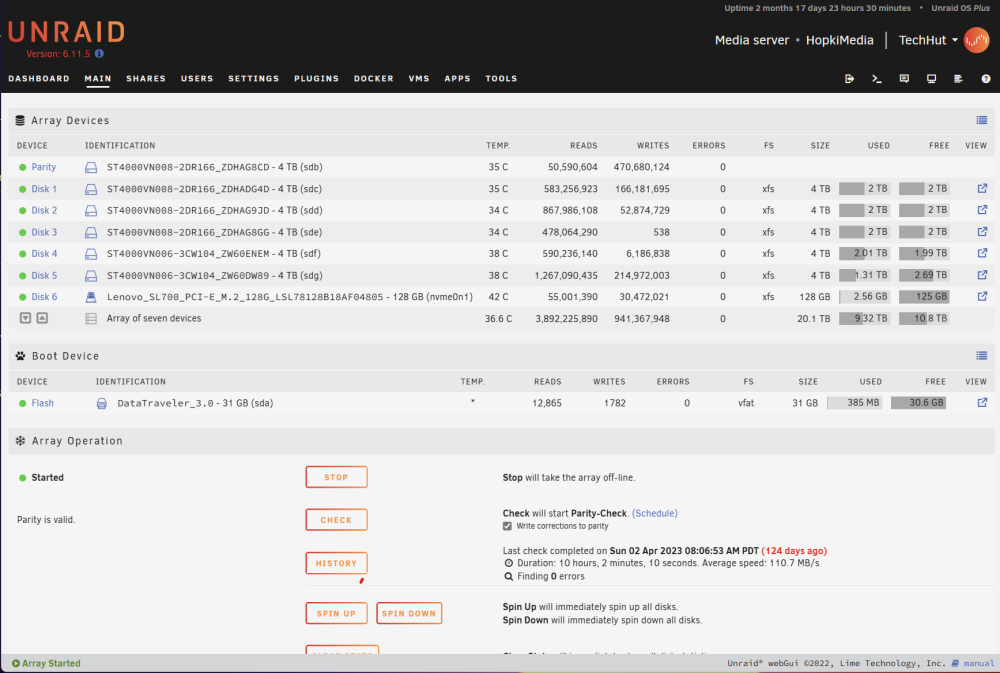
First, big thanks to @JonathanM and @JorgeB for your replies they lead me in the correct direction! Learned a good amount in this process. For anyone trying to do the same thing it is relatively easy and there are a few ways to do it. 1. Backup all the data in the share/drive I was removing. You technically could change the disks the share uses and then use the mover, but I only had a few gigs worth of docker config files. Stopped all docker containers and turned off auto-start. 2. Followed the 'The "Remove Drives Then Rebuild Parity" Method' here: Shrink Array | Unraid Docs 3. Upgraded NVME and setup as a single Cache Pool. Cache Disk | Unraid Docs 4. Made my appdata share only use the new Cache pool and uploaded my previously backed up docker configuration files. 5. Manually edited each docker container with default appdata directory for configurations.
-
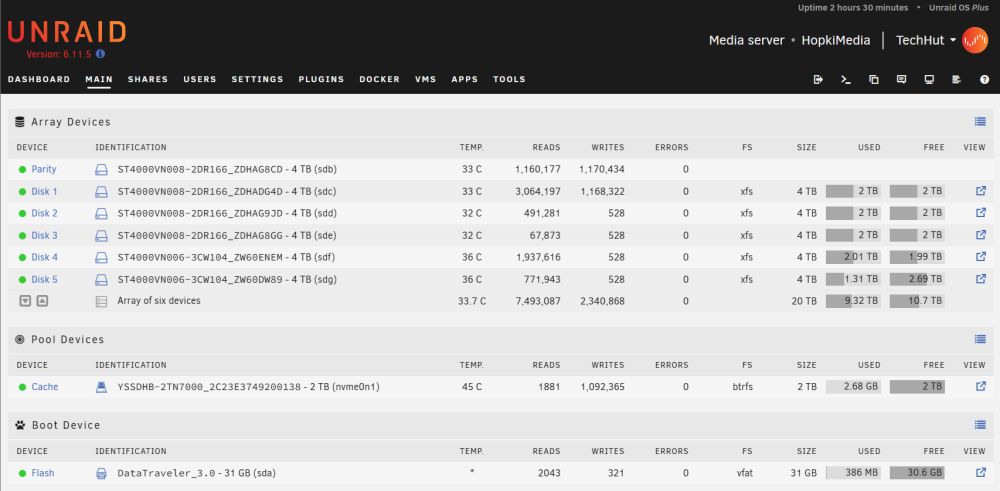
Hello all! I made a very noob mistake when I first setup my array. I have x6 4TB drives and then a single 128gb NVME all in the same array. The 128gb NVME is only used for a share with docker configuration files. I just wanted to make sure there isn't anything special I need to do as to not screw anything up. I'm planning on backing up my docker configuration files, stopping the array, and removing the NVME. Then I plan on replacing it with a brand new 2TB NVME and setting it up as a cache drive. I heard we can do shares on cache and that is where I'd like my docker files stored.
-
Nothing really changed it is a fresh install. I think it was actually working all along. Using the commands I mentioned it was make hardware encoding actually start working on Plex. Once the GPU was actually being used I started getting data in the monitors. Thank you for the kind words! I've read a lot of threads on here the last day. Big thanks for helping so many people out.
-
No it wasn't, I was actually able to get it working thanks to your reply on another thread. THANK YOU! mkdir -p /boot/config/modprobe.d echo "options i915 enable_fbc=1 enable_guc=3" > /boot/config/modprobe.d/i915.conf
-
TechHut changed their profile photo
-
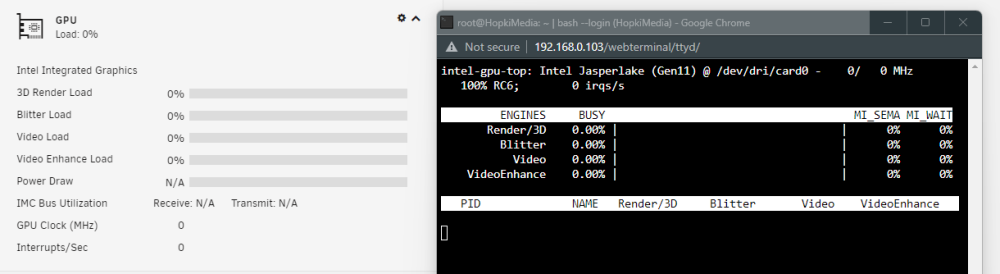
Hello, I looked all around this thread and I'm having an issue finding a solution. I've installed the GPU Statistics and the Intel GPU TOP plugins. When I run the GPU Top command it recognizes my Intel GPU, but it gives no data back at all. I'm transferring files now and worried whatever is causing this might cause issues with Plex transcoding later. Hardware: Terramaster T6-423 hopkimedia-diagnostics-20230402-0919.zip