





Di4rnu
Members
-
Joined
-
Last visited
Everything posted by Di4rnu
-
Thank you, this generates a log on the flash drive. However, it doesn't fix that Diagnostics (in WebUI -> Tools) gives thousands of lines as described. How can I fix that?
-
Unraid 6.12.13 I wanted to run diagnostics for posting here in the support forum but it keeps spitting out lines like "sed -i 's/\/mnt\/cache\/media\/filename..." in the thousands. I googled a little bit and got the impression that it could be do to Mover Logging being enabled. I disabled it and rebooted but the problem persisted. How can I obtain a normal diagnostics file?
-
Ahh sorry! I completely overlooked the green box! 🤦♂️ The drive was back up and running after the forced shutdown. I then implemented the above changes and rebooted. It is still running fine. Should I post diagnostics or just wait and see if the problem occurs again?
-
The default boot option should be for network access via WebUI. That's also how I just booted. So I guess the answer is not. The GUI boot option is for a monitor attached directly to the server, right? Eventually I will switch to that option but not yet.
-
I had to do a forced shutdown The line with "append initrd=/bzroot" currently reads initrd=/bzroot,/bzroot-gui Which of the following (if any) should I change it to: append initrd=/bzroot nvme_core.default_ps_max_latency_us=0 pcie_aspm=off pcie_port_pm=off append initrd=/bzroot,/bzroot-gui nvme_core.default_ps_max_latency_us=0 pcie_aspm=off pcie_port_pm=off append initrd=/bzroot nvme_core.default_ps_max_latency_us=0 pcie_aspm=off pcie_port_pm=off,/bzroot-gui
-
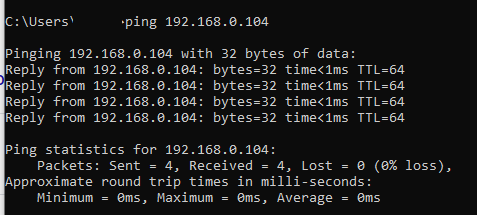
I really appreciate your help! I postponed the power cycling because I wanted something else on the server to finish. In the meantime, I can no longer access the WebGUI. When I log into my modem/router, I can still see the server connected to the network with an unchanged IP address (I used the IP to connect to the WebGUI). I also seem to be able to ping it: What do you advise me to do?
-
Here it is syslog.txt
-
I have the syslog now. Can I post it as it is or is there something I should edit/remove?
-
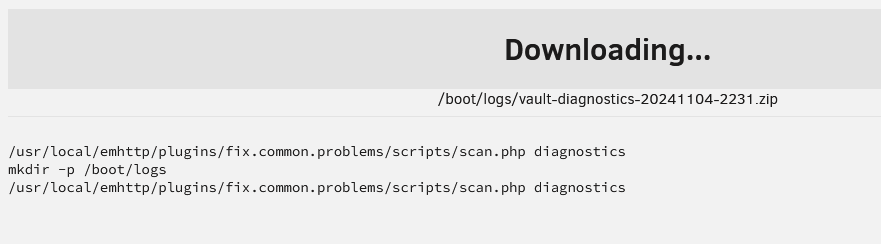
Unraid version: Version 6.12.13 I have a cache pool consisting of two 4 TB WD Red SN700 NVMe SSD. It's formatted as a ZFS RAID0 (striped) if I remember correctly. I now get the following error: pool: cache state: SUSPENDED status: One or more devices are faulted in response to IO failures. action: Make sure the affected devices are connected, then run 'zpool clear'. see: https://openzfs.github.io/openzfs-docs/msg/ZFS-8000-HC config: NAME STATE READ WRITE CKSUM cache ONLINE 0 0 0 /dev/nvme4n1p1 ONLINE 0 0 0 /dev/nvme5n1p1 ONLINE 75 3.03G 0 errors: 21 data errors, use '-v' for a list I have not yet rebooted. I am trying to obtain the diagnostics file but it is stuck in the following state: I realize that I have probably lost whatever was on the drives but I am not sure if one drive is completely dead and what I should do. They have both been in use for a few months and I have probably written ~20 TB to each.
-
I see. Is there a way to disable parity while doing this and then do a parity sync from scratch afterwards? Also, what is the explanation for me second observation above?
-
I am trying to move a lot of data from my disk 2 to my disk 4 within the same share by using the file manager "Move". Both disks are WD Red Pro 22 TB, which should have internal speeds up to 265 MB/s but after a short time I get around 30 MB/s. What is the reason for the slow transfer speed and can I improve it? There's also something weird going on with the file manager progress "Completed X%" and "ETA". It seems to show it per file and not for the total amount of files being moved. It also seems to jump instantly to ~92-93% for each new file and then progress slowly to 100% from there. What could be the reason for this? vault-diagnostics-20241027-1024.zip
