Sieck
Members
-
Joined
-
Last visited
Everything posted by Sieck
-
I put in some different RAM modules (2x8 GB DDR4) from one of my PCs, and the server has yet to crash or freeze since then. It's so odd. I've tried using the old RAM modules in the PC without any issues, and I ran Memtest86 again with no errors at all. Either way, I will buy some new RAM modules and chalk the issue up to faulty memory. Thank you all for taking the time to help me out. I really appreciate it. I will mark the thread as solved.
-
Ah, you mean still in safe mode? You're right. I forgot that JorgeB suggested earlier - when I tried using just one memory stick - to enable my docker containers one at a time to figure out which is causing issues. However, if I'm right that there are two issues, I think I'd prefer for now to just replace the memory sticks and take it from there. I really appreciate the input and will keep you guys updated.
-
I'm just making this post to update with my findings in case anyone else encounters similar issues. I followed JorgeB's advice and booted the server in safe mode with both memory sticks inserted and all of the dockers disabled. The server crashed once again the following night. It seems it just crashes during the night for whatever reason. There was nothing in the log at all and at second thought, it seems the errors in the log only started to appear when I was experimenting with the memory sticks. However, I tried again with only the memory stick that showed some promise in the last test - also in safe mode with dockers disabled. It has now been 3 days and the server has yet to crash. What I'm thinking is that maybe there are 2 independent issues. 1 of the memory sticks is faulty despite Memtest86 returning no errors. Additionally, a plugin or docker does not play nice with only 8 GB of RAM. Next step is to try Memtest86 again and test with another pair of memory sticks.
-
Thank you. I will try that immediately. I really appreciate the assistance.
-
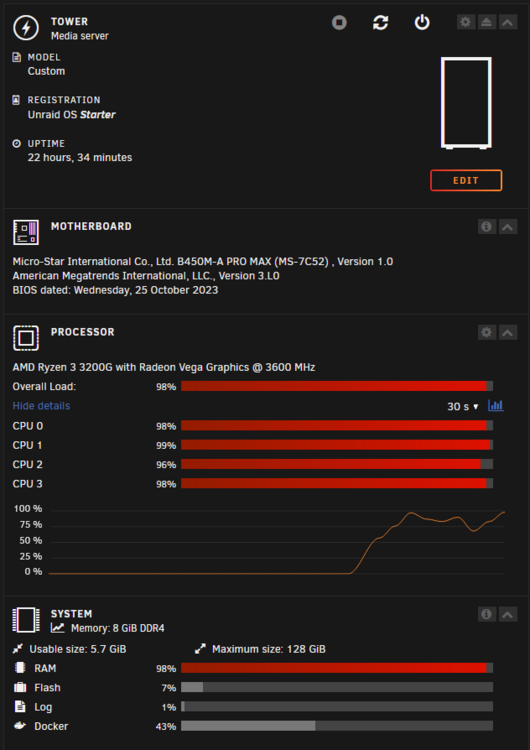
So I've been experimenting a bit as you both proposed. I have done the following: I set "Power Supply Idle Control" to "Typical Current Idle". That didn't work. Then I disabled C-States which also didn't work. I took out my PCI-E NIC and reset my network settings to default. I took out one RAM stick. The same issue occurred, so I put it back in and took out the other instead. I just experienced another crash this morning which appeared to be somewhat odd. From my phone I could access the login screen of one of my docker apps. Then when I went to my PC to check the dashboard, it froze like this immediately while loading the page: I successfully accessed the login screen of one of the docker apps at Oct 1 10:10:00 approximately, though I don't see it in the logs. Perhaps it was just cached? I have attached the log again, but I assume these are the relevant events. I believe I determined that the dashboard has frozen around 10:22:00. I pushed the power button of my NAS at 10:35:51. It did not power off. So around 11:22:00 I held the power button to shut it down. Oct 1 03:05:17 Tower kernel: mdcmd (36): check NOCORRECT Oct 1 03:05:34 Tower kernel: Oct 1 03:05:34 Tower kernel: md: recovery thread: check P ... Oct 1 03:56:40 Tower unraid-api[6686]: ⚠️ Caught exception: Something went wrong. cron reached maximum iterations.#012#011#011#011#011#011#011Please open an issue (https://github.com/kelektiv/node-cron/issues/new) and provide the following string#012#011#011#011#011#011#011Time Zone: "" - Cron String: 0 * * * * * - UTC offset: +02:00 - current Date: Tue Oct 01 2024 03:55:51 GMT+0200 Oct 1 03:57:14 Tower unraid-api[6686]: ⚠️ UNRAID API crashed with exit code 1 Oct 1 10:22:42 Tower root: shinobipro: Could not download icon https://shinobi.video//libs/assets/icon/apple-touch-icon-57x57.png Oct 1 10:22:44 Tower unraid-api[4147]: ✔️ UNRAID API started successfully! Oct 1 10:35:51 Tower init: Switching to runlevel: 0 Oct 1 10:35:51 Tower shutdown[4892]: shutting down for system halt Oct 1 10:36:04 Tower init: Trying to re-exec init Oct 1 10:38:00 Tower root: Status of all loop devices Oct 1 10:38:03 Tower root: /dev/loop1: [2049]:12 (/boot/bzfirmware) Oct 1 10:38:03 Tower root: /dev/loop2: [0041]:260 (/mnt/cache/system/docker/docker.img) Oct 1 10:38:03 Tower root: /dev/loop0: [2049]:10 (/boot/bzmodules) Oct 1 10:38:03 Tower root: /dev/loop3: [0041]:263 (/mnt/cache/system/libvirt/libvirt.img) Oct 1 10:38:03 Tower root: Active pids left on /mnt/* Oct 1 10:38:16 Tower root: USER PID ACCESS COMMAND Oct 1 10:38:16 Tower root: /mnt/addons: root kernel mount /mnt/addons Oct 1 10:38:16 Tower root: /mnt/cache: root kernel mount /mnt/cache Oct 1 10:46:02 Tower root: root 7862 F.... shfs Oct 1 10:46:21 Tower root: /mnt/disk1: root kernel mount /mnt/disk1 Oct 1 10:46:29 Tower root: root 7862 F.... shfs Oct 1 10:46:48 Tower root: /mnt/disks: root kernel mount /mnt/disks Oct 1 10:47:01 Tower root: /mnt/flashtillog: root kernel mount /mnt/flashtillog Oct 1 10:47:21 Tower root: /mnt/remotes: root kernel mount /mnt/remotes Oct 1 10:47:37 Tower root: /mnt/rootshare: root kernel mount /mnt/rootshare Oct 1 10:47:41 Tower root: /mnt/user: root kernel mount /mnt/user Oct 1 10:47:41 Tower root: root 4384 ..c.. openvpn Oct 1 10:47:41 Tower root: root 4527 ..c.. prerunget.sh Oct 1 10:47:41 Tower root: nobody 4636 F.c.. java Oct 1 10:47:41 Tower root: nobody 4844 ..c.. php Oct 1 10:47:41 Tower root: nobody 4878 ..c.. php Oct 1 10:47:41 Tower root: root 4888 ..c.. prerunget.sh Oct 1 10:47:41 Tower root: root 4889 ..c.. natpmpc Oct 1 10:47:41 Tower root: root 4890 ..c.. prerunget.sh Oct 1 10:47:41 Tower root: root 8398 F.... rsyslogd Oct 1 10:47:41 Tower root: root 16322 F.... supervisord Oct 1 10:47:41 Tower root: root 16622 F.... supervisord Oct 1 10:47:41 Tower root: root 17244 F...m jellyfin Oct 1 10:47:41 Tower root: nobody 17893 F...m python3 Oct 1 10:47:41 Tower root: (unknown) 18654 F.c.. mysqld Oct 1 10:47:41 Tower root: nobody 19211 F.c.. mariadbd Oct 1 10:47:41 Tower root: root 21866 F.... fail2ban-client Oct 1 10:47:41 Tower root: root 21872 F.... php-fpm83 Oct 1 10:47:41 Tower root: root 21873 F.... nginx Oct 1 10:47:41 Tower root: nobody 21954 F.... nginx Oct 1 10:47:41 Tower root: nobody 21955 F.... nginx Oct 1 10:47:41 Tower root: nobody 21956 F.... nginx Oct 1 10:47:41 Tower root: nobody 21957 F.... nginx Oct 1 10:47:41 Tower root: nobody 21958 F.... nginx Oct 1 10:47:41 Tower root: root 22812 F.... nginx Oct 1 10:47:41 Tower root: root 22814 F.... php-fpm83 Oct 1 10:47:41 Tower root: nobody 22859 F.... nginx Oct 1 10:47:41 Tower root: nobody 22860 F.... nginx Oct 1 10:47:41 Tower root: nobody 22861 F.... nginx Oct 1 10:47:41 Tower root: nobody 22862 F.... nginx Oct 1 10:47:41 Tower root: nobody 23507 F.... qbittorrent-nox Oct 1 10:47:41 Tower root: /mnt/user0: root kernel mount /mnt/user0 Oct 1 10:47:42 Tower root: Active pids left on /dev/md* Oct 1 10:47:44 Tower root: USER PID ACCESS COMMAND Oct 1 10:47:44 Tower root: /dev/md1p1: root kernel mount /mnt/disk1 Oct 1 10:47:44 Tower root: root 7862 F.... shfs Oct 1 10:47:44 Tower root: Generating diagnostics... Oct 1 10:48:29 Tower php-fpm[5682]: [WARNING] [pool www] child 3447 exited on signal 9 (SIGKILL) after 228.290562 seconds from start Oct 1 10:54:58 Tower php-fpm[5682]: [WARNING] [pool www] child 3462 exited on signal 9 (SIGKILL) after 1673.878783 seconds from start Oct 1 11:05:09 Tower php-fpm[5682]: [WARNING] [pool www] child 3587 exited on signal 9 (SIGKILL) after 2081.008985 seconds from start Oct 1 11:05:15 Tower php-fpm[5682]: [WARNING] [pool www] child 3588 exited on signal 9 (SIGKILL) after 2555.646897 seconds from start Can someone smarter than me help me figure out what the errors at 03:05:00 - 03:58:00 concern? There are also these following events which confuse me. Sep 30 20:25:09 Tower php-fpm[5682]: [WARNING] [pool www] child 1982 exited on signal 9 (SIGKILL) after 26.470993 seconds from start Sep 30 20:25:11 Tower php-fpm[5682]: [WARNING] [pool www] child 2202 exited on signal 9 (SIGKILL) after 20.623469 seconds from start Furthermore, when the system froze at approximately 10:22, it looked as if it was in the middle of a parity check that had started during the night. If I remember correctly, it said that a bit more than 7 hours had elapsed at the time. I'm really hoping someone can help me figure out what is going on. If JorgeB is right that it's a hardware issue, I suppose that means my CPU is at fault, unless this most recent issue earlier today is unrelated to the previous one, and that the previous issue was due to a faulty RAM stick. syslog-192.168.50.55.log
-
Thank you. I will give that a try and report back whether that solves it. I appreciate it.
-
I changed the "Power Supply Idle Control" to "Typical Current Idle", but since then, the NAS has crashed/frozen twice which seems to be even more often than previously, although it may just be a coincidence. I have attached my latest log. I reset the device around Sep 28 08:36:00. The events before then relate to the crash, I assume, but I can't make heads or tails of it. Can anybody lend a hand? syslog-192.168.50.55(2).log
-
I thought I had, but thank you so much for pointing it out. It turns out that I had overlooked that the one about "What can I do to keep my Ryzen based server from crashing/locking up with Unraid?" apparently concerns my CPU as well, although I mistakenly thought it was 3rd gen Ryzen. I'll test those solutions out asap.
-
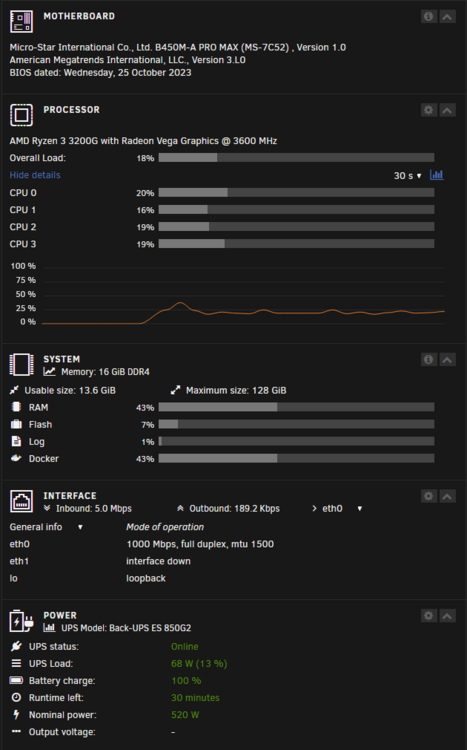
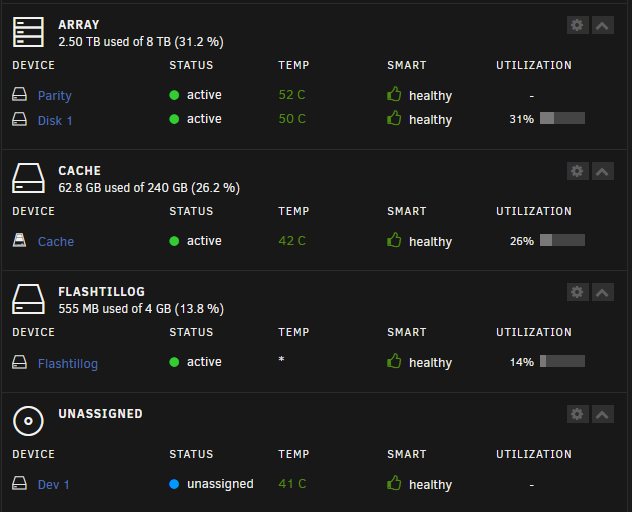
Hi everyone. I'm really hoping you can help me out. My Unraid NAS often just stops responding. When it happens, I cannot connect to it. There is no signal when plugging in a monitor. But the hardware is still powered on. In order to reboot, I need to hold the power button. I have run Memtest86 which found no errors. I have changed to IPVLAN. I've run 'Fix Common Problems' which finds no problems. I'm not sure when the problem started, but it's been happening for a while now and approximately every 2-4 days. I have attached my log. I shut the system down around Sep 25 23:15:38. As such, the latest event was at Sep 25 11:45:31 which I assume is when or just before the latest crash happened. I'm running unRAID 6.12.13 on the following hardware: B450M-A PRO MAX AMD Ryzen 3 3200G with Radeon Vega Graphics @ 3600 MHz 2x Corsair Vengeance LPX DDR4-2400 - 8GB - CL16 be quiet! System Power 9 400W StarTech.com 1 Port PCI Express PCIe Gigabit NIC Back-UPS ES 850G2 2x Seagate IronWolf 8TB hard drives (one as parity) Kingston 240 GB SSD as cache Unassigned Western Digital 1 TB hard drive 15.6 GB flash drive as boot device 4 GB flash drive for logging I have the following dockers running: binhex-crafty-4 (Minecraft server) binhex-qbittorrentvpn Jellyfin Cloudflare-DDNS shinobipro *mariadb *nextcloud *swag *Unraid-Cloudflared-Tunnel *The issue definitely began before I installed these. It possibly began before the others as well, but I am unsure. This is usually how my system info looks: If anybody can point me towards any solutions, I will greatly appreciate it. syslog-192.168.50.55(1).log tower-diagnostics-20240925-2334.zip