dinosaurthug
Members
-
Joined
-
Last visited
Everything posted by dinosaurthug
-
Here's an additonal diagnostics file I created during a transfer between my cache-sata and cache-sata-pny drives: oracle-diagnostics-20250819-1323.zip
-
The command you wanted (I accidentally did disk1 > disk2 hope thats ok): root@oracle:~# pv /mnt/disk1/11GB-test.mkv > /mnt/disk2/11GB-test.mkv 10.3GiB 0:02:34 [68.3MiB/s] [==============================================================================>] 100%
-
I'm not sure if TRIM is performed by default so I went to scheduler and performed TRIM and here was the output: TRIM operation started /mnt/cache-nvme: 918.5 GiB (986214191104 bytes) trimmed on /dev/nvme0n1p1 /mnt/cache-sata: 453.5 GiB (486957527040 bytes) trimmed on /dev/sdb1 /var/lib/docker: 22.5 GiB (24147529728 bytes) trimmed on /dev/loop2 /var/lib/docker/btrfs: 1.1 GiB (1138626560 bytes) trimmed on /dev/loop2[/btrfs] /mnt/cache-sata-pny: 453.5 GiB (486910406656 bytes) trimmed on /dev/sdc1 Finished Not sure if that tells us anything. But I did this command right after doing that and was still at a very low transfer speed for SSDs (70MiB/s) root@oracle:~# pv /mnt/cache-sata/11GB-test.mkv > /mnt/cache-nvme/11GB-test.mkv 10.3GiB 0:02:33 [68.8MiB/s] [==============================================================================>] 100%
-
Do you think I need to adjust some BIOS settings? Could there be something wrong with my HBA? Was there anything concerning in my diagnostics file? oracle-diagnostics-20250818-1435.zip
-
Pretty much the same the other way around, yes root@oracle:~# pv /mnt/cache-sata-pny/11GB-test.mkv > /mnt/cache-sata/11GB-test.mkv 10.3GiB 0:03:07 [56.1MiB/s] [==============================================================================>] 100%
-
root@oracle:~# pv /mnt/cache-sata/11GB-test.mkv > /mnt/cache-sata-pny/11GB-test.mkv 10.3GiB 0:02:59 [58.9MiB/s] [==============================================================================>] 100% It ranged from 40-72MiB/s
-
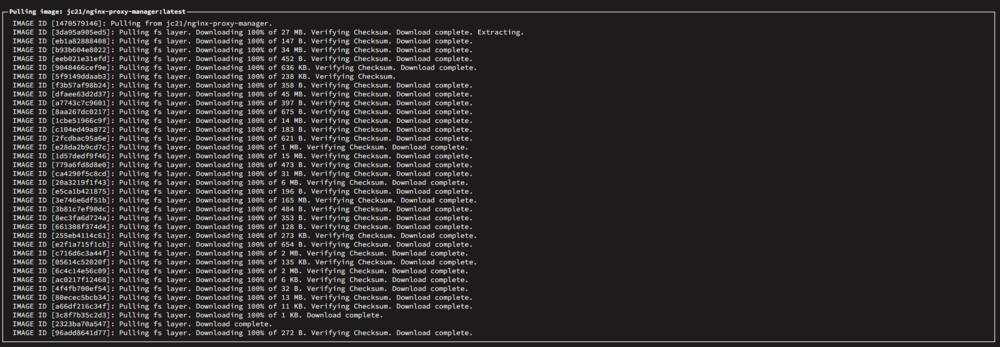
Sorry to ask for your help directly but I see you are very knowledgeable and active in this forum helping others @JorgeB I will gladly tip you if you can help me find out what's wrong! This goes for anyone else too! Because my docker containers feel sooo slow and the point of moving from windows was to have a waaay more speedy system. Thank you! For reference, when installing nginx proxy manager, the pulling took maybe 5-7 seconds, but this extracting of each fs layer took 10+ minutes! There must be something wrong in my setup or maybe even my hardware?
-
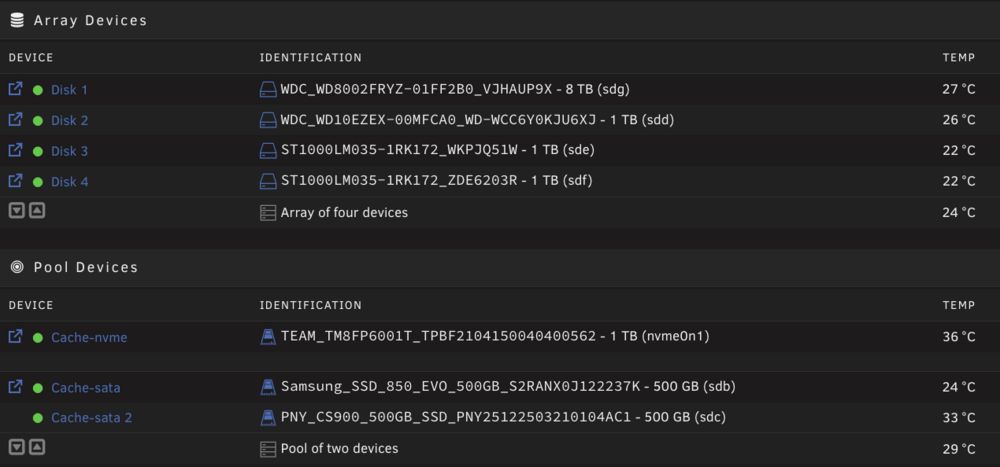
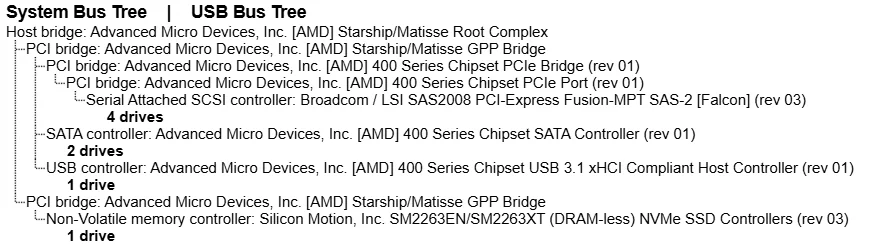
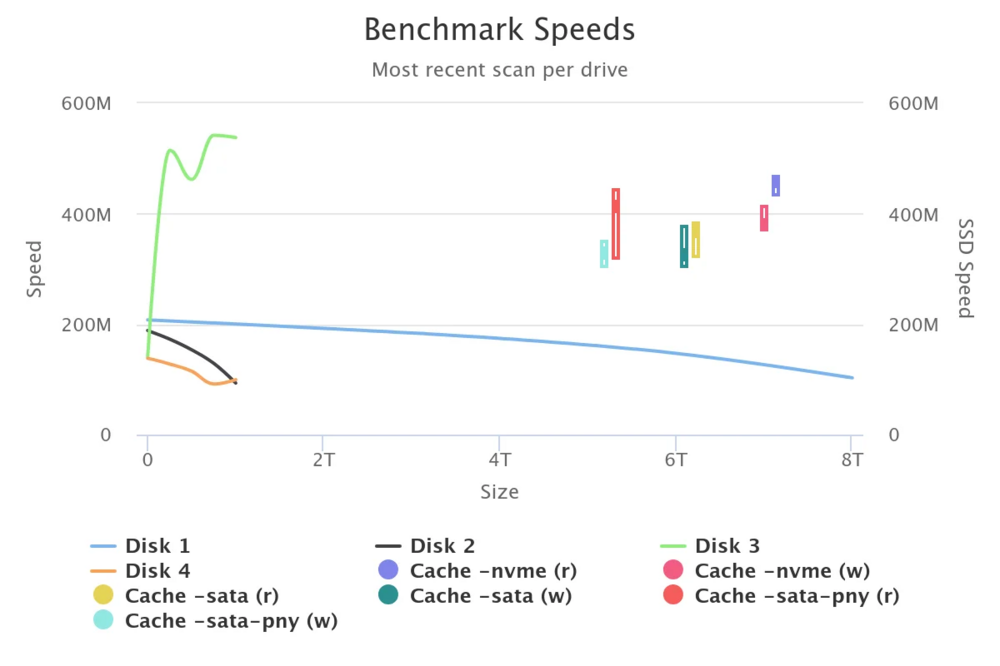
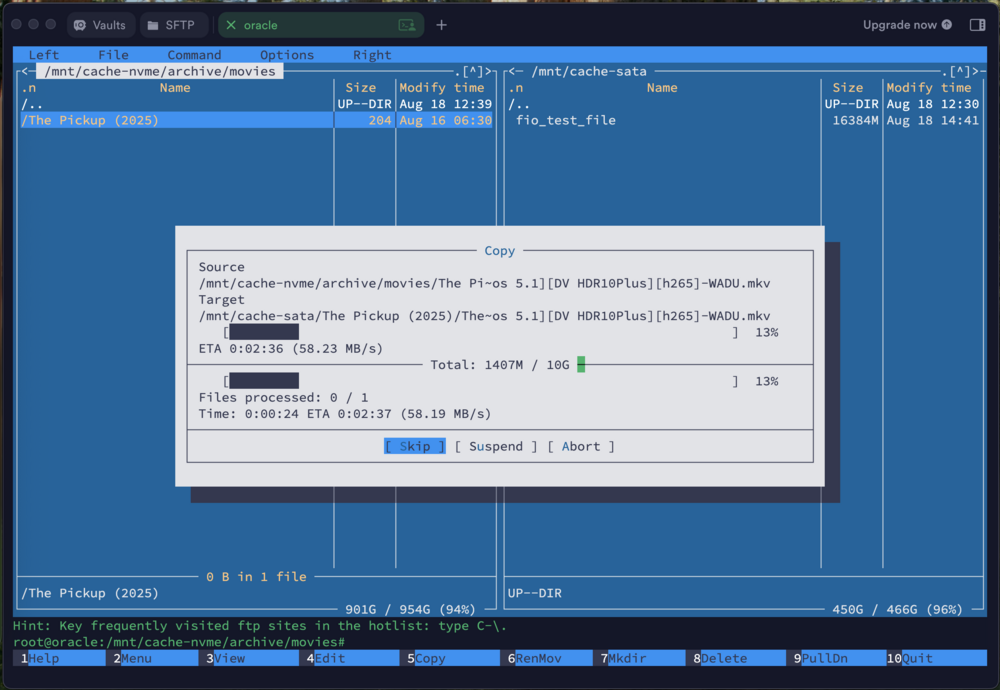
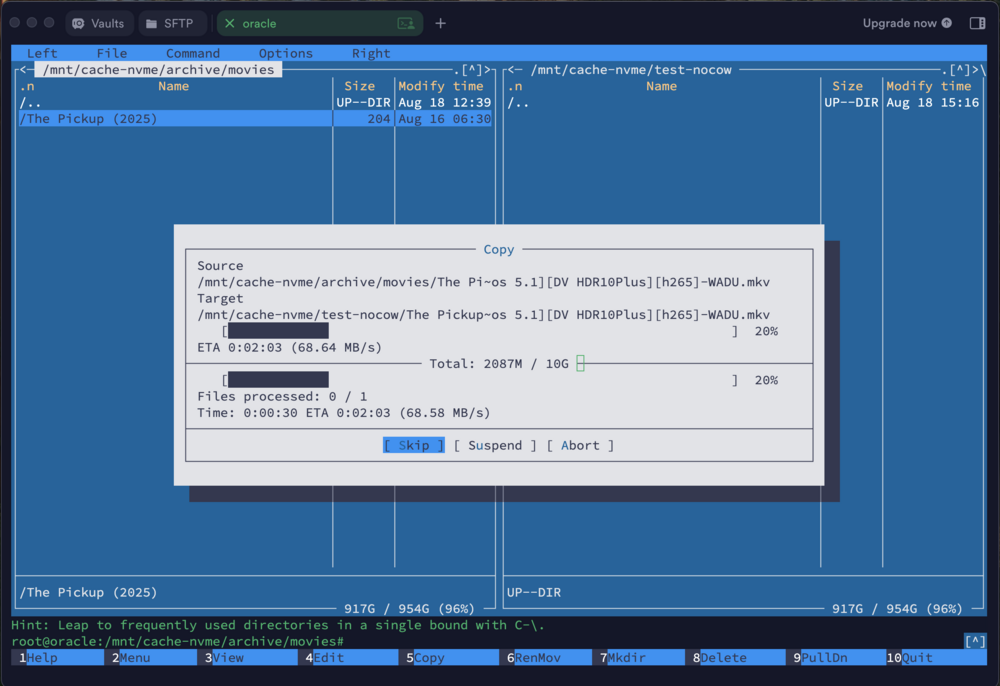
Hello all I am a first time user of Unraid on a new system I built from scratch. I'm not sure what information you guys require to help but here's what I think will be helpful. Please let me know exactly what debug information/logs will be helpful in you guys finding out the cause of my problems. I've tried a few things already that Gemini AI and other forums suggested--I'll share them below. Problem I noticed that when I built new docker containers the log showed that it was fast to download, the extracting of each file when pulling the image took much longer than it did on my old Docker Desktop setup on Windows (i.e. nginx-proxy-manager took 5+ minutes). Then I went and used mc to transfer a 10GB linux iso from my NVMe to my SATA pool to see the file transfer speed and it capped at around 59MB/s. I noticed it was around 25MB/s when I was using Unbalanced but I don't have a screenshot of that. Here is a transfer that stays within the NVMe drive only (CoW disabled). It maxed out at 70MB/s Diagnostics zip file oracle-diagnostics-20250818-1435.zip oracle is the name of my server :) Hardware CPU: AMD Ryzen 5700X Motherboard: MSI B450 Tomahawk Max running latest BIOS version (7C02v3K released 2025-04-30) PCI_E1: (GPU) Intel Arc A380 PCI_E2: Empty PCI_E3: Empty PCI_E4: (LSI HBA) - INSPUR 9211-8i YZCA-00019-101/102 6Gbps (4) 3.5" HDDs connected: sdg, sdd, sde, sdf PCI_E5: Empty M2_1: Teamgroup 1TB NVMe (nvme0n1) SATA1: Samsung 850 EVO (sdb) - connected to power and sata using this cable SATA2: PNY CS900 500GB (sdc) - connected to power and sata using this cable RAM: (2x16GB) DDR4 3200MHz Patriot Viper Steel Array I have my appdata and system shares stored on cache-nvme and have nothing on cache-sata. lspci -vv (command) The log is incredibly long so here is the Gemini analysis of it (the LnkSta part) to check if this is a bandwidth issue on my motherboard End Devices (Your Cards and Controllers) These are the actual components you've plugged in. * 01:00.0 - NVMe SSD (SM2263XT): * LnkSta: Speed 8GT/s, Width x4 * Status: Perfect. Running at its maximum PCIe 3.0 x4 speed. * 22:00.0 - Ethernet Controller (Realtek RTL8111): * LnkSta: Speed 2.5GT/s, Width x1 * Status: Perfect. Running at its maximum PCIe 2.0 x1 speed. * 25:00.0 - LSI HBA (SAS2008): * LnkSta: Speed 5GT/s, Width x4 (downgraded) * Status: Bottlenecked. The card is capable of x8 width but is running at x4 because that is the physical limit of the motherboard slot it's in. * 28:00.0 - GPU (Intel Arc A380): * LnkSta: Speed 2.5GT/s, Width x1 * Status: Power-saving mode. This is an idle speed. Under load, it should increase to match its bridge speed of 8GT/s, Width x8.I know my LSI HBA (9211-8i) is only capable of a max of 2000MB/s but I figured that's okay considering I only plan on plugging up to (8) 3.5" HDDs on this and all HDDs will rarely be active at the same time. Do you think this could be causing my issues and that I should upgrade to a more modern HBA (9300)? DiskSpeed (docker container) Here is what DiskSpeed Docker (from the CA store) showed me: I have no idea why Disk 3 has such high speeds if its an identical model to disk 4 and is a 2.5" 5400 1TB Laptop HDD. This shows my NVMe and SSDs are capable of much higher performance than I am seeing in the real world with my Unraid setup (even tho the NVMe speeds should be much higher IMO) Here is the full (compressed) DiskSpeed Debug File: https://drive.google.com/file/d/16LWRh3GjQDJv_iu5S3M5qWjjowrLfv3q/view?usp=drive_link Fio-Tester (docker container) Here's what Fio-Tester (docker container from CA store) showed me (I only tested the NVMe) / # fio --name=nvme_benchmark --filename=/mnt/cache-nvme/fio_test_file --ioengine=libaio --rw=randrw --rwmixread=70 --bs=4k -- iodepth=64 --size=16G --direct=1 --numjobs=4 --runtime=120 --group_reporting nvme_benchmark: (g=0): rw=randrw, bs=(R) 4096B-4096B, (W) 4096B-4096B, (T) 4096B-4096B, ioengine=libaio, iodepth=64 ... fio-3.36 Starting 4 processes nvme_benchmark: Laying out IO file (1 file / 16384MiB) Jobs: 4 (f=4): [m(4)][100.0%][r=13.1MiB/s,w=5969KiB/s][r=3351,w=1492 IOPS][eta 00m:00s] nvme_benchmark: (groupid=0, jobs=4): err= 0: pid=63: Mon Aug 18 18:03:56 2025 read: IOPS=3356, BW=13.1MiB/s (13.7MB/s)(1573MiB/120002msec) slat (usec): min=85, max=4192.5k, avg=638.71, stdev=11458.18 clat (usec): min=509, max=4269.3k, avg=52417.60, stdev=87852.88 lat (usec): min=625, max=4269.9k, avg=53056.31, stdev=88608.00 clat percentiles (msec): | 1.00th=[ 31], 5.00th=[ 37], 10.00th=[ 40], 20.00th=[ 43], | 30.00th=[ 46], 40.00th=[ 48], 50.00th=[ 51], 60.00th=[ 53], | 70.00th=[ 55], 80.00th=[ 58], 90.00th=[ 63], 95.00th=[ 67], | 99.00th=[ 77], 99.50th=[ 81], 99.90th=[ 104], 99.95th=[ 133], | 99.99th=[ 4245] bw ( KiB/s): min= 9000, max=17088, per=100.00%, avg=13893.91, stdev=319.60, samples=924 iops : min= 2250, max= 4272, avg=3473.11, stdev=79.92, samples=924 write: IOPS=1442, BW=5768KiB/s (5907kB/s)(676MiB/120002msec); 0 zone resets slat (usec): min=161, max=4191.4k, avg=1195.76, stdev=10113.33 clat (usec): min=24, max=4267.4k, avg=52740.01, stdev=89704.28 lat (usec): min=1507, max=4269.5k, avg=53935.77, stdev=90285.65 clat percentiles (msec): | 1.00th=[ 32], 5.00th=[ 37], 10.00th=[ 40], 20.00th=[ 44], | 30.00th=[ 46], 40.00th=[ 48], 50.00th=[ 51], 60.00th=[ 53], | 70.00th=[ 56], 80.00th=[ 58], 90.00th=[ 63], 95.00th=[ 67], | 99.00th=[ 77], 99.50th=[ 81], 99.90th=[ 105], 99.95th=[ 136], | 99.99th=[ 4245] bw ( KiB/s): min= 4088, max= 7517, per=100.00%, avg=5969.81, stdev=140.76, samples=924 iops : min= 1022, max= 1877, avg=1492.09, stdev=35.19, samples=924 lat (usec) : 50=0.01%, 250=0.01%, 750=0.01%, 1000=0.01% lat (msec) : 2=0.01%, 4=0.01%, 10=0.01%, 20=0.02%, 50=49.36% lat (msec) : 100=50.50%, 250=0.07%, >=2000=0.04% cpu : usr=3.26%, sys=35.49%, ctx=670984, majf=0, minf=47 IO depths : 1=0.1%, 2=0.1%, 4=0.1%, 8=0.1%, 16=0.1%, 32=0.1%, >=64=100.0% submit : 0=0.0%, 4=100.0%, 8=0.0%, 16=0.0%, 32=0.0%, 64=0.0%, >=64=0.0% complete : 0=0.0%, 4=100.0%, 8=0.0%, 16=0.0%, 32=0.0%, 64=0.1%, >=64=0.0% issued rwts: total=402769,173053,0,0 short=0,0,0,0 dropped=0,0,0,0 latency : target=0, window=0, percentile=100.00%, depth=64 Run status group 0 (all jobs): READ: bw=13.1MiB/s (13.7MB/s), 13.1MiB/s-13.1MiB/s (13.7MB/s-13.7MB/s), io=1573MiB (1650MB), run=120002-120002msec WRITE: bw=5768KiB/s (5907kB/s), 5768KiB/s-5768KiB/s (5907kB/s-5907kB/s), io=676MiB (709MB), run=120002-120002msecGemini is saying this result is extremely poor and is suggesting it is because it is DRAM-less. Could it be true that just because the drive is DRAM-less it has such poor performance of 13.7MB/s read and 5.9MB/s write? hdparm (command) I also tried hdparm. Not sure if it's a good tool for benchmarking SSDs but here ya go. root@oracle:~# hdparm -tT /dev/nvme0n1 /dev/sdb /dev/sdc /dev/sdd /dev/sde /dev/sdf /dev/sdg /dev/nvme0n1: Timing cached reads: 1764 MB in 1.99 seconds = 885.82 MB/sec Timing buffered disk reads: 404 MB in 3.00 seconds = 134.61 MB/sec /dev/sdb: Timing cached reads: 1850 MB in 1.99 seconds = 928.27 MB/sec Timing buffered disk reads: 418 MB in 3.00 seconds = 139.31 MB/sec /dev/sdc: Timing cached reads: 1860 MB in 1.99 seconds = 933.55 MB/sec Timing buffered disk reads: 416 MB in 3.01 seconds = 138.30 MB/sec /dev/sdd: Timing cached reads: 1774 MB in 1.99 seconds = 890.31 MB/sec Timing buffered disk reads: 380 MB in 3.11 seconds = 122.23 MB/sec /dev/sde: Timing cached reads: 1852 MB in 1.99 seconds = 929.97 MB/sec Timing buffered disk reads: 316 MB in 3.02 seconds = 104.47 MB/sec /dev/sdf: Timing cached reads: 1756 MB in 1.99 seconds = 881.09 MB/sec Timing buffered disk reads: 348 MB in 3.14 seconds = 110.66 MB/sec /dev/sdg: Timing cached reads: 1802 MB in 1.99 seconds = 904.20 MB/sec Timing buffered disk reads: 380 MB in 3.05 seconds = 124.61 MB/sec Please let me know if I can include any further information to help you determine why my speeds are so slow and how I can fix them. Thank you very much!