Jagar
Members
-
Joined
-
Last visited
-
@aje14700 That's funny. Yeah, I had doubts that a new kernel was going to fix my issue so I swapped to an even older DGPU (Nvidia 8600 GT) which fortunately resolved my issue. If the GPU swap didn't work then your solution was my next step, which is why I linked it for others or future me to find :p.
-
I also found this post that covers modifying the sensors.conf file so that it ignores the specific parts that may be timing out when sensors is scanning your hardware. I haven't have time to check it out myself but I figured I'd post it here for any future visitors to this thread.
-
I've marked the post as solved as removing the GPU fixed the issue. But not really, as that is a workaround. Rather than wait to see if a new kernel fixes it would you recommend I file this as a bug report? It may get eyes on it as the devs may simply not know this is an issue.
-
Removing the GPU resolved the issue entirely. After pulling the GPU I verified it is an AMD R9 380. I'll update my comment above to reflect that. While this fixes the issue I'd like to understand why the kernel started having issues with this GPU. I know it's old. Do you know if there is a any information on the differences between the kernels from 7.0.1 and 7.1.2+ would be? If the GPU is simply no longer supported that works for me, I just want to be sure that is the cause of the issue here.
-
I wanted to do more testing so I installed a fresh copy of 7.2.2 and booted up. I opened up two terminal windows and ran the sensors command. It runs fine until it gets to this part: amdgpu-pci-0a00 Adapter: PCI adapter Once it gets there it hangs there for minutes. Using the other terminal window I am monitoring htop. When the process hangs the CPU will spike to 100% and boucne around various cores. This is the exact same behavior as when I click on the Dashboard tab. It looks like the Dashboard is calling sensors to poll their data. The same happens when I run the sensors command with the -A or -uA syntax. Those syntax's just display more information. It always gets hung on detecing The current GPU is an AMD R9 380. I'll try uninstalling the GPU to see if it behaves the same way. I also have an old Nvidia GPU I can try putting in for more testing.
-
Ah apologies. Yes, I misremembered. It is 7.0.1 I can downgrade to. Can you think of anything else I can try other than just waiting for a new version? Can this be filed as a bug report? For now, I'll downgrade back to 7.0.1.
-
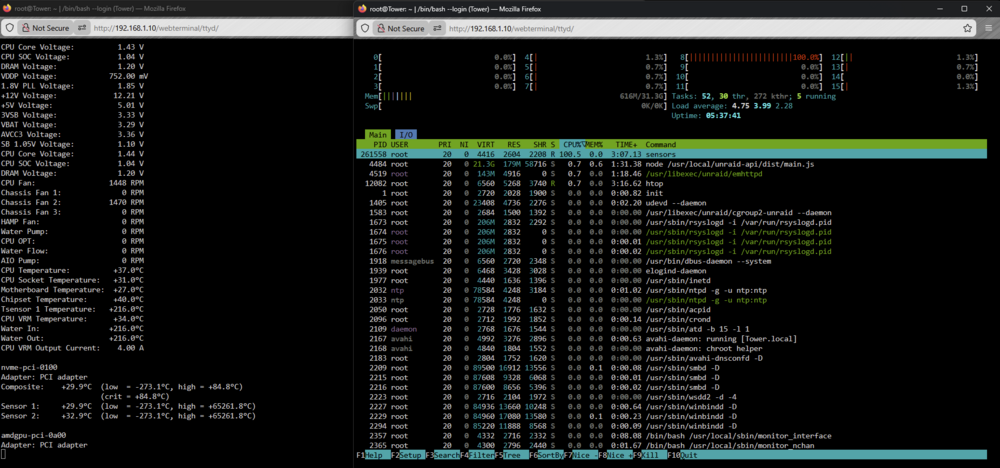
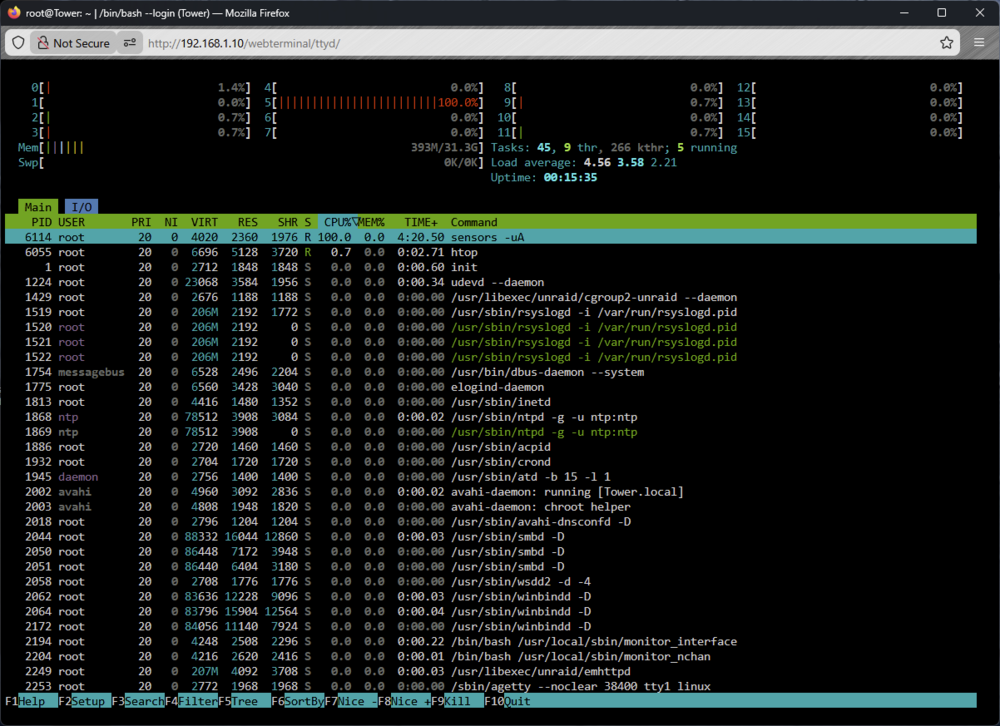
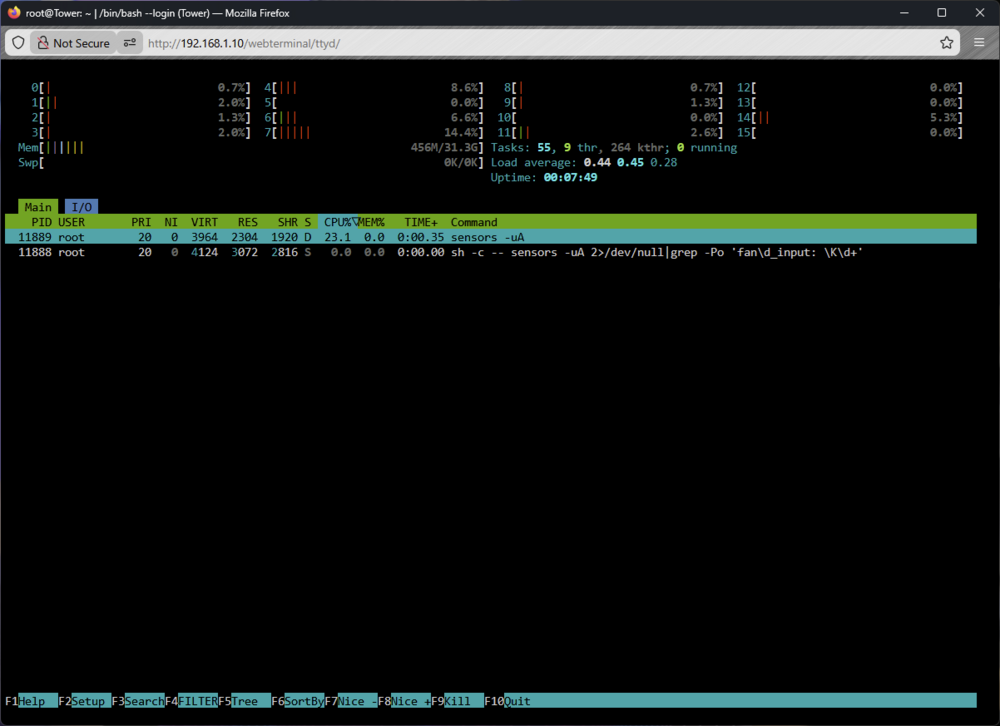
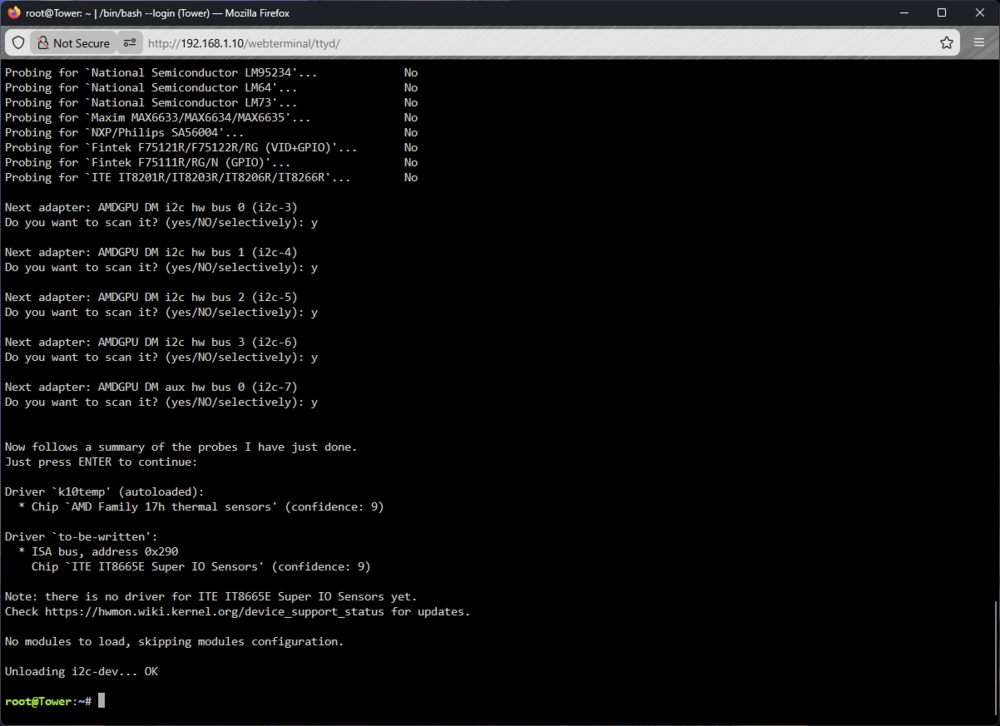
I believe 7.1.2 and 7.1.3 were the Unraid versions I tried previously and had thought they failed. I now believe they were probably just stuck waiting for this sensors process to stop using 100% of my CPU. But I still wanted to get proof of that so first I started with 7.1.4 as you suggested. This is a fresh install on a different USB drive so there is no config setup here. I am seeing the same issue on 7.1.4 as I do on 7.2.2. CPU time is up to 4 minutes+ and the Dashboard hasn't loaded. 7.1.4 I shutdown the server and tried 7.1.3 next. I ran into the same behavior. 7.1.3 I tried 7.1.2 next and it had the same behavior. 7.1.2 Again, I've downgraded my 7.2.2 production install down to 7.0.2 and the issue does not present itself. However, to be thorough I installed a fresh copy of 7.0.1 (I saw no option to download 7.0.2 from the Unraid USB Creator tool) to test it as well. The dashboard takes maybe half a second but loads right up. When I monitor htop and click the dashboard tab on the web GUI I do see the sensors -uA process use CPU time for a split second but it's so fast I can't track it. Using F4 to filter only for "sensors" I do see it sporadically show up, but it does whatever it needs to do and stops running. Here is a screenshot I grabbed of it appearing for a brief moment. 7.0.1: As the issue isn't happening on 7.0.1 ran through the sensors-detect prompts again. It looks identical to the output from 7.2.2 (screenshot on original post) but here is the output at the end in case it helps. Is there a way to track if this is a comparability issue with the newest kernel? Are there logs I can look into the determine what is causing this process to freeze/load forever?
-
@JorgeB I've created a new USB boot disk with Unraid 7.2.2. It looks like the behavior is the same. After setting the password via the web GUI I tried going to the dashboard. It is not loading and I do see the same sensors process running utilizing 100% cpu time on a single core/thread that bounces around. Eventually the process stops using CPU resources and the dashboard loads. I've downloaded the diagnostics on this fresh install in case it is helpful. I forgot to mention but another troubleshooting step I took prior to submitting this ticket was to update the bios on my system. The bios that was on there prior wasn't even a year old but I figured I'd try it. It did not change the behavior, but at least I am now on the latest bios. Yay? tower-diagnostics-20251204-1247.zip
-
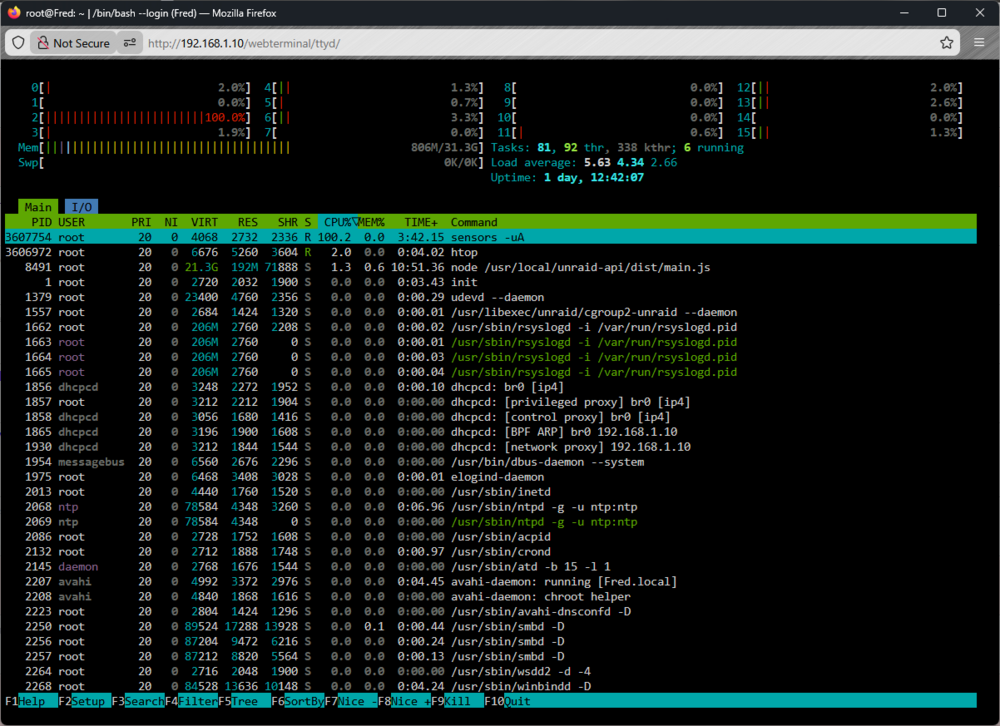
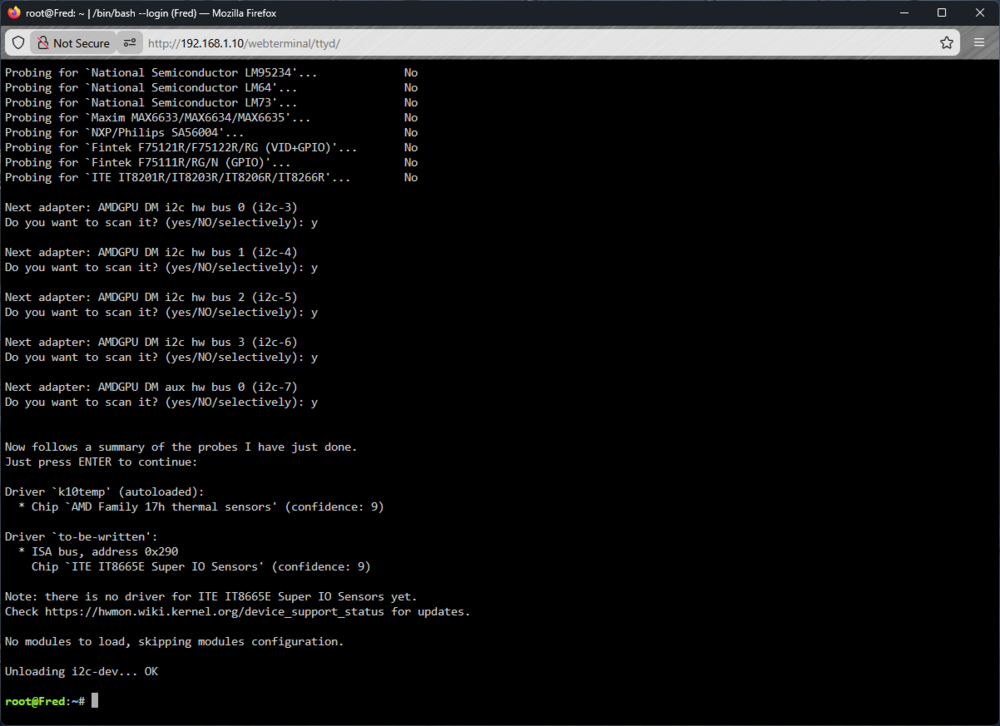
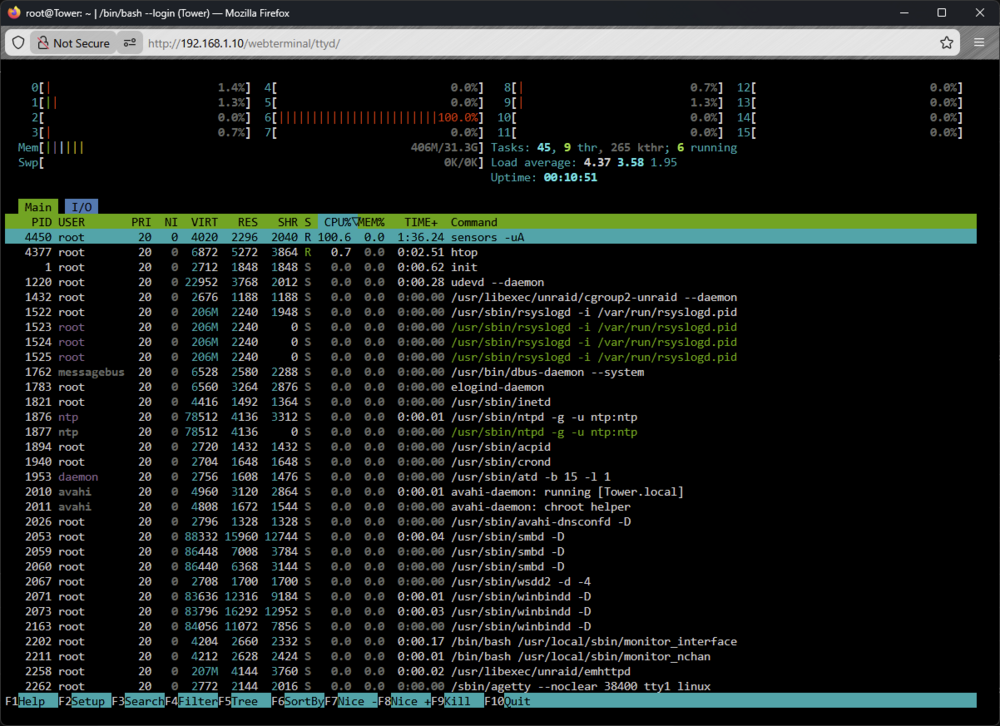
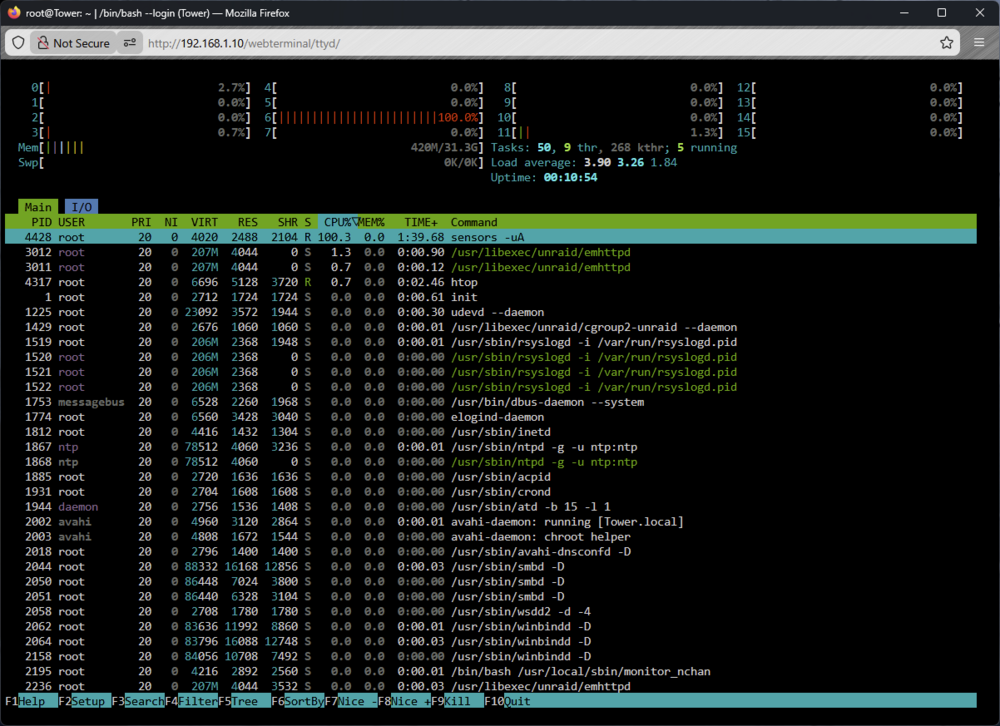
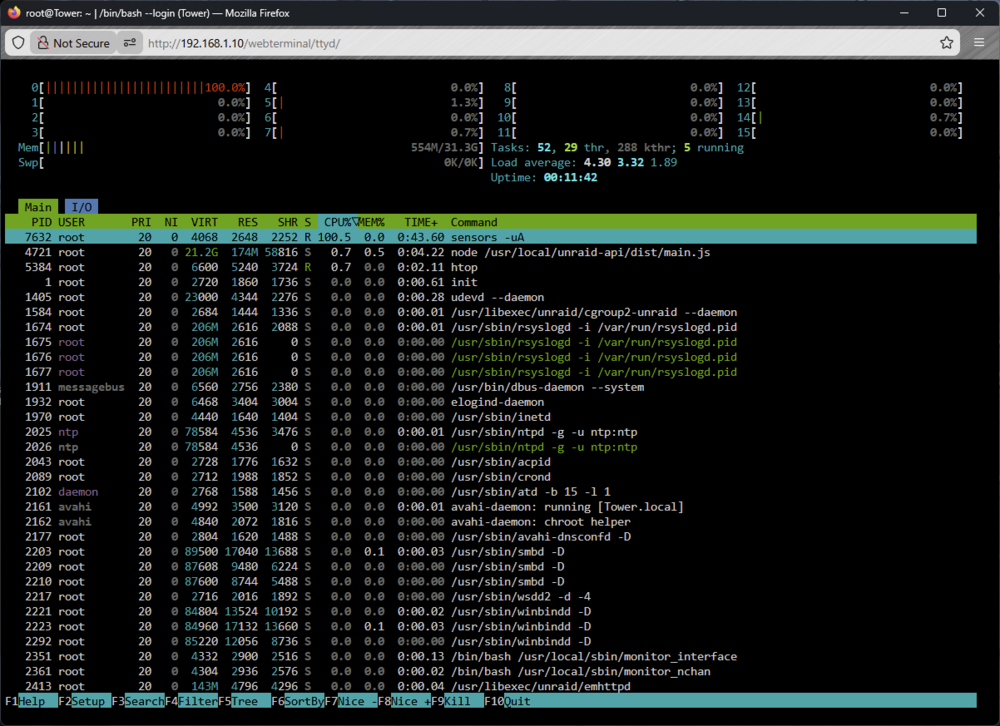
I've tried searching around to see what is causing this issue but I can't seem to find any answers. I've had issues upgrading from 7.0.1 to any newer version. At first I thought the upgrade was failing due to my chassis/CPU fans spinning up after applying the patch, and the web interface not coming back up. In the past I've had to re-image my USB drive back down to 7.0.1 to get Unraid to work. Well, after just ignoring the issue for a few months I checked in and found that version 7.2.2 was out, so I figured I'd give it another shot. After trying to update to 7.2.2 my CPU/chassis fans started spinning up again. I was in the middle of doing something at work so I just let it run. After I finished up at work I came back to my Unraid server and found that the web UI was working. I imagine the previous updates would have eventually worked if I had given them enough time as well. After logging in the fans started spinning up again and the UI became unresponsive. Long story short, I found out that there is a process called sensors that runs with the syntax -uA that is eating up 100% CPU time on a single core. The single core the process utilizes changes every few seconds. I believe this is the cause of my web UI locking up and my fans running at full tilt. I've also found that this process starts to use 100% CPU (1T) whenever I go to the Dashboard from the web UI. I found this out by using the terminal and htop command. Here is a screenshot of it going. As you can see in this instance it has been running at 100% CPU utilization for over 3 minutes. I've had it take 15 minutes+ before. I did some brief googling and the AI overlords said to try running sensors-detect command. This led me through some prompts to scan for various sensors. I said Yes to all checks to detect all sensors. It then gave me a summary of what it did but I am not sure how to interpret the output. I am not super experienced in linux environments. Here is the end output. Lastly, I tried rebooting in safe mode to see if it was one of my plugins. I run into the same issue in safe mode. I've also tried deleting a few of my sensor plugins that I had installed. Things like Dynamix System Stats and Dynamix System Temp. No change in behavior. The only thing that stops the issue is if I downgrade back to 7.0.1. Once I do that everything works great again. As I said, I am not experienced debugging linux but I'd love it if someone had any ideas for me to try. fred-diagnostics-20251203-1018.zip