

dchsueh
-
Posts
14 -
Joined
-
Last visited
dchsueh's Achievements
")
Noob (1/14)
0
Reputation
-
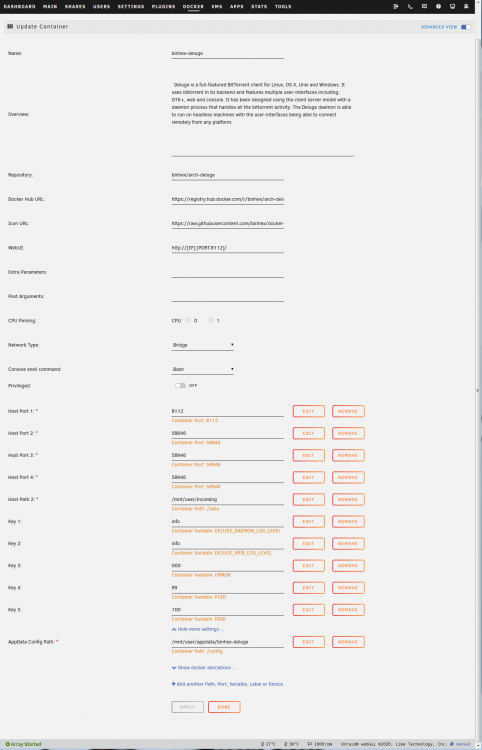
For the previous post I had configured the container to use port 8118 as a test to see if the setting was being used, I don't run privoxy myself and nothing else was using port 8118 at the time. In any case, I restored the setting to port 8112 bridged, and issue still exists. Here's the screenshot:
-
1. no firewalls 2. no vlans 3,4. different browser, different machines, no change 5. wget calls from webterminal shell or from completely separate machine result in a sequence of: # wget http://192.168.0.185:8118/ --2020-07-14 21:26:32-- http://192.168.0.185:8118/ Connecting to 192.168.0.185:8118... connected. HTTP request sent, awaiting response... No data received. Retrying. --2020-07-14 21:26:33-- (try: 2) http://192.168.0.185:8118/ Connecting to 192.168.0.185:8118... connected. HTTP request sent, awaiting response... No data received. Retrying. ... ... which explains the in-container TIME_WAIT sockets - a connection got through albeit immediately ended 6. bridge or br0 both result in the same -- but I found an interesting behavior, a br0 always results in port 8112 bound (ignores configured port), whereas a bridge config will use the configured port number (as seen in the example above; and I can confirm that nothing is at 8112 as it results in "Connection refused") -- add: a. this behavior exists even after removing the container and /mnt/user/appdata/binhex-deluge and adding it fresh; I'll repeat things were working fine a week ago and I don't believe anything is different now with either my network or unraid setup b. unraid webterminal "iptables -L" output reports a set of "Chain DOCKER" rules when net is bridge, none when br0, consistent with other containers I have running
-
Doubt there is a conflict - right now, I'm setup on br0 with a separate IP address (and other containers on br0, e.g. pihole, work fine). "netstat -al" in-container shows something listening on port 8112 ("tcp 0 0 0.0.0.0:8112 0.0.0.0:* LISTEN") attempting a webui browser connection results in multiple netstat "tcp 0 0 containerid:8112 mypc:highportnum TIME_WAIT" lines appearing "telnet localhost 8112" in-container gets a connection "telnet containerip 8112" from off-container results in an immediate disconnect and a single netstat TIME_WAIT line in-container (but I can telnet to my pihole br0 ip port 80 just fine...?!?!?!) -- add: last few log lines are: 2020-07-12 00:05:02,619 DEBG 'deluge-script' stdout output: [info] Starting Deluge Web UI... 2020-07-12 00:05:03,620 DEBG fd 8 closed, stopped monitoring <POutputDispatcher at 140388658095824 for <Subprocess at 140388658098032 with name deluge-script in state RUNNING> (stdout)> 2020-07-12 00:05:03,624 DEBG fd 10 closed, stopped monitoring <POutputDispatcher at 140388658095872 for <Subprocess at 140388658098032 with name deluge-script in state RUNNING> (stderr)> 2020-07-12 00:05:03,624 INFO exited: deluge-script (exit status 0; expected) 2020-07-12 00:05:03,624 DEBG received SIGCHLD indicating a child quit
-
I'm running binhex-deluge, not binhex-delugevpn
-
I'm seeing this as well. Was working a few days ago, and now firefox is reporting "The connection to the server was reset while the page was loading." Nothing looks out-of-the-ordinary in /config/deluge.log or /config/deluge-web.log Behavior is the same whether I run the container bridged or br0 with its own ip address. Other containers on br0 or bridged network respond just fine. Ideas?
-
I am also unable to install ubuntu 15.10 desktop - it hangs after the disk partitioning step ubuntu 14.04.3 desktop installs just fine -- edit: running 6.1.6, custom vm, 512M memory, 10G vda, VNC graphics, no sound
-
unable to get any deluge docker container to announce - bad udp cksum
dchsueh replied to dchsueh's topic in General Support
Sorry, the udp cksum error is probably a red herring. This is the name lookup for the (supposedly) following announce. So it looks like no announce is actually going out. I'm comparing to a tcpdump of Transmission, and I see announces going out and replies getting back. I'm still at a loss on how to debug this. -
Hello, Sorry for posting here, but I'm having a general problem, not specific to needo / binhex / linuxserver.io versions of deluge containers, but with deluge itself. I did nothing to change my configuration or update the containers when things stopped working about 1.5 weeks ago. My torrents are not successfully announcing to the tracker, and started looking into if I can actually observe the announces and replies. I figured out how to get into the container, did a tcpdump, and found: 13:13:21.434599 IP (tos 0x0, ttl 64, id 53452, offset 0, flags [DF], proto UDP (17), length 65) acbd263a440b.59039 > 192.168.0.1.domain: [bad udp cksum 0x6d09 -> 0xd04a!] 52588+ A? zzzzzzz.zzzzzzz.zzz. (37) 13:13:21.445184 IP (tos 0x0, ttl 58, id 14344, offset 0, flags [none], proto UDP (17), length 97) 192.168.0.1.domain > acbd263a440b.59039: [udp sum ok] 52588 q: A? zzzzzzz.zzzzzzz.zzz. 2/0/0 zzzzzzz.zzzzzzz.zzz. A yyy.yy.yyy.yy, zzzzzzz.zzzzzzz.zzz. A yyy.yy.yyy.yy (69) where zzzzz represents the tracker's hostname and yyyyyy represents the associated ipaddress. I am able to run another bittorrent client (gfjardim-Transmission) and it works fine. Does anyone have any suggestions on how to debug this? Thank you.
-
Hello, Is there a prepackaged plugin (similar to Nerd Tools by eshultz) that installs tcpdump on an unraid6 box? I believe it would help me debug some docker container problems. Thanks!
-
im not seeing any tracker issues with deluge, seeing the normal "Announce OK", are you sure the tracker isnt down?. can you post the python traceback your on about?. edit - one other thing to verify is that you have port 58946 port defined for the container, there should be an entry for tcp AND udp for this port in the unraid webui, if you dont have both protocols then you may get a failure to connect to the tracker. Ports are fine, both TCP and UDP are defined. Tracker is up - I can connect just fine with gfjardim-Transmission. Log as viewed from webgui's docker tab, clicking on log icon: 2015-10-15 09:43:13,477 CRIT Set uid to user 0 2015-10-15 09:43:13,477 WARN Included extra file "/etc/supervisor/conf.d/deluge.conf" during parsing 2015-10-15 09:43:13,481 INFO supervisord started with pid 1 2015-10-15 09:43:14,486 INFO spawned: 'deluged' with pid 9 2015-10-15 09:43:14,488 INFO spawned: 'deluge-web' with pid 10 2015-10-15 09:43:15,136 DEBG 'deluged' stderr output: Unhandled error in Deferred: Traceback (most recent call last): File "/usr/lib/python2.7/site-packages/deluge/main.py", line 230, in start_daemon Daemon(options, args) File "/usr/lib/python2.7/site-packages/deluge/core/daemon.py", line 161, in __init__ component.start("PreferencesManager") File "/usr/lib/python2.7/site-packages/deluge/component.py", line 296, in start deferreds.append(self.components[name]._component_start()) File "/usr/lib/python2.7/site-packages/deluge/component.py", line 124, in _component_start d = maybeDeferred(self.start) --- --- File "/usr/lib/python2.7/site-packages/twisted/internet/defer.py", line 150, in maybeDeferred result = f(*args, **kw) File "/usr/lib/python2.7/site-packages/deluge/core/preferencesmanager.py", line 160, in start self._on_set_listen_ports) File "/usr/lib/python2.7/site-packages/deluge/config.py", line 312, in register_set_function function(key, self.__config[key]) File "/usr/lib/python2.7/site-packages/deluge/core/preferencesmanager.py", line 254, in _on_set_listen_ports self.session.listen_on(value[0], value[1], str(self.config["listen_interface"]).strip()) exceptions.RuntimeError: Address family not supported by protocol 2015-10-15 09:43:16,137 INFO success: deluged entered RUNNING state, process has stayed up for > than 1 seconds (startsecs) 2015-10-15 09:43:16,137 INFO success: deluge-web entered RUNNING state, process has stayed up for > than 1 seconds (startsecs) And after I request stop: 2015-10-15 09:43:47,812 WARN received SIGTERM indicating exit request 2015-10-15 09:43:47,813 DEBG killing deluge-web (pid 10) with signal SIGTERM 2015-10-15 09:43:47,813 INFO waiting for deluged, deluge-web to die 2015-10-15 09:43:47,876 DEBG fd 9 closed, stopped monitoring (stdout)> 2015-10-15 09:43:47,876 DEBG fd 14 closed, stopped monitoring (stderr)> 2015-10-15 09:43:47,877 INFO stopped: deluge-web (exit status 0) 2015-10-15 09:43:47,877 DEBG received SIGCLD indicating a child quit 2015-10-15 09:43:47,878 DEBG killing deluged (pid 9) with signal SIGTERM 2015-10-15 09:43:50,881 INFO waiting for deluged to die 2015-10-15 09:43:53,884 INFO waiting for deluged to die 2015-10-15 09:43:56,887 INFO waiting for deluged to die -- Edit: I should mention that needo-Deluge was working fine until about a week ago. I tried binhex-Deluge after requesting help and not getting any responses in the needo support forum thread.
-
I'm having problems with deluge, both the binhex and needo versions. No announces get through; tracker status just says "Error:". binhex version actually has a log that says something that is virtually identical to the python error traces already posted in this thread. needo deluge and gfjardim Transmission logs just say "No SSH host key available. Generating one..." but at least Transmission is able to announce and get a proper reply.
-
same problem is happening with binhex-deluge, although the deluge log actually does contain some real content
-
Need some help with deluge -- it was working fine until a few days ago, and then all of a sudden every announce is met with an error In the deluge client, I only see "Tracker Status: sitename.org: Error:" (where sitename.org is the actual tracker). In the webGui docker tab, if I try to view the log for the deluge container, I get a window with "No SSH host key available. Generating one..." and the request never completes. deluge log shows nothing/empty Any ideas?
-
Hello, I ran into a strange situation. I precleared a disk successfully (it was originally a parity disk). It was sitting unallocated for a while before I stopped the array to add it. unRAID recognized it as a new disk and (GUI) presented the standard checkbox, clear disk button, with warning. There was no option to start the array otherwise. In unRAID5 I have done this and the disk was immediately accepted into the array. In my case, after clicking clear button, the web GUI refreshed to the same page - present the checkbox and clear disk button.... I could not advance it at all. dmesg output said Jun 19 12:32:13 Tower kernel: md: import disk6: [8,64] (sde) WDC_WD30EFRX-68EUZN0_WD-xxxxxxxxxxxx size: 2930266532 Jun 19 12:32:13 Tower kernel: md: disk6 new disk I decided to reboot after a few seemingly ineffective clicks. Upon reboot, I had to stop the array and add the disk again. I ticked the clear disk checkbox and submitted clear button, and the array started to do the long clearing activity. The disk was not recognized as precleared. I am using preclear_disk.sh 1.15, the same one I've used successfully with unRAID5. Anybody try a similar scenario, and have it add a precleared disk immediately? Thanks. -- addendum: running unRAID 6.0.0; after the reboot the checkbox+clear was the only option to start the array
