greg_gorrell
Members
-
Joined
-
Last visited
Everything posted by greg_gorrell
-
It appears that this is the only support for d8sychain's Mediawiki image so hopefully I am not wasting my time with a forum that sees no users.. I had been running the same Mediawiki image in my environment for six years now and haven't had a single issue. I cannot recall the version, as last week I had to migrate my Docker environment to a new pool I had built. My instance runs a separate MariaDB container, both of which are on a private network in Docker, which is behind NGINX (Let'sEncrypt/SWAG from LS.io). I mention those facts though the relevance may be negligible. After moving my Dockers, I am only able to get a 500 back, whether I try to access via the IP address or the FQDN through the proxy. In my troubleshooting, I switched to the latest version which I think screwed me. I notice the env variable is for HTTP, which I have never used to access Mediawiki, in fact Nginx is set to issue permanently redirect via 80. I am not sure when that changed but I have been playing with config and adjusting ports with no luck. I also see that somewhere along the line, this container has been set to use an internal database? I am assuming since my config files point to a different IP for the database, that should not be an issue. Can anyone point me in the right direction of what to troubleshoot further? To add, it does appear that things are operational on the backend and this appears to me to be an issue with the web server. See below logs, which begin following typical startup. Thanks in advance! [services.d] done. {"name":"parsoid","hostname":"dc4f34a09752","pid":392,"level":30,"levelPath":"info/service-runner","msg":"master(392) initializing 4 workers","time":"2026-01-19T17:18:42.811Z","v":0} {"name":"lib/index.js","hostname":"dc4f34a09752","pid":410,"level":30,"levelPath":"info","msg":"loading ...","time":"2026-01-19T17:18:44.761Z","v":0} {"name":"lib/index.js","hostname":"dc4f34a09752","pid":410,"level":30,"levelPath":"info","msg":"ready on :8142","time":"2026-01-19T17:18:44.800Z","v":0} {"name":"lib/index.js","hostname":"dc4f34a09752","pid":421,"level":30,"levelPath":"info","msg":"loading ...","time":"2026-01-19T17:18:46.653Z","v":0} {"name":"lib/index.js","hostname":"dc4f34a09752","pid":421,"level":30,"levelPath":"info","msg":"ready on :8142","time":"2026-01-19T17:18:46.685Z","v":0} {"name":"lib/index.js","hostname":"dc4f34a09752","pid":432,"level":30,"levelPath":"info","msg":"loading ...","time":"2026-01-19T17:18:48.407Z","v":0} {"name":"lib/index.js","hostname":"dc4f34a09752","pid":432,"level":30,"levelPath":"info","msg":"ready on :8142","time":"2026-01-19T17:18:48.438Z","v":0} {"name":"lib/index.js","hostname":"dc4f34a09752","pid":443,"level":30,"levelPath":"info","msg":"loading ...","time":"2026-01-19T17:18:50.169Z","v":0} {"name":"lib/index.js","hostname":"dc4f34a09752","pid":443,"level":30,"levelPath":"info","msg":"ready on :8142","time":"2026-01-19T17:18:50.203Z","v":0} {"name":"parsoid","hostname":"dc4f34a09752","pid":392,"level":40,"levelPath":"warn/service-runner","msg":"startup finished","time":"2026-01-19T17:18:50.206Z","v":0}
-
Just a quick look at the logs and your drive config shows some sort of BTRFS corruption. Without digging in further, I cannot say for sure but there is a possibility that the memory problems lead to corrupt filesystem or you have a bad drive/controller. I say this because the high number of errors in the SMART stats and the system log entries like this one: I would start by using a known good drive for cache or testing it on the array to rule the drive out.
-
Yes, that is the name of the zpool. I did notice that everything works fine with a fresh docker.img file created on the cache or array via the settings and the appdata folders on the zpool, so it is definitely some weird little bug with using ZFS. It works for now, I'll see what happens with the official ZFS implementation when it comes around. Apologies for the delay in responding, I had a drive go on the other server that kinda took priority lately but thank you for taking the time to check out the diagnostics and offer input.
-
Perhaps I am not asking in the correct way. Could somebody please explain to me how the web interface interacts with the underlying services? When I click "reboot server" on the main page, what has to happen for the "shutdown -r" command to be executed by the system? Is it possible that the web server component of Unraid sends a command to the system and will not move on until that command is completed? Is it possible I have an issue with Docker or ZFS and that issue is why the timeout is occurring, rendering the timeout more of a symptom than a cause for the problem? Thanks again.
-
Thanks for the reply Squid, but I honestly am not sure what would be causing this issue but the "upstream timeout" seems to be in the log every time this happens. To clarify though, I don't suspect CA has anything to do with it and just happens to be related to the job I was performing at the time this happened most recently. Generally, the timeout occurs when I am accessing the Docker page and not the CA Apps page, like it timesout when querying the service. Since I am getting no other information from the logs, I have no clue where to start but it seems that the issue lies with the query itself from the Web GUI and the Dockers. Maybe not, but when I start the array and run it with either Docker disabled completely or Docker enabled with no containers running, the issue does not manifest itself. After a couple Docker containers are running, at some point this timeout will occur and any subsequent commands to control a service will not execute, whether sent over SSH or the web interface. I am going to attempt to move all of the docker related stuff off the zpool and onto a cache drive managed by Unraid, but any assistance on how to better troubleshoot this would be greatly appreciated.
-
Hello, I have an H ML350P with plenty of resources, been attempting to upgrade from 6.8.2 to 6.9.2 for quite some time now. Each time I do, I am unable to start more than a few docker containers before the Web GUI starts acting erratically. I am not sure what the cause is, and the only thing I see in the logs in common with each occurrence is the following "upstream time out" error messages: Jan 29 09:49:19 ML350P nginx: 2022/01/29 09:49:19 [error] 9325#9325: *902 upstream timed out (110: Connection timed out) while reading response header from upstream, client: 10.0.0.51, server: , request: "POST /plugins/community.applications/scripts/notices.php HTTP/1.1", upstream: "fastcgi://unix:/var/run/php5-fpm.sock", host: "10.0.0.101", referrer: "http://10.0.0.101/Main" After this error shows in the log, no commands to the server will work. While I can still navigate the web interface, aside from the Docker page which just tries to load endlessly, I am unable to send a command to stop or restart the docker service. The machine will not reboot either with the button on GUI or by command line. The syslog indicates the system is going down for reboot, but the nothing happens after that. I have not been able to pin this down to a particular container and seems to be fine when no containers are running. As soon as I fire up three or so, I can expect the issue to occur again. Also, I should note that I am using ZFS and that is where my docker config and containers are located. I have also tried deleting the docker image file as well, now I cannot even get them to run from the templates. I am thinking this may be a ZFS issue, but is there anywhere else I can look for some clues? Here is what happens when I tried to add my dockers back: Jan 29 10:20:44 ML350P nginx: 2022/01/29 10:20:44 [error] 7556#7556: *2249 upstream timed out (110: Connection timed out) while reading upstream, client: 10.0.0.51, server: , request: "POST /Docker/AddContainer?xmlTemplate=user%3A%2Fboot%2Fconfig%2Fplugins%2FdockerMan%2Ftemplates-user%2Fmy-UniFi-Video.xml&rmTemplate= HTTP/1.1", upstream: "fastcgi://unix:/var/run/php5-fpm.sock:", host: "10.0.0.101", referrer: "http://10.0.0.101/Docker/AddContainer?xmlTemplate=user%3A%2Fboot%2Fconfig%2Fplugins%2FdockerMan%2Ftemplates-user%2Fmy-UniFi-Video.xml&rmTemplate=" Thanks in advance! ml350p-diagnostics-20220129-1040.zip
-
Does anyone know why I would be unable to access Heimdall all of a sudden? It worked fine for a year now then over the past week since we had a power outage, I try to login and go to a 419 page informing me that my session expired. I just access this container inside my network via IP so no reverse proxying or DNS issues. I also tried deleting the keys and still had no luck. What might be causing this and how can i force a new session?
-
Yes, I was getting all smart data when running manually. Looking at files in /var/local/emhttp/smart, it is clear that the underlying command hard-coded into the dynamix webgui is not running properly nor is it affected by what settings are entered for either each disk or globally. See my last post though, I explored the code a little bit last night and believe that this is something currently be resolved and would expect to see in next beta release. Lots of lines were removed in and only one added, and I am not even sure how to interpret it correctly: if (file_exists("$file") && exec("grep -Pom1 '^SMART.*: \K[A-Z]+' ".escapeshellarg($file)." |tr -d '\n' 2>/dev/null", $ssa) && in_array("$ssa",$failed)) { as referenced in this commit on July 12: https://github.com/limetech/webgui/commit/6f8507e5474e9b77fef836ee7379a1bee25a7a5b
-
I just spent the whole evening trying to figure out what is going on here. After playing around int he Global Disk Settings, trying various SMART controller types and testing, I think I have some answers. I set the SMART controller to HP cciss globally and it wouldn't work. I tried a few others, eventually landing on "SAT," whatever the hell that may mean. To my surprise it returned all of the data I was looking for. Every one of the fields are populated and temperature data works, although like in the case of OP, it doesn't transfer to the Main page. As mentioned before, the Dynamix webGUI is pulling the data from the /var/local/emhttp/disks.ini file. You would think this information might be related to the data in the files contained in the /var/local/emhttp/smart/ directory which seem to query the SMART data from the disk, but it appears that the files in the smart folder are not connected in any way. In my case, the directory contains basic text file for each disk that contains what would be the smartctl output for that device, as well as a file of the same name with a .ssa extension. No matter what SMART controller I select in the disk settings, the information in these files does not seem to change and just reports the following: After doing some more searching, none of these files have anything to do with the Dashboard or Main pages. It seems that others have had issues with the Areca controllers in which it has been stated that the smart reporting on Dashboard and Main pages are hard-coded in emhttp and the parameters are not able to be defined by the user. I checked out the webgui code and it and I want to say they are currently working on a fix for this, as there was a commit last month removing the smartctl command from the monitor script. The extent of my PHP knowledge is reading a couple chapters of PHP in 24 hours 20 years ago when I was in middle school, so I could be full of bs here. I just spent way too much time into this last night when I could have been implementing a script to alert me to issues via another method. Hopefully some devs can chime in on what is going on or if anyone here is familiar with the codebase and wants to check it out. It definitely seems like something too simple to just leave not working properly, especially when thats kind of an important feature for this OS.
-
I just picked up an ML350P Gen8 and am going through the same issue currently. I put the P420i controller into HBA mode after getting all the firmware up to date and just have been doing some testing before I try to migrate everything over. I have a hodgepodge of SATA drives installed, different brands sizes, etc. and haven't noticed any issues with the fan speeds since running Unraid so I am taking that as a good sign. Unraid lists no temps or SMART data for any of the drives, but I am able to retrieve it via the smartctl command as you mention. One of my ideas was to try to use iLO and set an alarm for this but of course there is no easy way to install the agent that reports this data into Unraid, although I am considering trying to convert the rpm into a txz if there is no easy way to obtain the data in the GUI. If you are still working on this, I would be glad to exchange notes here and see if we can't figure out a way to solve this. It's so strange to me that Unraid can be so polished in many aspects and fall flat in others, especially when it's paid software and this mature. Regardless, I am going to try some things tonight and will share what I come up with if noteworthy.
-
That is odd, in Chrome it does not work either and I simply get ERR_SSL_PROTOCOL_ERROR. My configuration is pretty much the same, although some of the directives are are defined in the ssl.conf and proxy.conf files. Just to verify, I removed the proxy-conf file for mediawiki I created and added your config you shared above. I get the exact same results in Firefox and Chrome now, without the ability to connect via IP internally now though. Any thoughts there? Could it be an issue with letsencrypt and/or the cert maybe?
-
I am using this container on Unraid behind the Linuxserver.io letsencrypt container. I see that you recommended that in your documentation, which is very good I might add. I have learned a lot from your notes, so thanks for that. I am still new to Nginx though, and am having some issues getting it to work properly with mediawiki. I have tried using the docuwiki proxy config in the letsencrypt container and changing the proto, ip, port as needed but still having no luck. Currently, I am able to access the mediawiki container via IP internally, but when attempting to use the domain name I end up with an error: SSL received a record that exceeded the maximum permissible length. Error code: SSL_ERROR_RX_RECORD_TOO_LONG Can you share a configuration that works please? I would assume I am just directing it to the container IP:PORT with proxy_pass, but I can't semm to figure out the issue. I will note that I have a password enabled as well, just in case it is relevant. Thanks!
-
I came here with the exact same problem after noticing that my /books folder had no content and the database and books were written to the /appdata path. If you would literally read the last page of this thread (this page), you would find the answer just as I did and wouldn't have to ask the same question. Searching and reading the threads would help in not cluttering the forums with the same question that has already been answered. As stated before, when you run the wizard upon setup, make sure you have the /disk/books path set correctly. Your content is being written to the image because the path for the library was changed via the wizard. As mentioned above, reading the posts on this thread should clue you into this.
-
Well I tried both, but it was going in and editing existing entries and adding the http/https to beginning of link. It didn't work until I removed the container and appdata and reinstalled. Only then was I able to use http for each link and have it work. Thanks for the reply!
-
Anyone know why every item I create on the page ends up with a hyperlink of "10.0.0.2:8443/10.0.0.100:80" instead of simply the address to the container or URI the item is for, 10.0.0.100:80 in this instance? I have tried completely wiping the container and various ways of entering the correct information, as well as searching for some file to edit in the configs with no luck.
-
I think development has ceased on this product. I was using malvarez00's docker and while I didn't have the logs filling up, three different times in the past month I would try to log in and it would hang on starting database services. I found no issues in the logs and each solution I tried ended in a different problem. That support thread was way worse than this one, and no one was even checking it. I attempted to install this Docker and it will not even let me log in. I fire it up for the first time and create a local account, then it boots me to the login screen. Once I enter my creds, it hangs. Unfortunately I think out investment in these cameras was a bad idea and with no more support on the software, Ubiquiti has really lost my respect. I was starting to turn clients onto them for the ease of use, great price point, and amazing community but I have to say I will be searching for alternatives now. What a joke.
-
I have had one hell of a time getting this thing going in the past and just want to note that you must have another user besides admin added for it to work.
-
When I check for the crash report in the directory given, there are no .dmp files. The directory is empty. What is going on? This only started happening with the latest update. i'm unable to reproduce locally on my 6.2 final unraid box. can you please provide the output obtained by following this post. http://lime-technology.com/forum/index.php?topic=40937.msg481150#msg481150 root@localhost:# /usr/local/emhttp/plugins/dynamix.docker.manager/scripts/docker run -d --name="PlexMediaServer" --net="host" --privileged="true" -e TZ="America/New_York" -e HOST_OS="unRAID" -v "/mnt/cache/appdata/plexmediaserver/":"/config":rw -v "/mnt/user/Media/Movies/":"/Movies":rw -v "/mnt/user/Media/Music/":"/Music":rw -v "/mnt/user/Media/TV/":"/TV":rw limetech/plex 7935be23a4ccf35f3eb8839ea52d3f61fb8f689fb716c8055963c901fbb16039
-
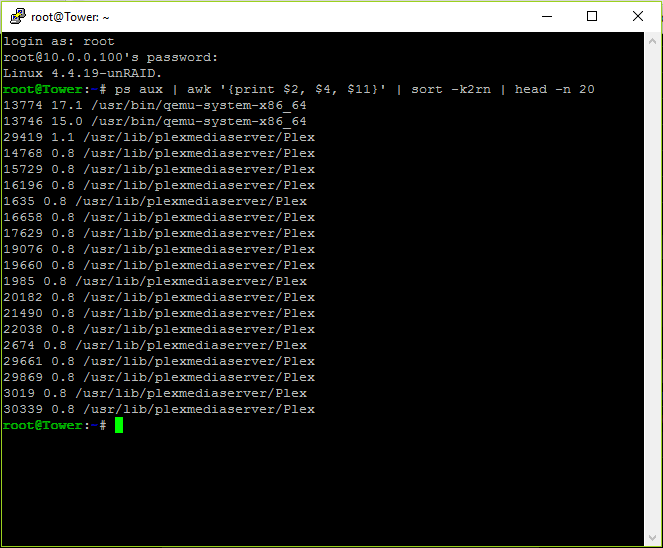
Can anyone help me figure out why Plex keeps crashing, and filling up my RAM until the whole server becomes unresponsive? Over 5 minutes, these Plex processes fill up 10% of my RAM and keeps opening new processes until the RAM is depleted. Here is the log: When I check for the crash report in the directory given, there are no .dmp files. The directory is empty. What is going on? This only started happening with the latest update.
-
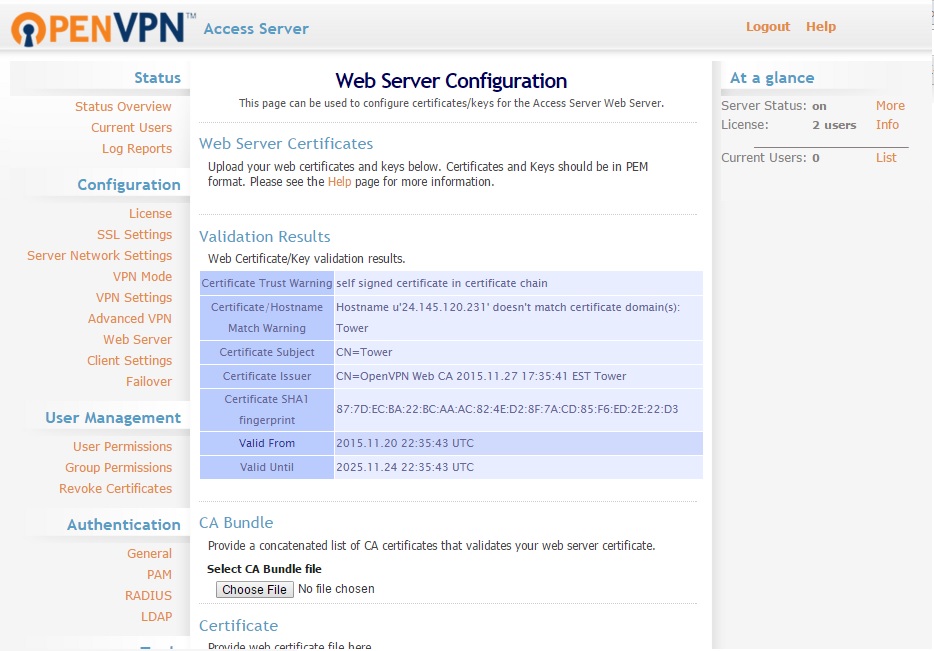
I have the OpenVPN-AS docker installed on my server. What are the benefits to using this plugin over my current setup? I had one hell of a time getting everything set up with the docker, as there is no generating a cert or anything. Is this a pretty simple setup?
-
Wait, I see what you are saying.. I was referring to the connectivity test. It will not work for me but everything seems to be fine other than that.
-
Sweet deal, thanks man. I am able to connect over the internet from my phone to the admin account and i have internet access so it seems like everything is working, although I cannot connect to server from the web interface. I am not going to worry and Ill test it out from my laptop later on. Thanks again!
-
So basically, I can use the unsigned certificate then and it will still be secure?
-
I have mine all set up finally and am able to connect locally, but can anyone direct me where to figure out how to get the certificates working right? No matter where I try to connect from, or even the web client tells me the site is not signed and give me certificate errors. In order to use this docker, do I need to download openssl and go through all that to generate a certificate? Isn't there a newb guide to this? I have gone through all the openvpn docs and it all seems like so much just to get a simple tunnel going.