


clincher
Members
-
Joined
-
Last visited
-
You were correct. This ended up being a CPU issue. I have three 6132 Xeons I got from work. I was finally able to get video on my 2060 AND get the plugin working after trying the 3rd Xeon! Thanks for the advice!
-
Yes, works fine in another computer. As stated above, I tried two other Nvidia GPUs with the same behavior (GTX 1080 and GTX 650). Both hang and crash when installed on the board. Maybe I'll hit up Supermicro and see if there's something known.
-
Yes, there are two x16 slots. I've tried both.
-
Yes, there were two diagnostics. One with the GPU installed and no plugin and one diagnostic without (sans) the GPU installed and plugin installed. The card is seated fine when installed. If I try and boot the system WITH the GPU installed and plugin installed, the system will hang during initialization and crash. may also NOT use the open source one, just regular latest driver, also remove the modprobe - Yes, I've tried the standard driver and the open source. Both exhibit the same behavior. Hang and then crash reboot. I've tried all of the above. My BIOS doesn't have an RBAR setting anywhere that I can find. 4G is enabled. Newest BIOS for Supermicro is installed. I'm guessing this is just a Supermicro incompatability. Unfortunately, I can't get any useful logs or diagnostics because the system freezes up and doesn't not record anything to syslog or console. When the GPU is installed and plugin is installed, the system hangs at the following console statement during bootup: Starting atd: /usr/sbin/atd -b 15 -l 1 Starting Samba: /usr/sbin/smbd -D /usr/sbin/wsdd2 -d -4 /usr/sbin/winbindd -D Starting mcelog daemon: /usr/sbin/mcelog --daemon Then the system hangs and reboots. I can ping the system IP and see that network begins to come up for about 3-4 pings, but stops when the system hangs. This is essentially how I am testing if the system hangs. Think I'm going to start searching for an alternative motherboard.
-
Got a strange issue and I'm at my wits end. Bought a Supermicro X11SPI-TF motherboard to upgrade my current rig. (256GB ECC DDR4 / 6132 Xeon Gold CPU / Nvidia RTX2060). I had originally bought a Supermicro X11 dual-proc board but returned it because I was having similar issues, but now I think it's related to hardware compatability, but I want to see if I'm missing something. Right now, I'm bench testing the motherboard with similar components to my current rig and using Unraid trial USB to test. Issue is this: I can get UnRAID to boot fine with 2060 installed in any slot (typically Slot 6). When I install the Nvidia plugin, the machine hangs, then crashes and reboots. I've tried a number of different Nvidia driver versions including the open source version (with correct modprobe settings). Everything results in the same behavior. I have 4G Encoding enabled. I've toyed with all sorts of PCIe settings in the BIOS and still this is the behavior every time - hang and then reboot. I get nothing on the terminal or syslogs relating to an error. It just shows the plugin being installed and then hang/crash. I've also tried testing with a GTX 1080 and GTX 650 and both exhibit the same issue. Just seems like there's some anger with Supermicro and GPUs. Disabling the onboard video of the motherboard has no effect either. no change in behavior. If I install the plugin without the GPU installed, it will install fine. I can re-install the GPU and boot to Unraid fine. Although, when you navigate to the Unraid plugin settings or even run diagnostics, it will hang and then crash. When I tried to run diag, it crashes here: ls -lA /sys/class/drm/*/device/driver 2>/dev/null|todos >>'/tower-diagnostics-20240817-1519/system/drm.txt' /usr/bin/nvidia-smi --query 2>/dev/null|todos >>'/tower-diagnostics-20240817-1519/system/nvidia-smi.txt' I'll attach my diags with and without the GPU and plugin installed. Just wondering if anyone has any experience with Supermicro boards and perhaps there's a setting for the Nvidia driver that I can set that may help. I may just end up moving on to a different mobo that isn't so tempermental. I've run memtest+ on the memory - no issues. Grasping at straws. Thanks! tower-diagnostics-20240817-1537 with gpu no plugin.zip tower-diagnostics-20240817-1511 sans GPU with plugin.zip
-
You probably want to look at this: https://github.com/alexjustesen/speedtest-tracker/releases/tag/v0.16.0 It looks like your data just got moved to another table.
-
You are the bomb. That worked! Thank you. It barked on my entry name 'release' number so I just removed it, but after that it worked.
-
Has anyone gotten KVM to pass a BIOS serial to the guest OS? I realize that there's nothing specific to unraid's implementation of KVM, but I've followed the documentation pertaining to passing sysinfo to the guest here: https://libvirt.org/formatdomain.html#elementsSysinfo It never yields a serial number in the OS. I'm testing with Windows 10 as I have an application that requires the BIOS number to run. I saw this post about adding a serial #, but it seems like treading into Unraid OS modification which I'd like to stay away from if possible. https://github.com/atomspring/KVM-BIOS-SerialNo Here's the beginning of my guest XML: <?xml version='1.0' encoding='UTF-8'?> <domain type='kvm'> <name>angrychipmunk</name> <uuid>337e27d5-91b2-4108-79cb-07ebc7dbaf94</uuid> <metadata> <vmtemplate xmlns="unraid" name="Windows 10" icon="windows.png" os="windows10"/> </metadata> <memory unit='KiB'>8388608</memory> <currentMemory unit='KiB'>8388608</currentMemory> <memoryBacking> <nosharepages/> </memoryBacking> <vcpu placement='static'>4</vcpu> <sysinfo type='smbios'> <bios> <entry name='vendor'>LENOVO</entry> <entry name='version'>1.24</entry> <entry name='date'>06/21/21</entry> <entry name='release'>.61</entry> </bios> <system> <entry name='manufacturer'>LENOVO</entry> <entry name='product'>Virt-Manager</entry> <entry name='version'>0.9.4</entry> <entry name='serial'>WF610061</entry> <entry name='uuid'>337e27d5-91b2-4108-79cb-07ebc7dbaf94</entry> </system> <baseBoard> <entry name='manufacturer'>LENOVO</entry> <entry name='product'>20BE0061MC</entry> <entry name='version'>0B98401 Pro</entry> <entry name='serial'>W1KS610061616</entry> </baseBoard> <chassis> <entry name='manufacturer'>LENOVO</entry> <entry name='version'>2.12</entry> <entry name='serial'>6665X0X111F2</entry> <entry name='asset'>40000101</entry> <entry name='sku'>Sku1</entry> </chassis> </sysinfo> <os> <type arch='x86_64' machine='pc-i440fx-7.1'>hvm</type> <loader readonly='yes' type='pflash'>/usr/share/qemu/ovmf-x64/OVMF_CODE-pure-efi.fd</loader> <nvram>/etc/libvirt/qemu/nvram/337e27d5-91b2-4108-79cb-07ebc7dbaf94_VARS-pure-efi.fd</nvram> </os> <features>
-
Hmm... My ESXi server accesses a few shares via NFS. I don't believe ESXi supports SMB. I'll give the hard links disable a try.
-
Ran memtest and it returned errors/failure. I have 4 x 8GB DIMMs so I removed all but one and re-ran memtest. This time it passed OK. I ran on 8GB for a few days with no issues, but at reduced capacity -- i.e. only running plex container and a few others. I have since replaced my RAM with brand new 2 x 8GB ECC DIMMs and turned up the rest of my containers. This morning I woke up to find the following error message and some of my containers unresponsive via network. They showed started, but not accessible. Some worked fine, others did not. I'm wondering if there's an issue with my network interface? I have 3 x NICs in use. eth0 = onboard motherboard ethernet (realtek) - Unraid IP network eth 3 (intel 4 port card) = docker vlan eth 4 (intel 4 port card) = docker vpn vlan Oct 18 23:05:43 teraserver shfs: shfs: ../lib/fuse.c:1451: unlink_node: Assertion `node->nlookup > 1' failed. Oct 18 23:05:47 teraserver kernel: veth25cb69d: renamed from eth0 Oct 18 23:05:51 teraserver kernel: ------------[ cut here ]------------ Oct 18 23:05:51 teraserver kernel: nfsd: non-standard errno: -107 Oct 18 23:05:51 teraserver kernel: WARNING: CPU: 9 PID: 17229 at fs/nfsd/nfsproc.c:853 nfserrno+0x47/0x4f [nfsd] Oct 18 23:05:51 teraserver kernel: Modules linked in: xt_mark nvidia_uvm(PO) veth xt_CHECKSUM ipt_REJECT nf_reject_ipv4 ip6table_mangle ip6table_nat xt_nat xt_tcpudp iptable_mangle nf_tables vhost_net tun vhost vhost_iotlb tap macvlan xt_conntrack xt_MASQUERADE nf_conntrack_netlink nfnetlink xt_addrtype iptable_nat nf_nat nf_conntrack nf_defrag_ipv6 nf_defrag_ipv4 br_netfilter xfs nfsd lockd grace sunrpc md_mod nvidia_drm(PO) nvidia_modeset(PO) drm_kms_helper syscopyarea sysfillrect sysimgblt fb_sys_fops nvidia(PO) drm backlight agpgart nct6775 hwmon_vid ip6table_filter ip6_tables iptable_filter ip_tables x_tables tg3 igb i2c_algo_bit sb_edac x86_pkg_temp_thermal intel_powerclamp coretemp kvm_intel kvm crct10dif_pclmul crc32_pclmul crc32c_intel ghash_clmulni_intel aesni_intel crypto_simd cryptd glue_helper rapl mxm_wmi mpt3sas ahci intel_cstate i2c_i801 intel_uncore libahci raid_class input_leds i2c_smbus scsi_transport_sas led_class wmi button i2c_core [last unloaded: tg3] Oct 18 23:05:51 teraserver kernel: CPU: 9 PID: 17229 Comm: nfsd Tainted: P O 5.10.28-Unraid #1 Oct 18 23:05:51 teraserver kernel: Hardware name: To Be Filled By O.E.M. To Be Filled By O.E.M./X79 Extreme4-M, BIOS P3.40 03/10/2018 Oct 18 23:05:51 teraserver kernel: RIP: 0010:nfserrno+0x47/0x4f [nfsd] Oct 18 23:05:51 teraserver kernel: Code: ff c0 48 83 f8 22 75 e1 80 3d 1b 2b 01 00 00 41 bc 00 00 00 05 75 15 48 c7 c7 b5 09 29 a0 c6 05 05 2b 01 00 01 e8 a5 1f 42 e1 <0f> 0b 44 89 e0 41 5c c3 48 83 ec 18 31 c9 ba ff 07 00 00 65 48 8b Oct 18 23:05:51 teraserver kernel: RSP: 0018:ffffc900007ebe30 EFLAGS: 00010286 Oct 18 23:05:51 teraserver kernel: RAX: 0000000000000000 RBX: ffff8881449c4800 RCX: 0000000000000027 Oct 18 23:05:51 teraserver kernel: RDX: 00000000ffffdfff RSI: 0000000000000001 RDI: ffff88842fa58920 Oct 18 23:05:51 teraserver kernel: RBP: ffff88816987c000 R08: 0000000000000000 R09: 00000000ffffdfff Oct 18 23:05:51 teraserver kernel: R10: ffffc900007ebc60 R11: ffffc900007ebc58 R12: 0000000005000000 Oct 18 23:05:51 teraserver kernel: R13: ffff8883d5db1000 R14: 0000000000000018 R15: ffff88816987c000 Oct 18 23:05:51 teraserver kernel: FS: 0000000000000000(0000) GS:ffff88842fa40000(0000) knlGS:0000000000000000 Oct 18 23:05:51 teraserver kernel: CS: 0010 DS: 0000 ES: 0000 CR0: 0000000080050033 Oct 18 23:05:51 teraserver kernel: CR2: 0000151500b2b060 CR3: 000000000200a002 CR4: 00000000001726e0 Oct 18 23:05:51 teraserver kernel: Call Trace: Oct 18 23:05:51 teraserver kernel: nfsd3_proc_getattr+0x82/0xa1 [nfsd] Oct 18 23:05:51 teraserver kernel: nfsd_dispatch+0xb0/0x11e [nfsd] Oct 18 23:05:51 teraserver kernel: svc_process+0x3dd/0x546 [sunrpc] Oct 18 23:05:51 teraserver kernel: ? nfsd_svc+0x27e/0x27e [nfsd] Oct 18 23:05:51 teraserver kernel: nfsd+0xef/0x146 [nfsd] Oct 18 23:05:51 teraserver kernel: ? nfsd_destroy+0x57/0x57 [nfsd] Oct 18 23:05:51 teraserver kernel: kthread+0xe5/0xea Oct 18 23:05:51 teraserver kernel: ? __kthread_bind_mask+0x57/0x57 Oct 18 23:05:51 teraserver kernel: ret_from_fork+0x22/0x30 Oct 18 23:05:51 teraserver kernel: ---[ end trace fc17d4152dee4af7 ]--- teraserver-diagnostics-20211019-0636.zip teraserver-diagnostics-20211019-0636.zip
-
Not recently or since this started happening. I haven't had any other issues that led me to believe it was hardware related, but I could go ahead and run a memtest and report.
-
Recently started getting general protection faults like below. It's intermittent, but finally leads to being unable to stop dockers and cleanly shutdown. Some dockers will hang or crash. Thought it was related to my NVIDIA drivers - downgraded to earlier version and still having same issues. Only other thing that's changed recently is updated a few plugins and docker images. Not sure I can decipher the GPF below to pinpoint the issue - any help is appreciated. Oct 11 20:45:38 teraserver kernel: general protection fault, probably for non-canonical address 0x27ff888137e4ec5c: 0000 [#14] SMP PTI Oct 11 20:45:38 teraserver kernel: CPU: 9 PID: 6029 Comm: find Tainted: P D O 5.10.28-Unraid #1 Oct 11 20:45:38 teraserver kernel: Hardware name: To Be Filled By O.E.M. To Be Filled By O.E.M./X79 Extreme4-M, BIOS P3.30 04/29/2014 Oct 11 20:45:38 teraserver kernel: RIP: 0010:errseq_sample+0x0/0xe Oct 11 20:45:38 teraserver kernel: Code: 8d 0c d5 00 00 00 00 48 83 ca ff 48 d3 e2 48 f7 d2 48 21 d0 0f 1f 00 48 85 c0 0f 94 c0 0f b6 c0 c3 0f 1f 00 b8 f2 ff ff ff c3 <8b> 07 ba 00 00 00 00 f6 c4 10 0f 44 c2 c3 8b 17 31 c0 39 16 74 1b Oct 11 20:45:38 teraserver kernel: RSP: 0018:ffffc90004ad3cd8 EFLAGS: 00010206 Oct 11 20:45:38 teraserver kernel: RAX: ffff8881cb09c240 RBX: ffff88847e835b00 RCX: 0000000000000064 Oct 11 20:45:38 teraserver kernel: RDX: 0000000000000000 RSI: 0000000500000000 RDI: 27ff888137e4ec5c Oct 11 20:45:38 teraserver kernel: RBP: ffff8881cb0a88b0 R08: ffff8881045a4160 R09: ffff8881cb09c240 Oct 11 20:45:38 teraserver kernel: R10: 0000000000000002 R11: 0000000000000002 R12: ffff88847e835b00 Oct 11 20:45:38 teraserver kernel: R13: 0000000000000000 R14: ffff88847e835b10 R15: 0000000000038900 Oct 11 20:45:38 teraserver kernel: FS: 0000145e5e2de740(0000) GS:ffff88881fa40000(0000) knlGS:0000000000000000 Oct 11 20:45:38 teraserver kernel: CS: 0010 DS: 0000 ES: 0000 CR0: 0000000080050033 Oct 11 20:45:38 teraserver kernel: CR2: 0000145e5e280000 CR3: 0000000104978003 CR4: 00000000001726e0 Oct 11 20:45:38 teraserver kernel: Call Trace: Oct 11 20:45:38 teraserver kernel: do_dentry_open+0x4f/0x289 Oct 11 20:45:38 teraserver kernel: path_openat+0x85e/0x937 Oct 11 20:45:38 teraserver kernel: ? filename_lookup+0xb8/0xdf Oct 11 20:45:38 teraserver kernel: ? verify_dirent_name+0x1d/0x29 Oct 11 20:45:38 teraserver kernel: do_filp_open+0x4c/0xa9 Oct 11 20:45:38 teraserver kernel: ? _cond_resched+0x1b/0x1e Oct 11 20:45:38 teraserver kernel: ? getname_flags+0x24/0x146 Oct 11 20:45:38 teraserver kernel: ? kmem_cache_alloc+0x108/0x130 Oct 11 20:45:38 teraserver kernel: do_sys_openat2+0x6f/0xec Oct 11 20:45:38 teraserver kernel: do_sys_open+0x35/0x4f Oct 11 20:45:38 teraserver kernel: do_syscall_64+0x5d/0x6a Oct 11 20:45:38 teraserver kernel: entry_SYSCALL_64_after_hwframe+0x44/0xa9 Oct 11 20:45:38 teraserver kernel: RIP: 0033:0x145e5e3e7692 Oct 11 20:45:38 teraserver kernel: Code: 58 f6 c2 40 75 3a 89 d0 45 31 d2 25 00 00 41 00 3d 00 00 41 00 74 29 64 8b 04 25 18 00 00 00 85 c0 75 45 b8 01 01 00 00 0f 05 <48> 3d 00 f0 ff ff 0f 87 82 00 00 00 48 83 c4 78 c3 0f 1f 44 00 00 Oct 11 20:45:38 teraserver kernel: RSP: 002b:00007ffedaf71a60 EFLAGS: 00000246 ORIG_RAX: 0000000000000101 Oct 11 20:45:38 teraserver kernel: RAX: ffffffffffffffda RBX: 00007ffedaf71bdc RCX: 0000145e5e3e7692 Oct 11 20:45:38 teraserver kernel: RDX: 00000000000b0900 RSI: 00000000004a6fc8 RDI: 0000000000000009 Oct 11 20:45:38 teraserver kernel: RBP: 00000000004a6ec0 R08: 0000000000000000 R09: 0000000000000000 Oct 11 20:45:38 teraserver kernel: R10: 0000000000000000 R11: 0000000000000246 R12: 0000000000000000 Oct 11 20:45:38 teraserver kernel: R13: 0000000000000004 R14: 0000000000000004 R15: 0000000000449ed0 Oct 11 20:45:38 teraserver kernel: Modules linked in: xt_mark nvidia_uvm(PO) veth macvlan xt_nat nf_conntrack_netlink xt_addrtype br_netfilter xt_CHECKSUM xt_MASQUERADE xt_conntrack ipt_REJECT nf_reject_ipv4 xt_tcpudp ip6table_mangle ip6table_nat iptable_mangle iptable_nat nf_nat nf_conntrack nf_defrag_ipv6 nf_defrag_ipv4 nf_tables nfnetlink vhost_net tun vhost vhost_iotlb tap xfs nfsd lockd grace sunrpc md_mod nvidia_drm(PO) nvidia_modeset(PO) drm_kms_helper syscopyarea sysfillrect sysimgblt fb_sys_fops nvidia(PO) drm backlight agpgart nct6775 hwmon_vid ip6table_filter ip6_tables iptable_filter ip_tables x_tables tg3 igb i2c_algo_bit x86_pkg_temp_thermal intel_powerclamp coretemp kvm_intel mxm_wmi kvm crct10dif_pclmul crc32_pclmul crc32c_intel ghash_clmulni_intel aesni_intel crypto_simd cryptd mpt3sas glue_helper rapl intel_cstate intel_uncore raid_class ahci i2c_i801 scsi_transport_sas input_leds wmi libahci led_class i2c_smbus button i2c_core [last unloaded: tg3] Oct 11 20:45:38 teraserver kernel: ---[ end trace cee35a8be90d51cc ]--- Oct 11 20:45:38 teraserver kernel: RIP: 0010:dentry_string_cmp+0x9/0x44 Oct 11 20:45:38 teraserver kernel: Code: 80 b8 00 00 40 00 ba 00 00 50 00 0f 45 c2 eb 05 b8 00 00 30 00 f6 47 0d 08 74 05 0d 00 00 02 00 c3 31 c0 4c 8b 0c 06 83 fa 07 <4c> 8b 04 07 76 11 4d 39 c8 75 2a 48 83 c0 08 83 ea 08 75 e5 31 c0 Oct 11 20:45:38 teraserver kernel: RSP: 0018:ffffc90005d7bc08 EFLAGS: 00010206 Oct 11 20:45:38 teraserver kernel: RAX: 0000000000000000 RBX: ffff8881c9f4f500 RCX: 000000000000000a Oct 11 20:45:38 teraserver kernel: RDX: 000000000000004f RSI: ffff88810101c020 RDI: 31ff8881c97224f0 Oct 11 20:45:38 teraserver kernel: RBP: 0000004fcef95ec2 R08: ffff8881c9f4f500 R09: 64665f3436646d61 Oct 11 20:45:38 teraserver kernel: R10: 0000000000000002 R11: d0d0d0d0d0d0d0d0 R12: ffff8881cb09c0c8 Oct 11 20:45:38 teraserver kernel: R13: ffff8881cb09c0c0 R14: ffffc90005d7bd40 R15: ffff88810101c020 Oct 11 20:45:38 teraserver kernel: FS: 0000145e5e2de740(0000) GS:ffff88881fa40000(0000) knlGS:0000000000000000 Oct 11 20:45:38 teraserver kernel: CS: 0010 DS: 0000 ES: 0000 CR0: 0000000080050033 Oct 11 20:45:38 teraserver kernel: CR2: 0000145e5e280000 CR3: 0000000104978003 CR4: 00000000001726e0 teraserver-diagnostics-20211011-2039.zip
-
That's great news. I haven't had time to troubleshoot it more, but will let you and the forum know if I make any progress there.
-
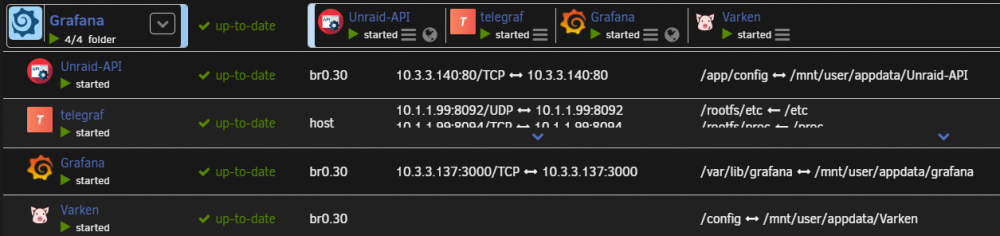
Take a look a few posts back and you'll see me trying to do the same thing. I have a similar setup (but using br0.30 as interface) My experience was that Telegraf would not work at all unless in host mode. You'll need to make sure you have "Host Access to custom networks" turned is ON in order for Telegraf (in host mode) to talk to your InfluxDB container. The only thing I don't have working still is the running VMs/Dockers icons. I haven't had a chance to troubleshoot these. My setup below: HTH

-
Heya... Take a look at post #1 and this post: They have pretty much everything you need.


