


andrew207
Members
-
Joined
-
Last visited
-
for now tho @vidkun i have manually pushed to the :9.2.2 branch, you can just set this in the GUI of unRAID and it should work. i haven't tested upgrades, but fresh container installs will be fine. if it stays good over the next week or so i'll update /latest
-
unsustainably low for this container unfortunately every time I pushed an update previously there were around 20-30k downloads in 24hrs also, they removed auto-builds, so now I have to manually build the image locally then push it to dockerhub... destroying the time I spent building the automated build process i'd prefer to either swap to another free service or I may just nuke this entirely I actually can't get dockerhub to do any builds for me without giving them a credit card that they 'promise they won't charge' update: FWIW I have made a new branch on 9.2.2 that works fine. I had to rebase from Alpine to Ubuntu because Alpine's new MUSL/gcompat layer doesn't work properly (yet). But yeah you'll have to build it locally: git clone -b 9.2.2 [email protected]:andrew207/splunk.git docker build ./splunk --tag andrew207/splunk docker run -d andrew207/splunk -name splunk
-
hey, i stopped pushing upgrades because dockerhub started forcing me to pay money for new builds if there's an alternative to dockerhub that hosts free built images i'll update the public versions of everything to latest, do you know if there's one I can use?
-
thanks @napalmyourmom, I'll add persisting license and user folders as options in the unraid GUI in a future update (should be 9.0.2 shortly after xmas).
-
God dammit you're right @HQToast. It certainly looks like the answer. Might suggest the devs write a message to syslog :P. Cheers.
-
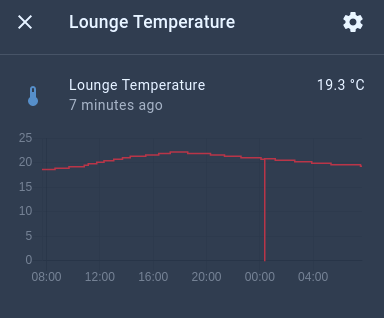
At some point it changed from every night to once a week, I have no idea why. It still happens reliably once a week at ~3AM same as before. My specific problem with this downtime was that a few automations would kick off in Home Assistant when sensors dropped to zero as the Mosquitto container died, I was able to resolve that through application-logic that ignores triggers when everything is reporting zero. So no I never resolved it, but the problem has eased up and I worked around it.
-
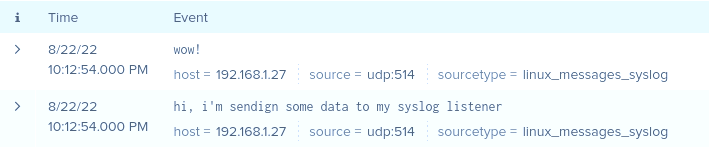
That should work. There are two things you can check: 1. Make sure the port is actually open/listening. Just open a terminal to the docker container and check netstat to make sure port 514 is open and listening. I just added 514 to my server, you can see it listed below as being open. /opt/splunk # netstat -anp | grep splunkd | grep 'LISTEN\|udp' tcp 0 0 0.0.0.0:9997 0.0.0.0:* LISTEN 71/splunkd tcp 0 0 0.0.0.0:8000 0.0.0.0:* LISTEN 71/splunkd tcp 0 0 0.0.0.0:8089 0.0.0.0:* LISTEN 71/splunkd tcp 0 0 0.0.0.0:8088 0.0.0.0:* LISTEN 71/splunkd udp 0 0 0.0.0.0:514 0.0.0.0:* 71/splunkd /opt/splunk # 2. Send a test syslog message. I'm sending to 10514 because that's what I mapped the port to as described in my previous post. You should send to your custom IP:514, because that's what you have configured. Something like: ~ >>> nc -v -u 192.168.1.121 10514 hi, i'm sendign some data to my syslog listener wow! ^CExiting. ~ took 10s >>> Check if it lands in the index. It should, mine did just fine. If this works for you then the problem lies elsewhere, perhaps ask in a broader unRAID support section about remote syslogging.
-
Hey @tknx First configure Splunk to listen for TCP/UDP 514, make sure you set an index for the data. https://docs.splunk.com/Documentation/Splunk/latest/Data/Monitornetworkports#Add_a_network_input_using_Splunk_Web Then add a port mapping in your docker config for the Splunk container. In the edit screen for the container, click "add a port, path, variable, label, or device" and fill it out appropriately, perhaps like the image I've attached. In my example I've mapped the container's port 514 to the local br0 port 10514. In unRAID's syslog settings (settings --> syslog) under "remote syslog server", type in the IP of your unRAID server, and set the port to the mapped port, in our example 10514. Then the data should be available in Splunk under the index you specified when creating the listener. Hope this helps

-
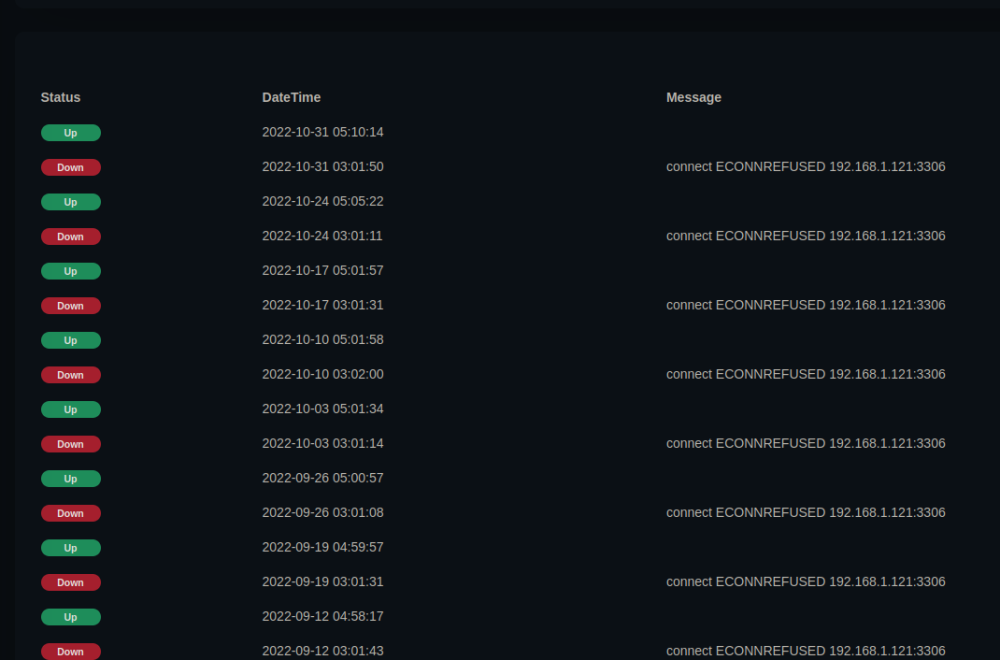
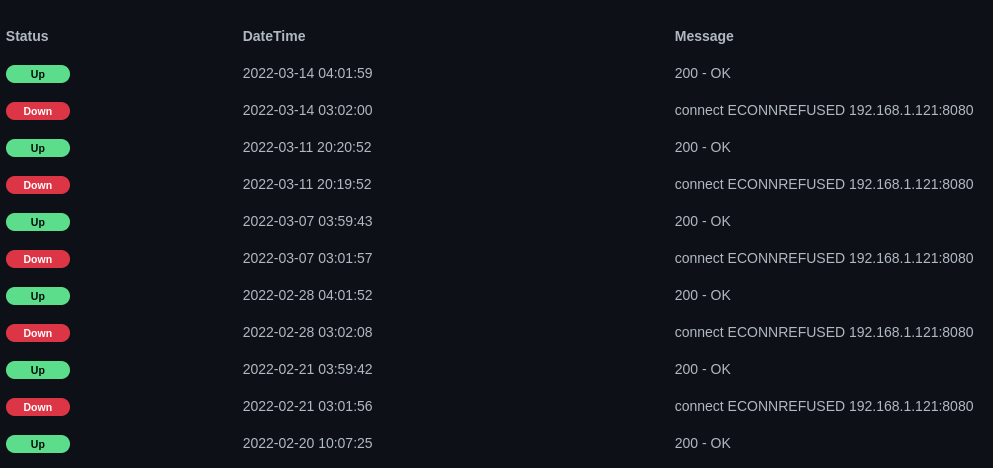
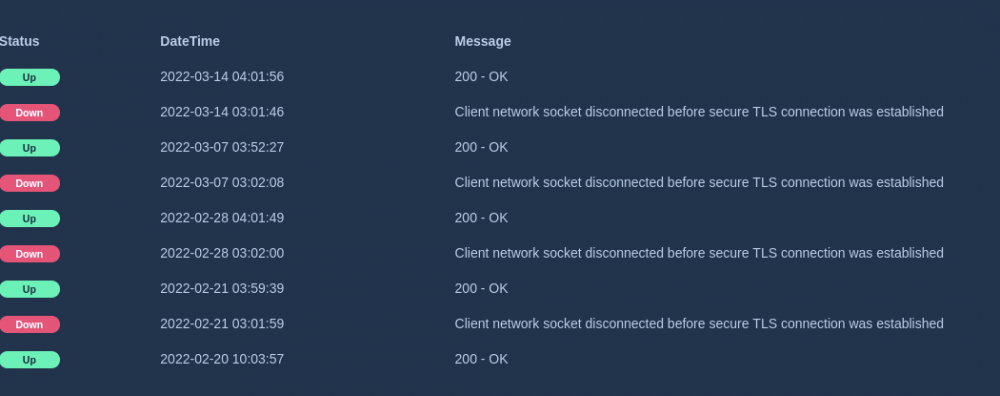
unRAID PRO 6.9.2, Asrock x370, ryzen 5 1600x (CSTATES DISABLED), 16gb ram Suspicions started when Home Assistant was showing sudden drops to zero on all my sensors, including those sourced from scripts and MQTT from local sources. So I got Uptime Kuma to track as many services as I can. Sure just about every day at 3AM and/or midnight the 60-second health checks from Uptime Kuma say everything is down, generally "ECONNREFUSED" for local services (e.g. MariaDB, Mosquitto, Nginx) and "Client network socket disconnected before secure TLS connection was established" for external services (e.g. google.com, 1.1.1.1). Sometimes uptime kuma misses the downtime spikes maybe because it only checks every 60 seconds, but Home Assistant sees them every single time because my sensors all post every 5 seconds. There are no cronjobs at this time, and there is nothing in syslog, srsly the most boring syslog ever. Actually nothing in syslog pertaining to this at all. Always midnight, 3AM, or both. Below are a bunch of screenshots showing stuff, as well as syslog from late last night to now; where things all went offline like normal. Does anyone have any ideas? root@rack:~# tail -n50 /var/log/syslog Mar 16 22:00:12 rack emhttpd: spinning down /dev/sdg Mar 16 22:00:14 rack emhttpd: spinning down /dev/sdj Mar 16 22:00:14 rack emhttpd: spinning down /dev/sdh Mar 16 22:00:14 rack emhttpd: spinning down /dev/sde Mar 16 22:00:14 rack emhttpd: spinning down /dev/sdb Mar 16 22:00:14 rack emhttpd: spinning down /dev/sdc Mar 16 22:00:14 rack emhttpd: spinning down /dev/sdi Mar 17 00:27:48 rack root: /etc/libvirt: 23.9 MiB (25100288 bytes) trimmed on /dev/loop3 Mar 17 00:27:48 rack root: /var/lib/docker: 118.1 GiB (126809567232 bytes) trimmed on /dev/loop2 Mar 17 00:27:48 rack root: /mnt/disks/Kingston240SSD: 113.2 GiB (121536778240 bytes) trimmed on /dev/sdk1 Mar 17 02:00:17 rack emhttpd: read SMART /dev/sdj Mar 17 02:00:19 rack emhttpd: read SMART /dev/sde Mar 17 02:00:53 rack emhttpd: read SMART /dev/sdb Mar 17 02:01:08 rack emhttpd: read SMART /dev/sdi Mar 17 02:01:18 rack emhttpd: read SMART /dev/sdg Mar 17 02:02:01 rack emhttpd: read SMART /dev/sdc Mar 17 02:02:30 rack emhttpd: read SMART /dev/sdh Mar 17 03:14:10 rack emhttpd: spinning down /dev/sdh Mar 17 03:14:12 rack emhttpd: spinning down /dev/sdg Mar 17 03:14:12 rack emhttpd: spinning down /dev/sde Mar 17 03:14:12 rack emhttpd: spinning down /dev/sdc Mar 17 03:14:12 rack emhttpd: spinning down /dev/sdi Mar 17 03:14:33 rack emhttpd: spinning down /dev/sdb Mar 17 03:14:35 rack emhttpd: spinning down /dev/sdj Mar 17 03:40:16 rack crond[1914]: exit status 1 from user root /usr/local/sbin/mover &> /dev/null Mar 17 05:50:20 rack emhttpd: read SMART /dev/sdh Mar 17 06:37:33 rack emhttpd: read SMART /dev/sde Mar 17 06:38:19 rack emhttpd: read SMART /dev/sdj Mar 17 06:38:19 rack emhttpd: read SMART /dev/sdb Mar 17 06:38:19 rack emhttpd: read SMART /dev/sdc Mar 17 06:38:42 rack emhttpd: read SMART /dev/sdg Mar 17 06:38:42 rack emhttpd: read SMART /dev/sdi Mar 17 07:23:04 rack webGUI: Successful login user root from [redacted] Mar 17 07:38:44 rack emhttpd: spinning down /dev/sdj Mar 17 07:38:44 rack emhttpd: spinning down /dev/sdg Mar 17 07:38:44 rack emhttpd: spinning down /dev/sde Mar 17 07:38:44 rack emhttpd: spinning down /dev/sdb Mar 17 07:38:44 rack emhttpd: spinning down /dev/sdc Mar 17 07:38:44 rack emhttpd: spinning down /dev/sdi Mar 17 07:40:26 rack emhttpd: spinning down /dev/sdh
-
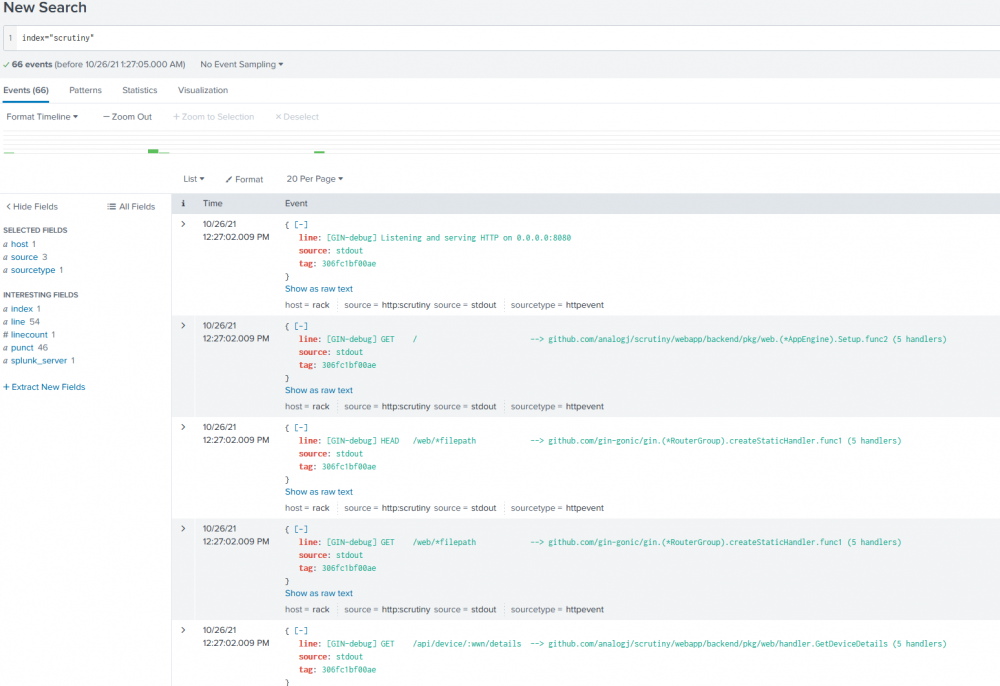
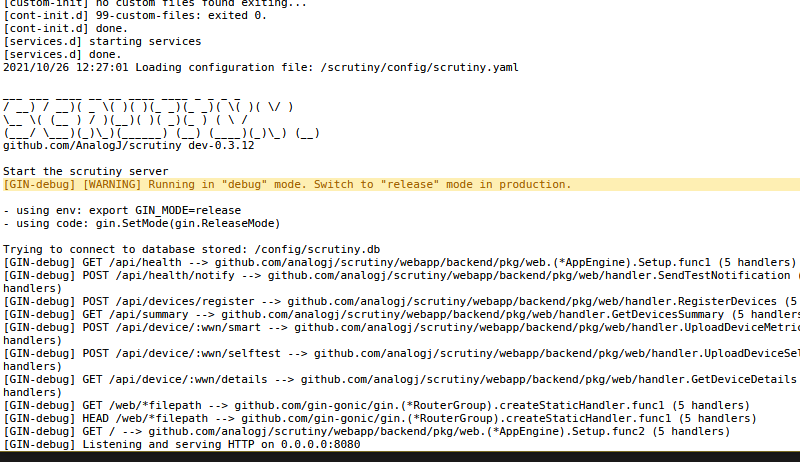
@97WaterPolo this is really cool, i haven't seen it before. back in the old days we had to do some hack with fluentd to get this type of logging working. Anyway it worked immediately for me, attached is a pic of the logs for my scrutiny container in both Splunk and in the logs-view in unRAID. My scrutiny container runs as "bridged" network. I just pasted those settings into the "Extra Parameters" section in the container config and it worked right away. --log-driver=splunk --log-opt splunk-token=9cfe33zz-zzzz-zzzz-zzzz-zzzzzzzzzzzz --log-opt splunk-url=http://<unraidipaddress>:8088 It sounds like you're having an issue with your custom network type. Perhaps you could try and use bridge mode on your container, or you could try routing through a proxy -- i'm not the right person to advise on docker network stuff sorry! but i'm happy to test what I can for you.

-
Hey @97WaterPolo, can you give me some more details pls? 1. Is the HEC set up in the Splunk container? 2. Is the port exposed/mapped appropriately through unraid's config? 3. are you able to successfully send a HEC message to Splunk (e.g. with Postman) and then see that as a search result in Splunk? If you can complete #3 then that feels like the limit of what I can do, I'm not really sure about setting up Splunk as a log output for other containers using the method you described. Generally I just mount the log directory of my other containers as a volume and have Splunk "monitor" those volumes.
-
Using Monica, the web server doesn't seem to bind appropriately: Monica v3.2.0 is set up, enjoy. Database ready.AH00558: apache2: Could not reliably determine the server's fully qualified domain name, using 127.0.0.1. Set the 'ServerName' directive globally to suppress this message (98)Address already in use: AH00072: make_sock: could not bind to address [::]:80 (98)Address already in use: AH00072: make_sock: could not bind to address 0.0.0.0:80 no listening sockets available, shutting down Nothing written to the "logs" folder in the default volume. In unraid UI, port 80 is mapped to an unused high port. I couldn't find any environment variables or volumeised config for changing port 80 to something else. Any ideas? Probably something silly!
-
Unfortunately I tested that and it won't work -- Splunk is very particular about the permissions on a bunch of files and I was unable to get them working in a volume. I documented some of this in the readme on github. You'll get errors like KVStore failing to start, modular inputs failing to execute, some search commands not working -- a whole lot of pain. I think the solution is to prune your volumes after upgrades as I previously ddescribed. Perhaps unRAID could add a feature to do this automatically, or add a GUI button for it. I will note this in the readme on the next release.
-
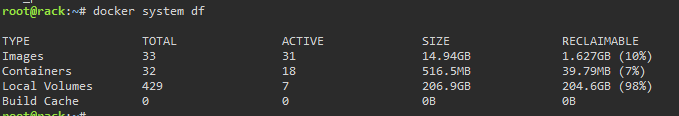
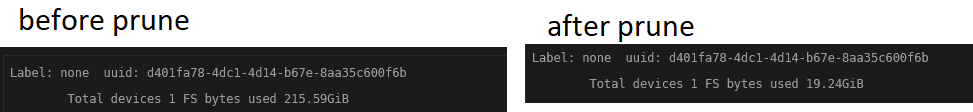
Hi @ShadeZeRO, I was able to replicate and figure out why. This would be due to the way the container installs itself on startup. The container includes the installer grabbed directly from splunk.com during image build, and on first run it untars the installer. This causes your unRAID docker.img to grow every time you rebuild the image (i.e. "force upgrade", or real upgrade). If you have your indexed data stored in the container rather than on an external volume this will accentuate your docker.img disk usage. The same occurs for other containers that have an installer process (or use their internal volumes extensively). For example most of the SteamCMD game server containers that download big files on startup, something that can generate a lot of data like Nessus or Minecraft; or even if you configure a downloader (sab/deluge/etc) to download inside the container rather than to a volume you will also see your docker.img size increasing a lot on upgrade/rebuild. You can view the space used by running 'docker system df'. Here's mine, as you can see I've been working hard to ignore this issue by having 98% reclaimable space in my local volumes. Running the following will reclaim all this space. BE CAREFUL RUNNING IT, THIS COMMAND WILL DELETE ALL STOPPED CONTAINERS AND ALL THEIR DATA. Read docs etc, there are probably safer flags to use. docker system prune --volumes -f Results speak for themselves lol https://docs.docker.com/engine/reference/commandline/system_df/ https://docs.docker.com/engine/reference/commandline/system_prune/
-
Hey @Caduceus Thanks for posting your self-solve there. What you posted makes sense, if you're ingesting data that's older than your frozenTimePeriodInSecs it'll freeze off pretty quickly. And yes I did notice my little quick-fix-attempt didn't work (I noticed this so I didn't push it to master yet fortunately), so I'll follow your lead and just disable the app entirely :). Thanks for that. Happy to help with any other questions, and appreciate you reading through past answers to help work through the issues you were hitting.


