


QPlus7
Members
-
Joined
-
Last visited
Everything posted by QPlus7
-
Done. Let’s see if it happens again. Thanks for the suggestion.
-
It just happened again. I had forgotten about this until I got an alert notifying me that UnRaid was offline.
-
I didn't realize I was so far out of date. I'm currently updating to 6.12.9 and will see if the issue persists.
-
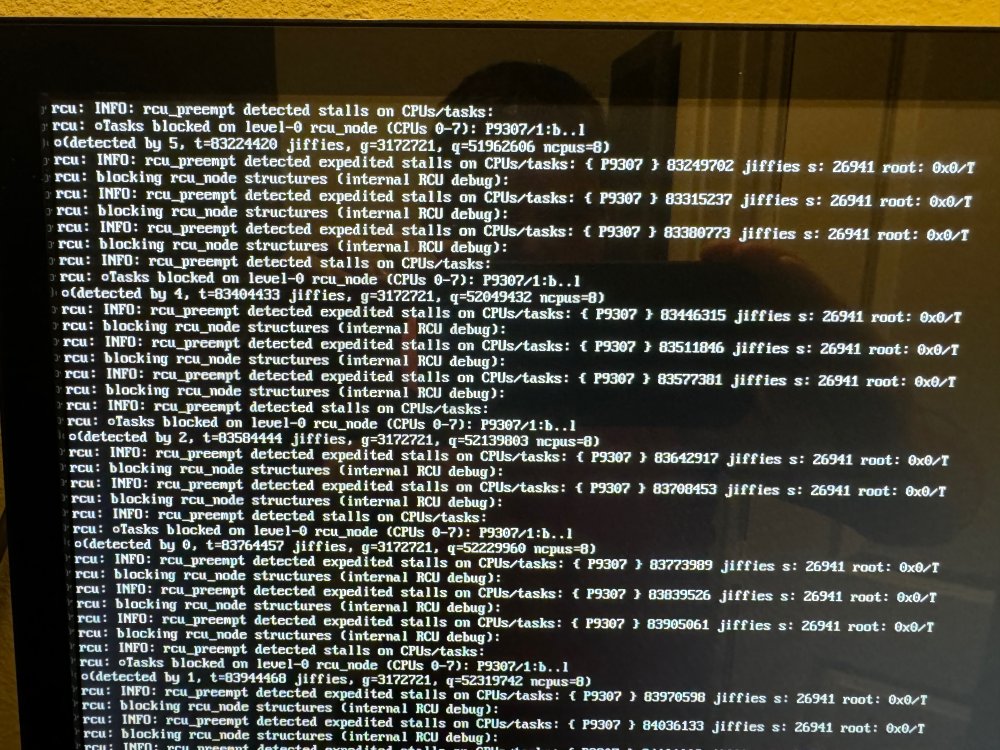
Hi, all. I've been dealing with an issue for about a month or so but it hasn't been at the top of my priority list as a reboot fixes the issue, but it is becoming more and more prevalent now. From time-to-time by server will go offline and when I check the console I see the errors below: grcu: INFO: rcu preempt detected stalls on CUs/tasks: orcu: oTasks blocked on level-0 rcu_node (CPUs 0-7): P9307/1:b..1 oldetected by 5, t=83224420 jiffies, g=3172721, 4=51962606 ncpus=8) rcu: INFO: rcu preempt detected expedited stalls on CPUs/tasks: ( P9307 } 83249702 jiffies s: 26941 roat: 0x0/T orcu: blocking rcu node structures (internal RCU debug ): orcu: INFO: rcu preempt detected expedited stalls on CPUs/tasks: { P9307 } 83315237 jiffies s: 26941 root: 0x0/T orcu: blocking rcu node structures (internal RCU debug): orcu: INFO: rcu_ preempt detected expedited stalls on CPUs/tasks: € P9307 } 83380773 jiffies s: 26941 root: 0x0/T orcu: blocking rcu _node structures (internal RCU debug ): orcu: INFO: rcu_ preempt detected stalls on CPUs/tasks: orcu: oTasks blocked on level-o rcu_node (CUs 0-7): P9307/1:b..1 lodetected by 4, t=83404433 jiffies, g=3172721, 4=52049432 ncpus=8) orcu: INFO: rcu preempt detected expedited stalls on CPUs/tasks: € P9307 } 83446315 jiffies s: 26941 root: 0x0/T orcu: blocking rcu node structures (internal RCU debug ): calls on CPus/tasks: ( P9307 7 83511846 liffies s: 26941 root: Overt orCu: INFO: rcu preempt detected expedited stalls on CPUs/tasks: € P9307 ) 83511846 jiffies s: 26941 root: 0x0/T orcu: blocking rcu node structures (internal RCU debug ): orcu: INFO: rcu preempt detected expedited stalls on CPUs/tasks: { P9307 } 83577381 jiffies s: 26941 root: 0x0/T orcu: blocking rcu_node structures (internal RCU debug ): rcu: INFO: rcu_preempt detected stalls on CPUs/tasks: orcu: oTasks blocked on level-0 rcu_node (CPUs 0-7): P9307/1:b..1 coldetected by 2, t=83584444 jiffies, g=3172721, 9=52139803 ncpus=B) orcu: INFO: rcu _preempt detected expedited stalls on CPUs/tasks: ( P9307 } 83642917 jiffies s: 26941 root: 0x0/T orcu: blocking rcu_node structures (internal RCU debug ): rcu: INFO: rcu preempt detected expedited stalls on CPUs/tasks: { P9307 } 83708453 jiffies s: 26941 root: 0x0/T rcu: blocking rcu _node structures (internal RCU debug) : rcu: INFO: rcu_preempt detected stalls on CPUs/tasks: rcu: Tasks blocked on level-0 rcu_node (CPUs 0-7): P9307/1:b..1 oldetected by 0, t=83764457 jiffies, g=3172721, q-52229960 ncpus=8) rcu: INFO: rcu_preempt detected expedited stalls on CPUs/tasks: € P9307 } 83773989 jiffies s: 26941 root: 0x0/T rcu: blocking rcu_node structures (internal RCU debug ): rcu: INFO: rcu_preempt detected expedited stalls on CPUs/tasks: { P9307 } 83839526 jiffies s: 26941 root: 0x0/T rcu: blocking rcu_node structures (internal RCU debug ): rcu : INFO: rcu preempt detected expedited stalls on CPUs/tasks: { P9307 } 83905061 jiffies s: 26941 root: 0x0/T rcu: blocking rcu_node structures (internal RCU debug ): rcu: INFO: rcu_preempt detected stalls on CPUs/tasks: rcu: Tasks blocked on level-0 rcu_node (CPUs 0-7): P9307/1:b..1 •(detected by 1, t=83944468 jiffies, g=3172721, 4-52319742 ncus=8) rcu: INFO: rcu preempt detected expedited stalls on CPUs/tasks: { P9307 } 83970598 jiffies s: 26941 root: 0x0/T rcu: blocking rcu _node structures (internal RCU debug ): rcu: INFO: rcu_preempt detected expedited stalls on CPUs/tasks: ( P9307 7 84036133 jiffies s: 26941 root: 0x0/T rcu: blocking rcu_node structures (internal RCU debug ): I cannot type anything at the physical console and the server is unresponsive on the network. Rebooting the server resolves the issue, but it comes back later. I'm running UnRaid 6.12.3 and diagnostics file is attached for review. Any help is greatly appreciated - thanks in advance! scw-nas01-diagnostics-20240327-0937.zip
-
Did you ever get this working? I'm trying to accomplish the same thing, although with 3 displays instead of 2. Any help is greatly appreciated - thanks in advance!
-
Good luck. I wish I could help but I didn't do anything special. After installing the software, the drives were available in Windows Explorer.
-
I'm using XFS.
-
I installed Linux File Systems for Windows by Paragon Software.
-
I put the drives in a Windows machine and was able to view the data on each of the drives that UnRaid is saying are unmountable with no filesystem.
-
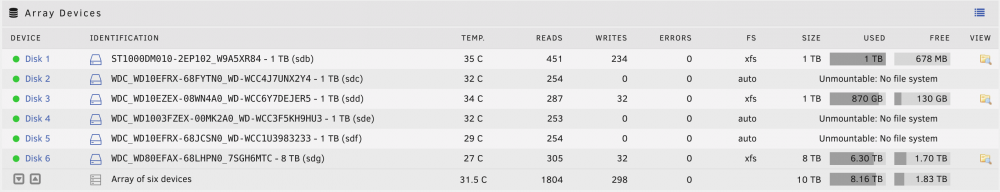
There is definitely data on Disk 2, Disk 4, and Disk 5 as I am able to view everything on the Windows machine. I have a 14TB drive where I could copy the contents of all drives to and then just build a brand new array and then transfer from back from 14TB drive. Is there hope or is that my best strategy? I know it will take time, but I'm fine with that if that is what it takes to get my data consolidated again. Thanks again for all the help!
-
Ok, so I got all the disks (except the bad Disk 2) installed and assigned to a new array. However, the sdX assignments are different but I mapped everything out as it was in relation to Disk 1, Disk 2 (new), Disk 3, Disk 4, Disk 5 and Disk 6. I'm getting an error that says Disk 2, 4, and 5 are unmountable with no file system. Not sure if this is accurate or not but I am going to pull the drives and put them in a Windows machine where I am more comfortable and see if I can read the data (I have LinuxFS installed) there. While I figure that out, attached are the diags as requested, and a screenshot of my array configuration. via-nas01-diagnostics-20210728-2242.zip
-
Thanks for posting that - that is a huge help! I assume you mean Disk 2, though? The ddrescue command I ran was against /dev/sdf which is Disk 2.
-
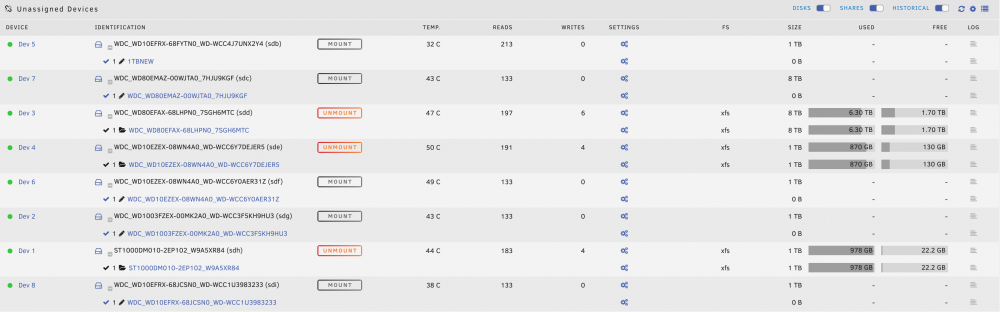
My drives didn't automatically mount after the restart. Attached is what I see now. Any help is greatly appreciated!
-
Ok, ddrescue finally recovered the data to a new drive. I stopped the array and replaced the failed drive in my array. I then went to do a new config but didn't click preserve assignments. Did I just lose my data? Some of my drives don't appear to mount so I can't check using Unassigned Devices right now. I've just restarted the server to see if they mount automatically.
-
One more thing, does the drive need to be formatted before I start ddrescue? Edit: quick Google search indicated that it doesn't need to be formattted as the process will overwrite whatever is on the target drive anyway.
-
Got it - thanks! Since I won't be able to mount the drive, should I stop the pre-clear?
-
First of all, thank you so much for all of your help up onto this point! I now have a new 1 TB drive (sdb) in the computer that is not a part of the array. The array is currently stopped. I am currently pre-clearing the new drive with hopes of mounting it after the pre-clear has completed. Once mounted, I think my next step is to run: ddrescue -d -f /dev/sdf /mnt/disks/ Am I right up to this point? If so, once ddrescue completes, what should by next step? Keep in mind my parity is out-of-sync. Thanks again!
-
Well, I now have an .img file that I'm trying to mount but am getting the following error: root@VIA-NAS01:/mnt/disks/easystore# mount -t xfs -o loop SDEi.img /mnt/baddisk/ mount: /mnt/baddisk: wrong fs type, bad option, bad superblock on /dev/loop4, missing codepage or helper program, or other error. How can I mount the .img file ddrescue created? Thanks in advance!
-
I'm not sure I understand this exactly, but I will follow-up on that later. Currently ddrescue is still running. I have a 1TB ISO file (my drive is 1TB) but ddrescue is still going. This is what I am currently seeing on the console: root@VIA-NAS01:~# ddrescue -d -f -r3 /dev/sdf /mnt/disks/easystore/Disk2.img rescue.log GNU ddrescue 1.23 Press Ctrl-C to interrupt ipos: 3721 MB, non-trimmed: 938803 kB, current rate: 0 B/s opos: 3721 MB, non-scraped: 0 B, average rate: 11015 kB/s non-tried: 12042 MB, bad-sector: 0 B, error rate: 16384 B/s rescued: 987223 MB, bad areas: 0, run time: 1d 53m 43s pct rescued: 98.70%, read errors: 14325, remaining time: 412d 18h time since last successful read: 33s Copying non-tried blocks... Pass 5 (forwards) The remaining time is fluctuating, but nothing manageable. It just went down to 90 days and then back up to 275 days while I was typing this out. Since this is Pass 5, is it safe to cancel the ddrescue operation and see what I can do with my ISO file? Thanks in advance!
-
Would I add it to the array before or after running ddrescue on the new disk?
-
By the way, this is the command I'm running: ddrescue -d -f -r3 /dev/sdb /mnt/disks/easystore/Disk2.img & ...hopefully that does the trick in creating a restorable image.
-
Thanks for the confirmation. Once I replace the drive, what should my plan of action be to restore the .img file since my parity drive is out of sync and I can't rebuild the array?
-
smartctl 7.1 2019-12-30 r5022 [x86_64-linux-5.10.28-Unraid] (local build) Copyright (C) 2002-19, Bruce Allen, Christian Franke, www.smartmontools.org === START OF INFORMATION SECTION === Model Family: Western Digital Blue Device Model: WDC WD10EZEX-08WN4A0 Serial Number: WD-WCC6Y0AER31Z LU WWN Device Id: 5 0014ee 26679ccf1 Firmware Version: 02.01A02 User Capacity: 1,000,204,886,016 bytes [1.00 TB] Sector Sizes: 512 bytes logical, 4096 bytes physical Rotation Rate: 7200 rpm Form Factor: 3.5 inches Device is: In smartctl database [for details use: -P show] ATA Version is: ACS-3 T13/2161-D revision 3b SATA Version is: SATA 3.1, 6.0 Gb/s (current: 6.0 Gb/s) Local Time is: Tue Jul 13 09:21:52 2021 CDT SMART support is: Available - device has SMART capability. SMART support is: Enabled AAM feature is: Unavailable APM level is: 128 (minimum power consumption without standby) Rd look-ahead is: Enabled Write cache is: Enabled DSN feature is: Unavailable ATA Security is: Disabled, frozen [SEC2] Wt Cache Reorder: Enabled === START OF READ SMART DATA SECTION === SMART overall-health self-assessment test result: PASSED See vendor-specific Attribute list for marginal Attributes. General SMART Values: Offline data collection status: (0x82) Offline data collection activity was completed without error. Auto Offline Data Collection: Enabled. Self-test execution status: ( 0) The previous self-test routine completed without error or no self-test has ever been run. Total time to complete Offline data collection: (11040) seconds. Offline data collection capabilities: (0x7b) SMART execute Offline immediate. Auto Offline data collection on/off support. Suspend Offline collection upon new command. Offline surface scan supported. Self-test supported. Conveyance Self-test supported. Selective Self-test supported. SMART capabilities: (0x0003) Saves SMART data before entering power-saving mode. Supports SMART auto save timer. Error logging capability: (0x01) Error logging supported. General Purpose Logging supported. Short self-test routine recommended polling time: ( 2) minutes. Extended self-test routine recommended polling time: ( 114) minutes. Conveyance self-test routine recommended polling time: ( 5) minutes. SCT capabilities: (0x3035) SCT Status supported. SCT Feature Control supported. SCT Data Table supported. SMART Attributes Data Structure revision number: 16 Vendor Specific SMART Attributes with Thresholds: ID# ATTRIBUTE_NAME FLAGS VALUE WORST THRESH FAIL RAW_VALUE 1 Raw_Read_Error_Rate POSR-K 096 001 051 Past 5444 3 Spin_Up_Time POS--K 182 173 021 - 1900 4 Start_Stop_Count -O--CK 100 100 000 - 35 5 Reallocated_Sector_Ct PO--CK 200 200 140 - 0 7 Seek_Error_Rate -OSR-K 200 200 000 - 0 9 Power_On_Hours -O--CK 094 092 000 - 4905 10 Spin_Retry_Count -O--CK 100 253 000 - 0 11 Calibration_Retry_Count -O--CK 100 253 000 - 0 12 Power_Cycle_Count -O--CK 100 100 000 - 34 192 Power-Off_Retract_Count -O--CK 200 200 000 - 20 193 Load_Cycle_Count -O--CK 200 200 000 - 179 194 Temperature_Celsius -O---K 099 084 000 - 44 196 Reallocated_Event_Count -O--CK 200 200 000 - 0 197 Current_Pending_Sector -O--CK 182 182 000 - 3009 198 Offline_Uncorrectable ----CK 182 182 000 - 2999 199 UDMA_CRC_Error_Count -O--CK 200 200 000 - 0 200 Multi_Zone_Error_Rate ---R-- 001 001 000 - 875695 ||||||_ K auto-keep |||||__ C event count ||||___ R error rate |||____ S speed/performance ||_____ O updated online |______ P prefailure warning General Purpose Log Directory Version 1 SMART Log Directory Version 1 [multi-sector log support] Address Access R/W Size Description 0x00 GPL,SL R/O 1 Log Directory 0x01 SL R/O 1 Summary SMART error log 0x02 SL R/O 5 Comprehensive SMART error log 0x03 GPL R/O 6 Ext. Comprehensive SMART error log 0x06 SL R/O 1 SMART self-test log 0x07 GPL R/O 1 Extended self-test log 0x09 SL R/W 1 Selective self-test log 0x10 GPL R/O 1 NCQ Command Error log 0x11 GPL R/O 1 SATA Phy Event Counters log 0x30 GPL,SL R/O 9 IDENTIFY DEVICE data log 0x80-0x9f GPL,SL R/W 16 Host vendor specific log 0xa0-0xa7 GPL,SL VS 16 Device vendor specific log 0xa8-0xb6 GPL,SL VS 1 Device vendor specific log 0xb7 GPL,SL VS 48 Device vendor specific log 0xbd GPL,SL VS 1 Device vendor specific log 0xc0 GPL,SL VS 1 Device vendor specific log 0xc1 GPL VS 93 Device vendor specific log 0xdf GPL,SL VS 1 Device vendor specific log 0xe0 GPL,SL R/W 1 SCT Command/Status 0xe1 GPL,SL R/W 1 SCT Data Transfer SMART Extended Comprehensive Error Log Version: 1 (6 sectors) Device Error Count: 64757 (device log contains only the most recent 24 errors) CR = Command Register FEATR = Features Register COUNT = Count (was: Sector Count) Register LBA_48 = Upper bytes of LBA High/Mid/Low Registers ] ATA-8 LH = LBA High (was: Cylinder High) Register ] LBA LM = LBA Mid (was: Cylinder Low) Register ] Register LL = LBA Low (was: Sector Number) Register ] DV = Device (was: Device/Head) Register DC = Device Control Register ER = Error register ST = Status register Powered_Up_Time is measured from power on, and printed as DDd+hh:mm:SS.sss where DD=days, hh=hours, mm=minutes, SS=sec, and sss=millisec. It "wraps" after 49.710 days. Error 64757 [4] occurred at disk power-on lifetime: 4899 hours (204 days + 3 hours) When the command that caused the error occurred, the device was active or idle. After command completion occurred, registers were: ER -- ST COUNT LBA_48 LH LM LL DV DC -- -- -- == -- == == == -- -- -- -- -- 40 -- 51 00 00 00 00 00 0e 5c f8 40 00 Error: UNC at LBA = 0x000e5cf8 = 941304 Commands leading to the command that caused the error were: CR FEATR COUNT LBA_48 LH LM LL DV DC Powered_Up_Time Command/Feature_Name -- == -- == -- == == == -- -- -- -- -- --------------- -------------------- 60 00 18 00 e0 00 00 00 0e 5c f8 40 08 04:24:20.395 READ FPDMA QUEUED 60 02 d0 00 d8 00 00 00 0e f9 40 40 08 04:24:20.395 READ FPDMA QUEUED 60 01 20 00 d0 00 00 00 0e ac 58 40 08 04:24:20.395 READ FPDMA QUEUED 60 02 78 00 c8 00 00 00 0e e9 d0 40 08 04:24:20.395 READ FPDMA QUEUED 60 00 28 00 c0 00 00 00 0e f9 18 40 08 04:24:20.395 READ FPDMA QUEUED Error 64756 [3] occurred at disk power-on lifetime: 4899 hours (204 days + 3 hours) When the command that caused the error occurred, the device was active or idle. After command completion occurred, registers were: ER -- ST COUNT LBA_48 LH LM LL DV DC -- -- -- == -- == == == -- -- -- -- -- 40 -- 51 00 00 00 00 00 0e e9 08 40 00 Error: UNC at LBA = 0x000ee908 = 977160 Commands leading to the command that caused the error were: CR FEATR COUNT LBA_48 LH LM LL DV DC Powered_Up_Time Command/Feature_Name -- == -- == -- == == == -- -- -- -- -- --------------- -------------------- 60 00 f0 00 40 00 00 00 0e f7 a8 40 08 04:24:14.636 READ FPDMA QUEUED 60 00 80 00 38 00 00 00 0e f8 98 40 08 04:24:14.636 READ FPDMA QUEUED 60 00 28 00 30 00 00 00 0e f9 18 40 08 04:24:14.636 READ FPDMA QUEUED 60 02 78 00 28 00 00 00 0e e9 d0 40 08 04:24:14.636 READ FPDMA QUEUED 60 01 20 00 20 00 00 00 0e ac 58 40 08 04:24:14.636 READ FPDMA QUEUED Error 64755 [2] occurred at disk power-on lifetime: 4899 hours (204 days + 3 hours) When the command that caused the error occurred, the device was active or idle. After command completion occurred, registers were: ER -- ST COUNT LBA_48 LH LM LL DV DC -- -- -- == -- == == == -- -- -- -- -- 40 -- 51 00 00 00 00 00 0e 5b 70 40 00 Error: UNC at LBA = 0x000e5b70 = 940912 Commands leading to the command that caused the error were: CR FEATR COUNT LBA_48 LH LM LL DV DC Powered_Up_Time Command/Feature_Name -- == -- == -- == == == -- -- -- -- -- --------------- -------------------- 60 02 68 00 98 00 00 00 0e e7 68 40 08 04:24:09.176 READ FPDMA QUEUED 60 00 18 00 90 00 00 00 0e 5c f8 40 08 04:24:09.176 READ FPDMA QUEUED 60 01 a0 00 88 00 00 00 0e 5b 58 40 08 04:24:09.176 READ FPDMA QUEUED 60 02 d0 00 80 00 00 00 0e f9 40 40 08 04:24:09.175 READ FPDMA QUEUED 60 03 08 00 78 00 00 00 0e fc 10 40 08 04:24:09.175 READ FPDMA QUEUED Error 64754 [1] occurred at disk power-on lifetime: 4899 hours (204 days + 3 hours) When the command that caused the error occurred, the device was active or idle. After command completion occurred, registers were: ER -- ST COUNT LBA_48 LH LM LL DV DC -- -- -- == -- == == == -- -- -- -- -- 40 -- 51 00 00 00 00 00 0e 5a a8 40 00 Error: UNC at LBA = 0x000e5aa8 = 940712 Commands leading to the command that caused the error were: CR FEATR COUNT LBA_48 LH LM LL DV DC Powered_Up_Time Command/Feature_Name -- == -- == -- == == == -- -- -- -- -- --------------- -------------------- 60 00 48 00 98 00 00 00 0f 02 78 40 08 04:24:05.281 READ FPDMA QUEUED 60 00 f0 00 90 00 00 00 0e f7 a8 40 08 04:24:05.280 READ FPDMA QUEUED 60 00 80 00 88 00 00 00 0e f8 98 40 08 04:24:05.280 READ FPDMA QUEUED 60 00 28 00 80 00 00 00 0e f9 18 40 08 04:24:05.280 READ FPDMA QUEUED 60 04 50 00 78 00 00 00 0f 02 c0 40 08 04:24:05.280 READ FPDMA QUEUED Error 64753 [0] occurred at disk power-on lifetime: 4899 hours (204 days + 3 hours) When the command that caused the error occurred, the device was active or idle. After command completion occurred, registers were: ER -- ST COUNT LBA_48 LH LM LL DV DC -- -- -- == -- == == == -- -- -- -- -- 40 -- 51 00 00 00 00 00 0e 65 f0 40 00 Error: UNC at LBA = 0x000e65f0 = 943600 Commands leading to the command that caused the error were: CR FEATR COUNT LBA_48 LH LM LL DV DC Powered_Up_Time Command/Feature_Name -- == -- == -- == == == -- -- -- -- -- --------------- -------------------- 60 00 28 00 18 00 00 00 0e f9 18 40 08 04:24:01.385 READ FPDMA QUEUED 60 00 80 00 10 00 00 00 0e f8 98 40 08 04:24:01.385 READ FPDMA QUEUED 60 00 f0 00 08 00 00 00 0e f7 a8 40 08 04:24:01.385 READ FPDMA QUEUED 60 00 48 00 00 00 00 00 0f 02 78 40 08 04:24:01.385 READ FPDMA QUEUED 60 02 68 00 f8 00 00 00 0e e7 68 40 08 04:24:01.385 READ FPDMA QUEUED Error 64752 [23] occurred at disk power-on lifetime: 4899 hours (204 days + 3 hours) When the command that caused the error occurred, the device was active or idle. After command completion occurred, registers were: ER -- ST COUNT LBA_48 LH LM LL DV DC -- -- -- == -- == == == -- -- -- -- -- 40 -- 51 00 00 00 00 00 0e 65 60 40 00 Error: UNC at LBA = 0x000e6560 = 943456 Commands leading to the command that caused the error were: CR FEATR COUNT LBA_48 LH LM LL DV DC Powered_Up_Time Command/Feature_Name -- == -- == -- == == == -- -- -- -- -- --------------- -------------------- 60 00 88 00 a8 00 00 00 0f 01 f0 40 08 04:23:55.728 READ FPDMA QUEUED 60 02 78 00 a0 00 00 00 0e e9 d0 40 08 04:23:55.728 READ FPDMA QUEUED 60 01 20 00 98 00 00 00 0e ac 58 40 08 04:23:55.728 READ FPDMA QUEUED 60 03 08 00 90 00 00 00 0e fc 10 40 08 04:23:55.728 READ FPDMA QUEUED 60 00 b0 00 88 00 00 00 0e 5a a8 40 08 04:23:55.728 READ FPDMA QUEUED Error 64751 [22] occurred at disk power-on lifetime: 4899 hours (204 days + 3 hours) When the command that caused the error occurred, the device was active or idle. After command completion occurred, registers were: ER -- ST COUNT LBA_48 LH LM LL DV DC -- -- -- == -- == == == -- -- -- -- -- 40 -- 51 00 00 00 00 00 0e f3 78 40 00 Error: UNC at LBA = 0x000ef378 = 979832 Commands leading to the command that caused the error were: CR FEATR COUNT LBA_48 LH LM LL DV DC Powered_Up_Time Command/Feature_Name -- == -- == -- == == == -- -- -- -- -- --------------- -------------------- 60 04 50 00 d8 00 00 00 0f 02 c0 40 08 04:23:44.965 READ FPDMA QUEUED 60 00 28 00 c0 00 00 00 0e f9 18 40 08 04:23:44.965 READ FPDMA QUEUED 60 00 80 00 b8 00 00 00 0e f8 98 40 08 04:23:44.965 READ FPDMA QUEUED 60 00 f0 00 b0 00 00 00 0e f7 a8 40 08 04:23:44.965 READ FPDMA QUEUED 60 00 48 00 a8 00 00 00 0f 02 78 40 08 04:23:44.965 READ FPDMA QUEUED Error 64750 [21] occurred at disk power-on lifetime: 4899 hours (204 days + 3 hours) When the command that caused the error occurred, the device was active or idle. After command completion occurred, registers were: ER -- ST COUNT LBA_48 LH LM LL DV DC -- -- -- == -- == == == -- -- -- -- -- 40 -- 51 00 00 00 00 00 0f 01 80 40 00 Error: UNC at LBA = 0x000f0180 = 983424 Commands leading to the command that caused the error were: CR FEATR COUNT LBA_48 LH LM LL DV DC Powered_Up_Time Command/Feature_Name -- == -- == -- == == == -- -- -- -- -- --------------- -------------------- 60 00 08 00 d0 00 00 00 0f 07 10 40 08 04:23:40.549 READ FPDMA QUEUED 60 00 88 00 c8 00 00 00 0f 01 f0 40 08 04:23:40.549 READ FPDMA QUEUED 60 02 78 00 b8 00 00 00 0e e9 d0 40 08 04:23:40.548 READ FPDMA QUEUED 60 01 20 00 b0 00 00 00 0e ac 58 40 08 04:23:40.548 READ FPDMA QUEUED 60 03 08 00 a8 00 00 00 0e fc 10 40 08 04:23:40.548 READ FPDMA QUEUED SMART Extended Self-test Log Version: 1 (1 sectors) No self-tests have been logged. [To run self-tests, use: smartctl -t] SMART Selective self-test log data structure revision number 1 SPAN MIN_LBA MAX_LBA CURRENT_TEST_STATUS 1 0 0 Not_testing 2 0 0 Not_testing 3 0 0 Not_testing 4 0 0 Not_testing 5 0 0 Not_testing Selective self-test flags (0x0): After scanning selected spans, do NOT read-scan remainder of disk. If Selective self-test is pending on power-up, resume after 0 minute delay. SCT Status Version: 3 SCT Version (vendor specific): 258 (0x0102) Device State: Active (0) Current Temperature: 44 Celsius Power Cycle Min/Max Temperature: 44/49 Celsius Lifetime Min/Max Temperature: 26/59 Celsius Under/Over Temperature Limit Count: 0/0 Vendor specific: 01 00 00 00 00 00 00 00 00 00 00 00 00 00 00 00 00 00 00 00 00 00 00 00 00 00 00 00 00 00 00 00 SCT Temperature History Version: 2 Temperature Sampling Period: 1 minute Temperature Logging Interval: 1 minute Min/Max recommended Temperature: 0/60 Celsius Min/Max Temperature Limit: -41/85 Celsius Temperature History Size (Index): 478 (270) Index Estimated Time Temperature Celsius 271 2021-07-13 01:24 44 ************************* ... ..( 85 skipped). .. ************************* 357 2021-07-13 02:50 44 ************************* 358 2021-07-13 02:51 ? - 359 2021-07-13 02:52 44 ************************* ... ..( 7 skipped). .. ************************* 367 2021-07-13 03:00 44 ************************* 368 2021-07-13 03:01 45 ************************** ... ..( 4 skipped). .. ************************** 373 2021-07-13 03:06 45 ************************** 374 2021-07-13 03:07 46 *************************** 375 2021-07-13 03:08 47 **************************** ... ..( 4 skipped). .. **************************** 380 2021-07-13 03:13 47 **************************** 381 2021-07-13 03:14 48 ***************************** ... ..( 3 skipped). .. ***************************** 385 2021-07-13 03:18 48 ***************************** 386 2021-07-13 03:19 49 ****************************** ... ..( 13 skipped). .. ****************************** 400 2021-07-13 03:33 49 ****************************** 401 2021-07-13 03:34 48 ***************************** ... ..( 3 skipped). .. ***************************** 405 2021-07-13 03:38 48 ***************************** 406 2021-07-13 03:39 49 ****************************** 407 2021-07-13 03:40 49 ****************************** 408 2021-07-13 03:41 49 ****************************** 409 2021-07-13 03:42 48 ***************************** ... ..( 8 skipped). .. ***************************** 418 2021-07-13 03:51 48 ***************************** 419 2021-07-13 03:52 47 **************************** ... ..( 5 skipped). .. **************************** 425 2021-07-13 03:58 47 **************************** 426 2021-07-13 03:59 48 ***************************** ... ..( 8 skipped). .. ***************************** 435 2021-07-13 04:08 48 ***************************** 436 2021-07-13 04:09 47 **************************** ... ..( 12 skipped). .. **************************** 449 2021-07-13 04:22 47 **************************** 450 2021-07-13 04:23 46 *************************** ... ..( 9 skipped). .. *************************** 460 2021-07-13 04:33 46 *************************** 461 2021-07-13 04:34 45 ************************** 462 2021-07-13 04:35 46 *************************** 463 2021-07-13 04:36 45 ************************** ... ..( 35 skipped). .. ************************** 21 2021-07-13 05:12 45 ************************** 22 2021-07-13 05:13 44 ************************* ... ..(247 skipped). .. ************************* 270 2021-07-13 09:21 44 ************************* SCT Error Recovery Control command not supported Device Statistics (GP/SMART Log 0x04) not supported Pending Defects log (GP Log 0x0c) not supported SATA Phy Event Counters (GP Log 0x11) ID Size Value Description 0x0001 2 0 Command failed due to ICRC error 0x0002 2 0 R_ERR response for data FIS 0x0003 2 0 R_ERR response for device-to-host data FIS 0x0004 2 0 R_ERR response for host-to-device data FIS 0x0005 2 0 R_ERR response for non-data FIS 0x0006 2 0 R_ERR response for device-to-host non-data FIS 0x0007 2 0 R_ERR response for host-to-device non-data FIS 0x0008 2 0 Device-to-host non-data FIS retries 0x0009 2 2 Transition from drive PhyRdy to drive PhyNRdy 0x000a 2 3 Device-to-host register FISes sent due to a COMRESET 0x000b 2 0 CRC errors within host-to-device FIS 0x000d 2 0 Non-CRC errors within host-to-device FIS 0x000f 2 0 R_ERR response for host-to-device data FIS, CRC 0x0012 2 0 R_ERR response for host-to-device non-data FIS, CRC 0x8000 4 39599 Vendor specific I'm creating an image using ddrescue to save any data I can off of Disk 2 right now and it seems to be going well. I've got about 208GB out of 850GB so far.
-
Hi, all. I've been having problems with my system for a while. I haven't powered the server on in about 6 months but it was having problems back then. Today, I powered it on and was able to fix one of my issues where Docker wasn't starting. My array started fine but I lost my parity disk. It showed up in the Unassigned Devices section, though. I stopped the array and added the drive as a parity disk and the sync started. I'm getting tons of errors on Disk 2 and it is going extremely slow. To the point where the estimated completion time is fluctuating into the 1000s of days (it's gone up to over 3,500). Is there anything I can do or am I screwed since I lost my parity drive? I've attached my diagnostics for reference. Any help is greatly appreciated - thanks in advance! via-nas01-diagnostics-20210713-0032.zip
-
I just updated OpenVPN and unRAID and guess what happened? Yup! My configuration is completely gone again. Three strikes and you're out?


