


Majawat
Members
-
Joined
-
Last visited
-
Yes, sorry I didn't see the notification of your reply. Flashing only the 2108it.bin file and not the others resolved the issue. From my research, it seems that those extra files have the card doing extra things at boot which make it so that the drives aren't ready by the time Unraid has loaded.
-
This seems to have been resolved by re-flashing the HBA card without the supplementary BIOS files. In my case, using these as instructions: https://forums.serverbuilds.net/t/guide-updating-your-lsi-sas-controller-with-a-uefi-motherboard/131 and running only these commands: sas2flash.efi -o -e 7 sas2flash.efi -o -f 2108it.bin sas2flash.efi -o -sasaddhi XXXXXXX[replacing the XXXs with the address on the sticker on the card]. Since flashing it without the -b x64sas2.rom -b mptsas2.rom switches, I've had no issues with this part.
-
After turning off EXPO and changing the Power Supply Idle Control setting, Server crashed again this morning. Here's the syslog files anew, pulled this morning after I hard powered it off and back on. I do note that I had gotten an Out Of Memory errors detected on your server alert from Fix Common Problems basically right before it crashed. Though, that seems that it may have been when Fix Common Problems ran, not that was when the OOM error occured. This server hasn't gone 24 hours without crashing since I put in the new CPU, Motherboard, and RAM: MB: MSI PRO X870E-P WIFI | CPU: AMD Ryzen 9 9900X | Cooler: Noctua NH-D15 | RAM: 32GB DDR5-6000. Any help would be appreciated, thank you. hathor-diagnostics-20260315-0802.zip syslogsyslog-previous
-
Diagnostics (after reboot), and syslog attached. Randomly, it seems, my unRAID server will just lock up, completely unresponsive. No display, no pings, can't wake via mouse/keyboard, etc. Looks like the last time started about 00:23:54 (just after midnight). I did just find the FAQ for Ryzen servers https://forums.unraid.net/topic/46802-faq-for-unraid-v6/page/2/#findComment-819173 and will be looking into changing those options, though unsure what I'm doing there, or if they're still relevant to my 9900x CPU. hathor-diagnostics-20260314-0622.zip syslogsyslog-previous
-
This weekend, I replaced my motherboard, CPU, and RAM. I also took the opportunity of the server being down to update the HBA card's firmware version to v20, and ensure that it was in IT mode (from what I could tell, it was in IR mode prior, but still working fine; probably shouldn't have messed with it, but hindsight and all...). However, when the computer restarts, randomly, some drives will not show up, making the array invalid. The missing drives seem to be random, its like they're not awake enough to be seen by Unraid. But I am obviously concerned that I messed something up. If I run for h in /sys/class/scsi_host/host*/; do echo "- - -" > "${h}scan"; done then the drives show up. And I can start the array and everything. I haven't tried starting Docker/VMs while I mess with all of this. (I'm also adding an NVMe drive for my docker containers, and replacing the cache drive with a Samsung SATA SSD). There's also a bunch of "Historical Unassigned Devices" listed at the bottom and I'm not sure what to do with them, forget them, etc? If it helps, I did have trouble booting with the new motherboard. It would only boot to a black screen. Fully up to date BIOS. Ended up finding someone else who had this problem on a forum that changed their bootloader to something else, and that allowed me to finally boot into Unraid. Specs: AMD Ryzen 9 9900X Crucial Pro DDR5-6000 CL36 (2x16GB) MSI X870E-P Pro WiFi Noctua NH-D15 Black LSI SAS 9210-8i HP SAS Expander PCI-E 468405-001 487738-001 Please let me know if there's any other information I should add, and I'll be happy to. Thank you for reading. hathor-diagnostics-20260310-0743.zip
-
I'm doing that now, I actually paused the rebuild and the Mover started moving, so I'm going to let that finish before continuing. I'll check it out, thanks!
-
Much appreciated, itimpi! Is there any way to figure out what's doing the reads/writes?
-
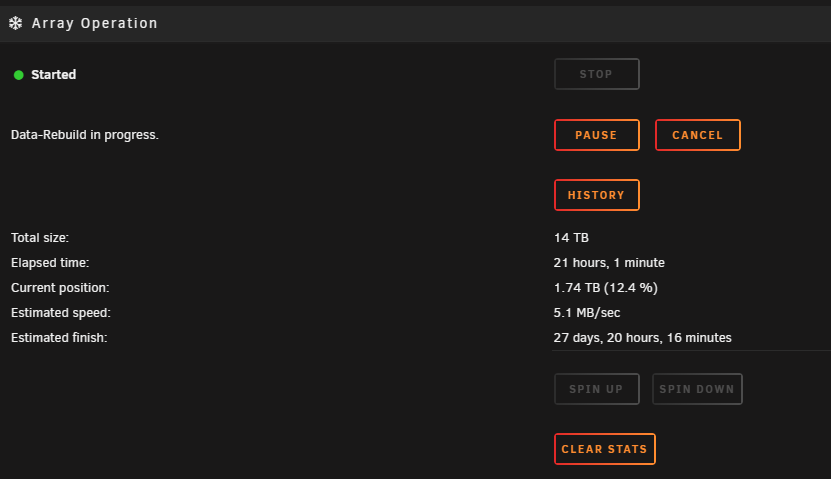
My hard drives filled up (<1TB free), so I replaced an 8TB drive (a shucked WD80EFZX) with a 14TB drive (ST14000NT001 from serverpartdeals.com). I stopped the array, unassigned the device, shut down, replaced drive using the same power and SATA cable, started server, assigned drive, and started the array. But the parity rebuild is taking forever. Much longer than it has in the past, which would be a few days. But now it's between 30 and 80 days at times; around 3-5Mb/s. I have no idea how to troubleshoot this and I'm concerned I got a bad drive or something. Is there an issue I'm overlooking? What can I do to speed this rebuild up? Any help would be greatly appreciated. Thank you. Dignostics attached. hathor-diagnostics-20240229-1633.zip
-
That is all a ton of useful information, I greatly appreciate it! Thanks for the sanity check. I'm pretty sure the internal paths are all ok, so I think You're right on them just being hefty.
-
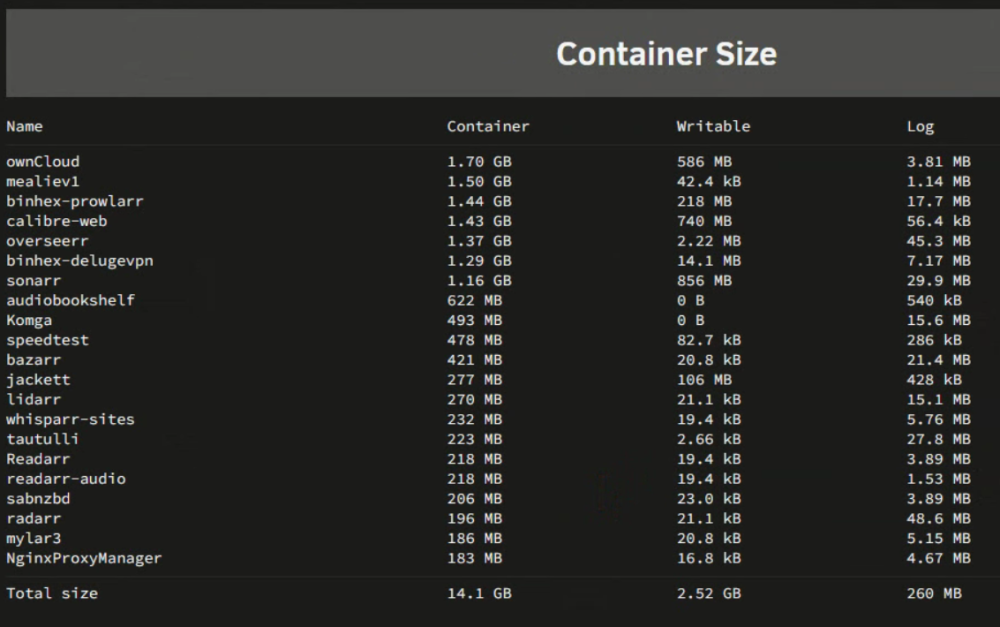
Here's an image of my Docker Container Size. With how many dockers I have, is this a reasonable size? I keep bumping up against the "warning" amount of 95% at 20GB total then "normal" levels. I just want to ensure nothing is getting out of hand before I increase the capacity. Thanks!
-
I had not, but just did and it came up. Weird, but I'll take it. Not that I know of.
-
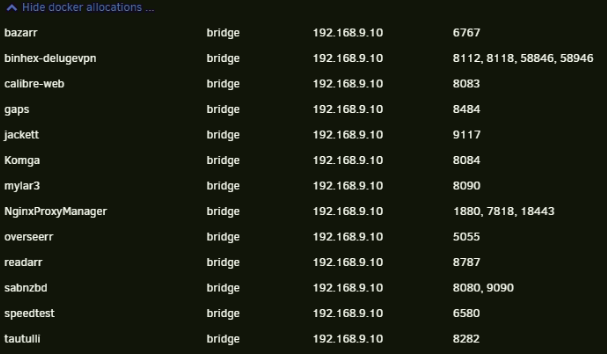
I'm not seeing any duplicated ports. And it was fine before my UPS died and shutdown the unRAID hardware. Hasn't come up since power loss. Attached are my diags as well. hathor-diagnostics-20211128-1451.zip
-
My unRAID docker all of a sudden won't start. Just gives `Execution Error: Server Error` message. No logs in log window, and deleting the logs shown here never recreates those logs for some reason. I've tried changing the PIA OPVN file to Switzerland (from Spain), and also changing the DNS I saw in this thread. I changed it to "1.1.1.1,1.0.0.1,8.8.8.8,192.168.9.1" (cloudflare, cloudfare backup, google (just to test), and home router IPs). Not sure how to continue troubleshooting, especially if the logs aren't being generated. I wish that error was more specific though.


