DaPedda
Members
-
Joined
-
Last visited
Everything posted by DaPedda
-
Conclusion: this was now my second HBA card which failed. With the Dell H200 and the old cable set I have no problems so far.
-
Last Friday I replaced the cable set and both HDD's were running all weekend, until 10:00 AM this morning. Tonight I have now installed another COntroller, a Dell H200. Now I wait again and report back 😉
-
Thank you for your help. I will move all Toshibas to a new case with new HBA cards and new cables this weekend. Then we will see. I'll report back and then close the post if all is well.
-
Here we go..... and thanks for Help Edit: Diag removed
-
Leider hat sich das Problem nicht gelöst, daher habe ich ein ein neues Topic in General Support. Viele Grüße, Peter
-
Hello Community, I have since some days this problem: two harddisks bring me after 2h - 8h Disk I/O Error (after Server reboot) These two harddisks are connected to a HBA 9211-8i with unRaid 6.9.2 Interestingly, my array (connected to the internal SATA port) has exactly the same read performance as the two failed disks. I created a new disk configuration yesterday, but the error is back since this morning. Please, who can give me a tip on how to narrow down the error further? Thank you very much Peter
-
Ich habe das Problem wie folgt lösen können: - Stop Array - neue Config eingeleitet, bis auf die Pools die ich hatte - Array Start im Wartungsmodus - Reboot unRaid - Start Array im normalen Modus Im Moment stelle ich noch keinen Fehler fest
-
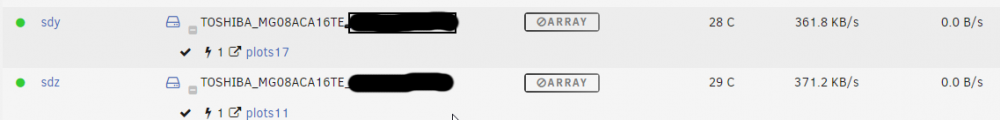
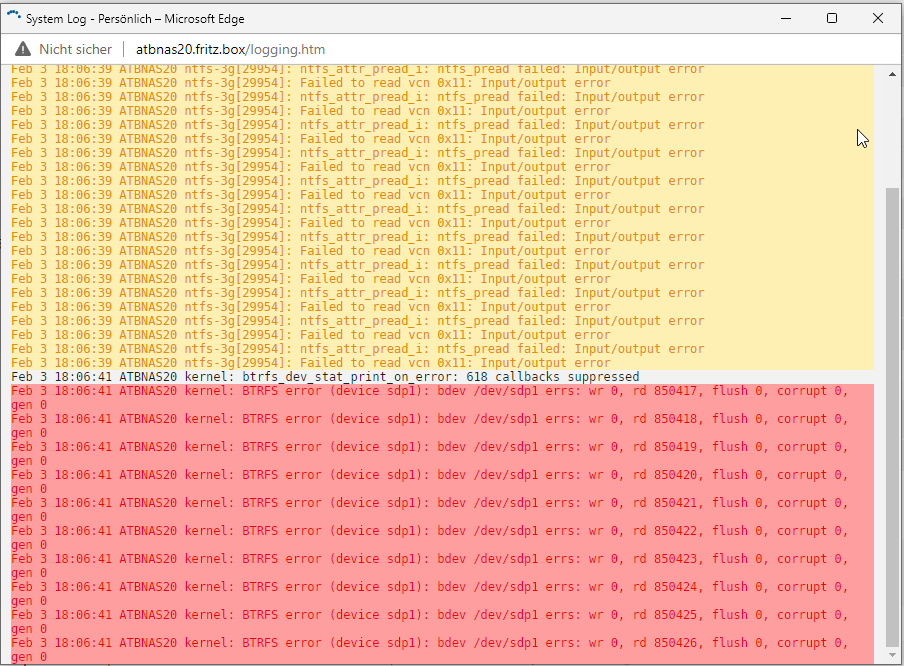
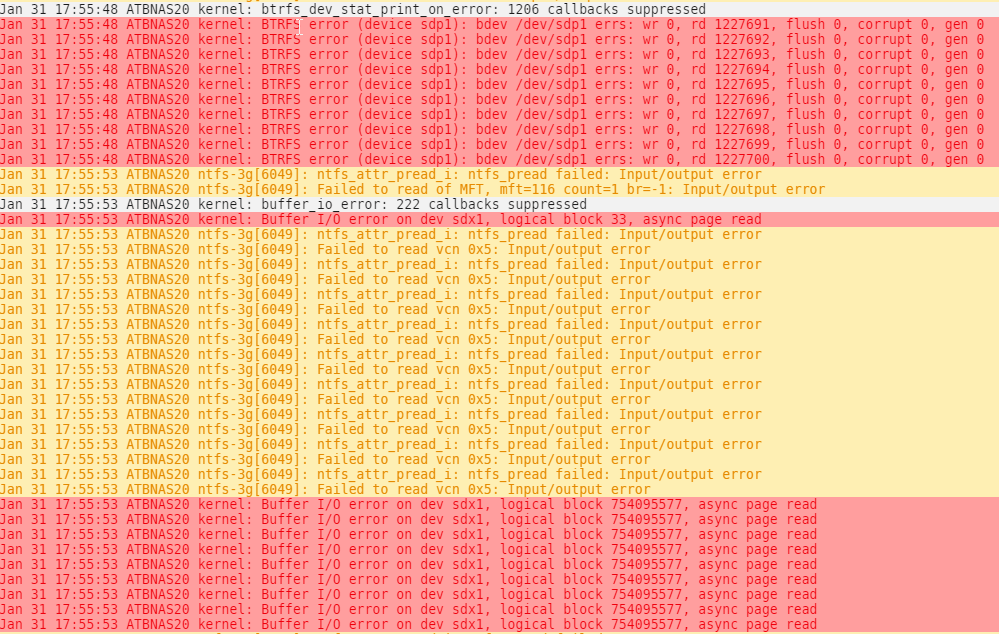
Hallo zusammen, seit wenigen Tagen werden mir bei zwei Platten folgende Symbole angezeigt: Die Platten sind als Unassigend Devices an zwei Dockercontainer mit dem Schalter - Slave durchgereicht. Diesen Schalter habe ich gesetzt, nachdem mir erstmalig beide Platten rausgeflogen sind. Im Disklog steht: Im Systemlog steht: Es handelt sich dabei einmal um ein NTFS Device und um ein BTRFS Device. Das wäre jetzt echt doof, wenn mir die zweite HBA Karte aussteigt. Komischerweise ist aber Aktivität auf den beiden HDD's. Ich würde mich um Hilfe freuen. Viele Grüße, Peter

-
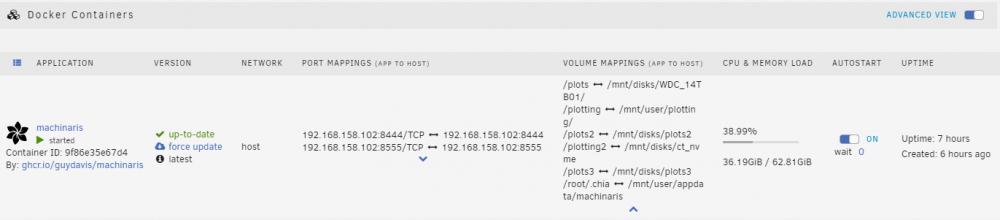
Hi folks, I still have two problems: 1. I see my worker (harvester), but he doesn't give me any stats 2. Under "Connections" I cannot remove a host that is no longer reporting My worker is on another unRaid server. I created the template via the full node and created it on the target server via docker-compose. I see him in the full node. Under Alerts it says: "Your harvester appears to be offline! No events for the past 81187 seconds." I think it's because of the port mappings. Before the update, the port mapping on the target server said e.g .: Network = default and mapping 8926: 8926 Today it says machinaris_default and mapping = 172.18.0.2:8926/TCP <> 192.168.158.103:8926 Same for the Port 8927. At https://pool.space/ I see both harvesters, so the farming seems to be working for now. Greetings, Peter
-
It was a failure in the WebUI. I was able to fix ist with these Instructions:
-
Great,.... after Update my Farming is offline 😞
-
I just saw that all settings in plotman.yaml are gone. A backup from this morning is ignored. I am not amused 😞 Next surprise: no matter what I enter under Settings> Plotting: it doesn't work. It is reset to "factory settings" after i revisite die Settings Tabs P.S.: manuell Copy from plotman.yaml works, plotter do his Job. But when i revisited the Settings Page for Plotting, all Settings are gone. Wrong Path?
-
Hello, I'm missing something in the machinaris wiki. At https://github.com/Chia-Network/chia-blockchain/wiki/Farming-on-many-machines it says: Sektioon Harvester + Plotter: "Don't forget to copy your fullnode's ca certificates over as outlined above in the harvester section. " Unfortunately, there is no description of where I should copy the CA from the full node and then integrate it in the new worker. Can you please help me here?
-
My mistake ... has been dealt with 🙂
-
Hello Community, where please can I deactivate these blue boxes? For me they are very annoying. Many Thanks
-
Open a Docker Machinaris Shell and type in: chia plotnft get_login_link -l 'Your Launcher ID'
-
hello community, is there a chance to see the "pool login link" under machinaris? In my case, Spacepool's. Thank you very much.
-
Hey, do you have enabled the pool_contract_address: under plotting in the plotman.yaml? looks like "pool_contract_address: xch1dkcnya3m22la6q5625xu0ra0r7wwnj9aeqffay24xa26yktg89xqkgsgrc"
-
Hello community, how does machinaris decide where to write the next plot to? I have entered two directories, let's call them plot6 and plot7. Machinaris mostly only wants to write to plot7. plot7 has more data than plot6. Greetings Peter
-
Thanks, I have received more mojos and can now join a pool
-
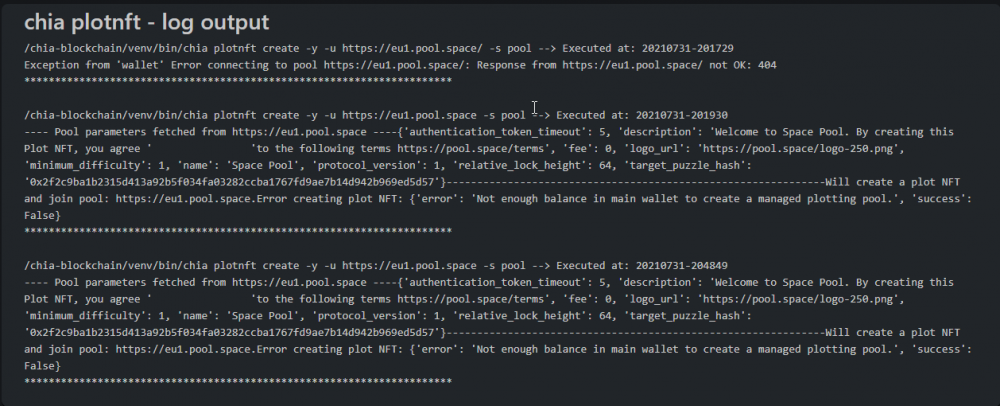
Hey Guys, i would like to Forward a Message sent in Discord at SpacePool: "Hey guys, I tried to join your SpacePool today. I use a Docker container machinaris for this. If I click on the suggested link on the right to copy, then I get the following result: https://eu1.pool.space/ I entered this link in machinaris and Log tells me: "Exception from 'wallet' Error connecting to pool https://eu1.pool.space/: Response from https://eu1.pool.space/ not OK: 404" It killed my 100 mojos When I tried to use https://eu1.pool.space/, machinaris correctly said: "Will create a plot NFT and join pool: https: //eu1.pool.space.Error creating plot NFT: {'error': 'Not enough balance in main wallet to create a managed plotting pool. ',' success': False} " How can you please help me? Kind regards, Peter" Some Guys said, to join tho Pool takes only 1 Mojo, but all my 100 mojos are gone. Where ist the Mistake?
-
Same to me. And from the last update, Alerts shows me only flax summary. Sounds to me like you should deactivate flax first
-
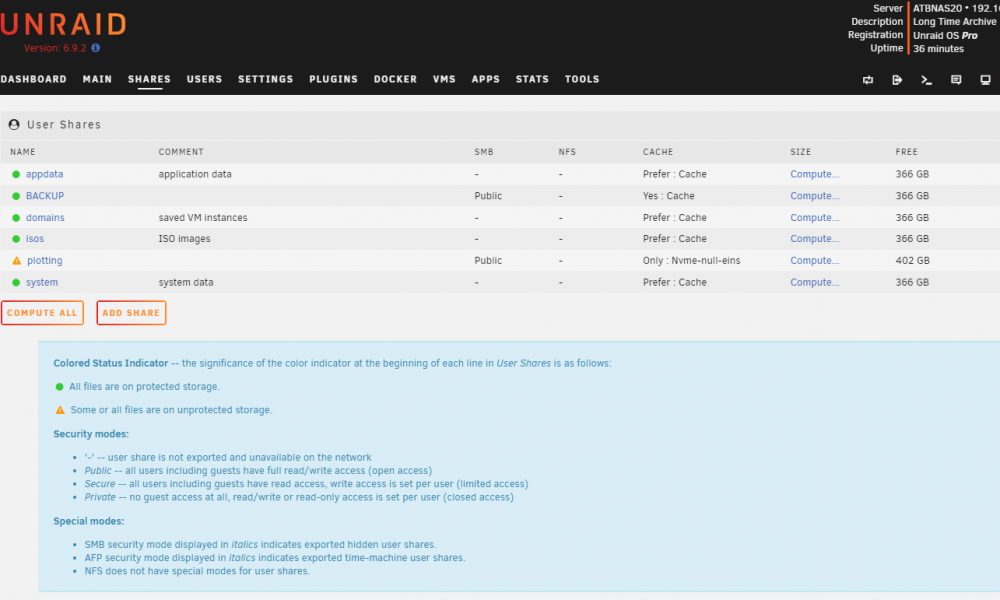
Thank you for your answer. Below my settings. I checked the Size of /mnt/user/appdata/machinaris/plotman/logs root@ATBNAS20:/mnt/disks# du -shc /mnt/user/appdata/machinaris/plotman/logs 42M /mnt/user/appdata/machinaris/plotman/logs Also i check the Size of /mnt/user/appdata/machinaris/mainnet/db root@ATBNAS20:/mnt/user/appdata/machinaris/mainnet/db# du -shc /mnt/user/appdata/machinaris/mainnet/db 6.2G /mnt/user/appdata/machinaris/mainnet/db 6.2G total Today I restarted the container several times. In your opinion, are the sizes okay?
-
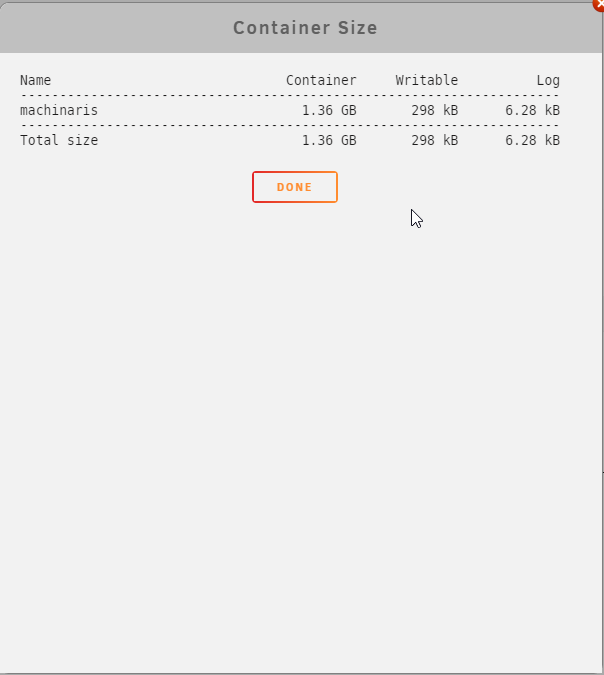
Hello community, Sunday evening I had a bug that caused machinaris to crash: Event: Docker critical image disk utilization. It struck me that the SQL Lite databases are a considerable size. Docker Log maximum filesize is 50 MB, the Docker image is 50GB. How can I enlarge the machinaris app? Greetings, Peter