


JoshTheBlack
Members
-
Joined
-
Last visited
-
After trying to create an account for the past two weeks and just getting that error, I tried logging in with the account I created and it logged in and seems to work fine. Used tootctl to set it as the owner, and everything *seems* to be working. Including emails. Just that signup process is leading to an error.
-
You are making the opposite point to your conclusion. By hosting your OWN instance, you own the server. You own the data. You own the computational power to run it. When you run your own instance, nobody can shutdown your server or delete your account except for you. I can't imagine the maintenance would be terribly high for a single user instance. There is nobody to moderate except for yourself. Does anybody have any suggestions on what I should try for my problem here? I'm at a complete loss. Can't figure out what the problem is.
-
No luck. Got redis and postgresql working fine. Mastodon loads. No errors in the log as far as I can see. When I try to Sign Up the first account, the page just spins for 60 seconds then goes to "We're sorry but something went wrong on our end" page. I can't figure it out.
-
Any suggestions?
-
I apologize for not being prepared for this thread. I'm unsure what info would be relevant to provide. What happens: About once a week or so, one of my containers that I have set a static IP for loses its static IP and gets set to 192.168.0.2, which happens to be the address assigned to a piece of network equipment in my network. I have to manually remove the container and re-add it, or manually set the network type away from "custom: eth0" then back again and retype the IP address. This has been plaguing me for months, and google has failed me. My router is ALSO set to assign the correct IP address via DHCP to the MAC this container has. It seems to pretty consistently get changed to 192.168.0.2 sometime late Wednesday night or early Thursday morning in my time zone (US Eastern). I suspect that this might be related to the CA AutoUpdate plugin, but have no basis as to why it would be. The template and the diagnostic files are attached. Any idea where to look for what could be causing this issue? I'm happy to provide any other information or logs needed to help diagnose the issue. Thanks! rocinante-diagnostics-20220518-1734.zip my-syncthing.xml
-
Reformatted to xfs and transferred data back to the cache drive. All is well now.
-
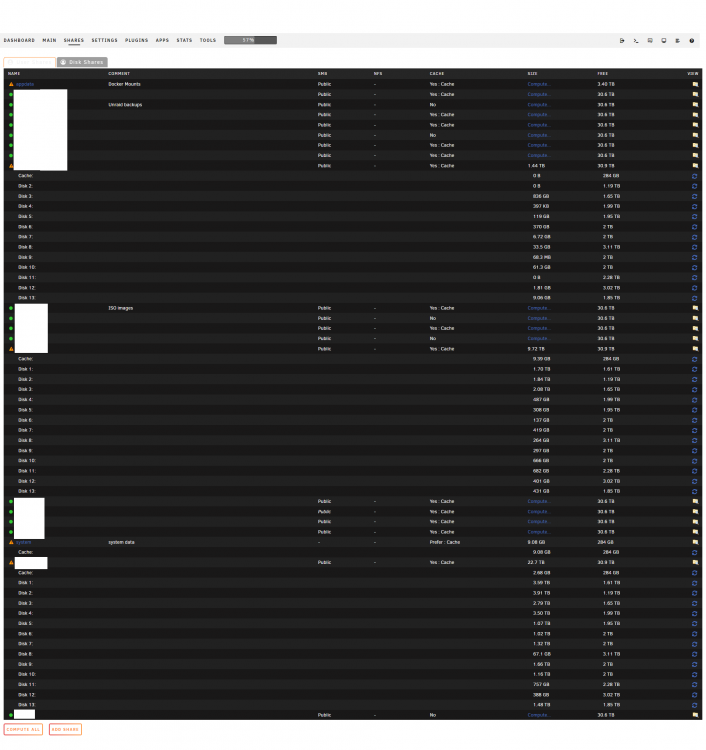
Was planning on doing that today, but before I could it's back to 70% usage again! New screenshots of my cache and pool. There is NOTHING on the cache drive that is not in the pool. I don't know if it's relevant, but there are some BTRFS errors in the disk log I attached. Errors are from Aug 9. Lines 24-26 and 38-40. That was probably from when I removed a cache drive and setup as single, then reformatted. I'm currently moving all data off the cache drive with the intention of reformatting again, probably with xfs. disklog.txt
.thumb.png.e9096c45e24452107b17828b2e6cfde2.png)
-
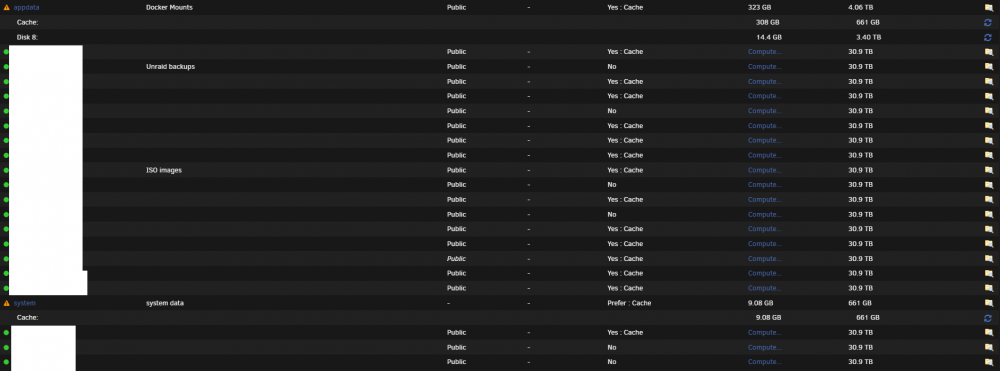
This is weird. I changed appdata from cache: prefer to cache: yes, then invoked the mover. It's been running close to an hour so far. As you can see in the pictures, my usage has returned to normal in the first image. The second is my shares with usage broken down by drive. It transferred 14.6 GB from Cache to Disk 8, and managed to drop used from 859GB to 308GB. Could it be something to do with sector size on the cache? My plex metadata is in appdata, so far it has transferred 18621 files in the plex folder share, totalling 7.2g. 14.6G total across 36265 files. Maybe they are taking up lots of space despite being small? Then again, probably not. The cache drive portion of appdata still has 539131 files. I really don't understand what caused this problem in the first place. If moving 14G cleared up 500G of space, something just isn't right. EDIT: The pool drives are GPT 4kb-aligned. The cache is MBR: 1MiB-aligned.

-
VMs are not enabled.
-
Unraid 6.9.2 My server recently started sending me notifications about the cache drive utilization being over 90%. Its a 1TB samsung Evo SSD that is fairly new. Purchased 4/15/21 brand new and installed a few days later. Originally part of a raid-0 mirror with another drive that failed. Recently (a week or so ago) wiped and set up as single. Go to check on it. The free space keeps dropping, fairly slowly but consistently. I ran the mover to get all (non appdata/system) files off the cache disk. It moved a fair amount of stuff, but didn't free up any space. Using the file browser in unraid, only the appdata and system folders remain on the disk. Running the du -h /mnt/cache command shows that 310g are being used. df -h /mnt/cache or df -h /dev/sdb1 show 932g size 869g used 63g avail 94% use. I am currently running a scrub, its at 5.54% with no errors found. Also running a balance with 66% left. I'm stumped! Diagnostics attached. rocinante-diagnostics-20210820-1137.zip

.png.345d42bcd212dfc9254a6cc5846cfde8.png)


