MarlinJones

Members
  • Posts

    9
  • Joined

  • Last visited

Everything posted by MarlinJones

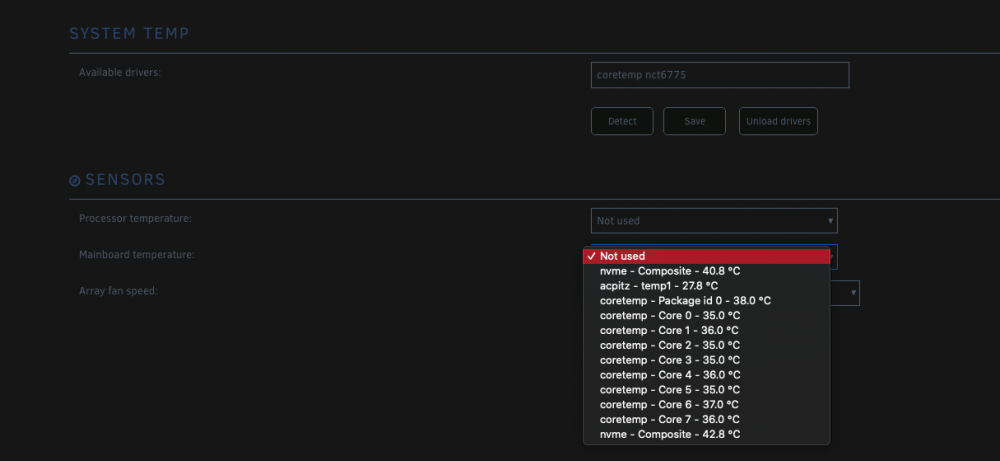
  1. I read through a bunch of these posts but still couldnt find a solution for the behavior I am seeing... sensors-detect is able to find `coretemp` and `nct6775` right away on my ASUS Prime Z490-Plus board. I am also able to find those drivers using "Detect" in the SYSTEM TEMP section of the plugin... However, it appears to me that none of the nct6775 sensors are actually populating... From command line, i can run `modprobe nct6775` without error, and it appears to me that the driver is loading properly. Is there something I am missing to ensure that nct6775 loads correctly? I also edited /boot/config/go to include: `modprobe coretemp` `modprobe nct6775` `/usr/bin/sensors -s` Heres what I see at the plugin:
  2. OS Version: 6.9.0-beta30 Processor: AMD Ryzen 7 PRO 4750G Motherboard: MSI MAG B550 MORTAR This is a bit of a duplicate post. I've been diagnosing some crashing behavior in another thread here. More recent developments seem to point at the rtl8125 driver and I thought that it might be best to bring that information here since I believe rtl8125 is a relatively new addition. I am seeing some syslog exception behavior followed by network messages in syslog. I think that the failures sometimes result in kernel panics that crash the whole system, but other times it seems to recover. Here is a log when it recovers: Oct 13 20:48:36 Athena kernel: WARNING: CPU: 14 PID: 14184 at drivers/iommu/iova.c:814 iova_magazine_free_pfns.part.0+0x37/0x5e Oct 13 20:48:36 Athena kernel: Modules linked in: xt_CHECKSUM ipt_REJECT ip6table_mangle ip6table_nat iptable_mangle ip6table_filter ip6_tables vhost_net tun vhost vhost_iotlb tap veth xt_nat xt_MASQUERADE iptable_filter iptable_nat nf_nat ip_tables xfs nfsd lockd grace sunrpc md_mod bonding edac_mce_amd kvm_amd kvm crct10dif_pclmul crc32_pclmul crc32c_intel ghash_clmulni_intel aesni_intel crypto_simd cryptd glue_helper wmi_bmof mpt3sas ahci i2c_piix4 raid_class rapl r8125(O) ccp nvme i2c_core libahci video scsi_transport_sas k10temp r8169 realtek backlight nvme_core acpi_cpufreq wmi button Oct 13 20:48:36 Athena kernel: CPU: 14 PID: 14184 Comm: kworker/14:1 Tainted: G W O 5.8.13-Unraid #1 Oct 13 20:48:36 Athena kernel: Hardware name: Micro-Star International Co., Ltd. MS-7C94/MAG B550M MORTAR (MS-7C94), BIOS 1.44 09/29/2020 Oct 13 20:48:36 Athena kernel: Workqueue: events rtl8125_reset_task [r8125] Oct 13 20:48:36 Athena kernel: RIP: 0010:iova_magazine_free_pfns.part.0+0x37/0x5e Oct 13 20:48:36 Athena kernel: Code: 89 fb 48 89 f7 e8 45 ec 29 00 49 89 c4 49 63 c5 48 3b 03 73 23 48 8b 74 c3 08 48 89 ef e8 6e fb ff ff 48 85 c0 48 89 c6 75 04 <0f> 0b eb 05 e8 4c ff ff ff 41 ff c5 eb d5 4c 89 e6 48 89 ef e8 a7 Oct 13 20:48:36 Athena kernel: RSP: 0018:ffffc900016afd20 EFLAGS: 00010046 Oct 13 20:48:36 Athena kernel: RAX: 0000000000000000 RBX: ffff888167624000 RCX: 000000008040003d Oct 13 20:48:36 Athena kernel: RDX: 0000000000000001 RSI: 0000000000000000 RDI: ffff8883fb4e9008 Oct 13 20:48:36 Athena kernel: RBP: ffff8883fb4e9008 R08: 0000000000000001 R09: ffffffff8141efc9 Oct 13 20:48:36 Athena kernel: R10: ffff8883fb38a6c0 R11: ffff8883fb38a6c0 R12: 0000000000000046 Oct 13 20:48:36 Athena kernel: R13: 0000000000000040 R14: ffff8883fb4e9008 R15: ffff8883fb4e9088 Oct 13 20:48:36 Athena kernel: FS: 0000000000000000(0000) GS:ffff8883ff380000(0000) knlGS:0000000000000000 Oct 13 20:48:36 Athena kernel: CS: 0010 DS: 0000 ES: 0000 CR0: 0000000080050033 Oct 13 20:48:36 Athena kernel: CR2: 000014e1d4f0c000 CR3: 000000035adec000 CR4: 0000000000340ee0 Oct 13 20:48:36 Athena kernel: Call Trace: Oct 13 20:48:36 Athena kernel: free_iova_fast+0x167/0x186 Oct 13 20:48:36 Athena kernel: fq_ring_free+0x74/0x92 Oct 13 20:48:36 Athena kernel: queue_iova+0x74/0x104 Oct 13 20:48:36 Athena kernel: __iommu_dma_unmap+0xc6/0xe8 Oct 13 20:48:36 Athena kernel: rtl8125_rx_clear+0x4b/0x85 [r8125] Oct 13 20:48:36 Athena kernel: rtl8125_reset_task+0x9d/0x114 [r8125] Oct 13 20:48:36 Athena kernel: process_one_work+0x13c/0x1d5 Oct 13 20:48:36 Athena kernel: worker_thread+0x18b/0x22f Oct 13 20:48:36 Athena kernel: ? process_scheduled_works+0x27/0x27 Oct 13 20:48:36 Athena kernel: kthread+0xe5/0xea Oct 13 20:48:36 Athena kernel: ? kthread_unpark+0x52/0x52 Oct 13 20:48:36 Athena kernel: ret_from_fork+0x22/0x30 Oct 13 20:48:36 Athena kernel: ---[ end trace 2e5dccb3ecd7d581 ]--- Oct 13 20:48:36 Athena dhcpcd[1891]: br0: carrier acquired Oct 13 20:48:36 Athena dhcpcd[1891]: br0: rebinding lease of 192.168.1.2 Oct 13 20:48:37 Athena kernel: r8125: eth0: link down Oct 13 20:48:37 Athena kernel: bond0: (slave eth0): link status definitely down, disabling slave Oct 13 20:48:37 Athena kernel: device eth0 left promiscuous mode Oct 13 20:48:37 Athena kernel: bond0: now running without any active interface! Oct 13 20:48:37 Athena kernel: br0: port 1(bond0) entered disabled state Oct 13 20:48:38 Athena dhcpcd[1891]: br0: carrier lost Oct 13 20:48:40 Athena kernel: r8125: eth0: link up Oct 13 20:48:40 Athena dhcpcd[1891]: br0: carrier acquired Oct 13 20:48:40 Athena kernel: bond0: (slave eth0): link status definitely up, 1000 Mbps full duplex Oct 13 20:48:40 Athena kernel: bond0: (slave eth0): making interface the new active one Oct 13 20:48:40 Athena kernel: device eth0 entered promiscuous mode Oct 13 20:48:40 Athena kernel: bond0: active interface up! Oct 13 20:48:40 Athena kernel: br0: port 1(bond0) entered blocking state Oct 13 20:48:40 Athena kernel: br0: port 1(bond0) entered forwarding state Oct 13 20:48:40 Athena dhcpcd[1891]: br0: rebinding lease of 192.168.1.2 Oct 13 20:48:41 Athena dhcpcd[1891]: br0: probing address 192.168.1.2/24 Oct 13 20:48:47 Athena dhcpcd[1891]: br0: leased 192.168.1.2 for 86400 seconds Oct 13 20:48:47 Athena dhcpcd[1891]: br0: adding route to 192.168.1.0/24 Oct 13 20:48:47 Athena dhcpcd[1891]: br0: adding default route via 192.168.1.1 Oct 13 20:48:48 Athena ntpd[1952]: Listen normally on 14 br0 192.168.1.2:123 I noticed that my server is occasionally doing a sort of "hiccup" behavior where it will stop responding to pings and the webUI entirely for somewhere between 10 and 30s.... Usually when I notice this, I assume the server has fully crashed since that is the error I am trying to diagnose. Sometimes the connection returns again without crashing. I've attached my diags as well. athena-diagnostics-20201013-2053.zip
  3. Sorry to keep bumping my own post with no responses but I found some more information that could help diagnose this properly. I noticed that my server is occasionally doing a sort of "hiccup" behavior where it will stop responding to pings and the webUI entirely for somewhere between 10 and 30s.... Usually when I notice this, I will think that it has crashed, but sometimes it comes back. I checked syslog after one of these and found this: Oct 13 20:48:36 Athena kernel: WARNING: CPU: 14 PID: 14184 at drivers/iommu/iova.c:814 iova_magazine_free_pfns.part.0+0x37/0x5e Oct 13 20:48:36 Athena kernel: Modules linked in: xt_CHECKSUM ipt_REJECT ip6table_mangle ip6table_nat iptable_mangle ip6table_filter ip6_tables vhost_net tun vhost vhost_iotlb tap veth xt_nat xt_MASQUERADE iptable_filter iptable_nat nf_nat ip_tables xfs nfsd lockd grace sunrpc md_mod bonding edac_mce_amd kvm_amd kvm crct10dif_pclmul crc32_pclmul crc32c_intel ghash_clmulni_intel aesni_intel crypto_simd cryptd glue_helper wmi_bmof mpt3sas ahci i2c_piix4 raid_class rapl r8125(O) ccp nvme i2c_core libahci video scsi_transport_sas k10temp r8169 realtek backlight nvme_core acpi_cpufreq wmi button Oct 13 20:48:36 Athena kernel: CPU: 14 PID: 14184 Comm: kworker/14:1 Tainted: G W O 5.8.13-Unraid #1 Oct 13 20:48:36 Athena kernel: Hardware name: Micro-Star International Co., Ltd. MS-7C94/MAG B550M MORTAR (MS-7C94), BIOS 1.44 09/29/2020 Oct 13 20:48:36 Athena kernel: Workqueue: events rtl8125_reset_task [r8125] Oct 13 20:48:36 Athena kernel: RIP: 0010:iova_magazine_free_pfns.part.0+0x37/0x5e Oct 13 20:48:36 Athena kernel: Code: 89 fb 48 89 f7 e8 45 ec 29 00 49 89 c4 49 63 c5 48 3b 03 73 23 48 8b 74 c3 08 48 89 ef e8 6e fb ff ff 48 85 c0 48 89 c6 75 04 <0f> 0b eb 05 e8 4c ff ff ff 41 ff c5 eb d5 4c 89 e6 48 89 ef e8 a7 Oct 13 20:48:36 Athena kernel: RSP: 0018:ffffc900016afd20 EFLAGS: 00010046 Oct 13 20:48:36 Athena kernel: RAX: 0000000000000000 RBX: ffff888167624000 RCX: 000000008040003d Oct 13 20:48:36 Athena kernel: RDX: 0000000000000001 RSI: 0000000000000000 RDI: ffff8883fb4e9008 Oct 13 20:48:36 Athena kernel: RBP: ffff8883fb4e9008 R08: 0000000000000001 R09: ffffffff8141efc9 Oct 13 20:48:36 Athena kernel: R10: ffff8883fb38a6c0 R11: ffff8883fb38a6c0 R12: 0000000000000046 Oct 13 20:48:36 Athena kernel: R13: 0000000000000040 R14: ffff8883fb4e9008 R15: ffff8883fb4e9088 Oct 13 20:48:36 Athena kernel: FS: 0000000000000000(0000) GS:ffff8883ff380000(0000) knlGS:0000000000000000 Oct 13 20:48:36 Athena kernel: CS: 0010 DS: 0000 ES: 0000 CR0: 0000000080050033 Oct 13 20:48:36 Athena kernel: CR2: 000014e1d4f0c000 CR3: 000000035adec000 CR4: 0000000000340ee0 Oct 13 20:48:36 Athena kernel: Call Trace: Oct 13 20:48:36 Athena kernel: free_iova_fast+0x167/0x186 Oct 13 20:48:36 Athena kernel: fq_ring_free+0x74/0x92 Oct 13 20:48:36 Athena kernel: queue_iova+0x74/0x104 Oct 13 20:48:36 Athena kernel: __iommu_dma_unmap+0xc6/0xe8 Oct 13 20:48:36 Athena kernel: rtl8125_rx_clear+0x4b/0x85 [r8125] Oct 13 20:48:36 Athena kernel: rtl8125_reset_task+0x9d/0x114 [r8125] Oct 13 20:48:36 Athena kernel: process_one_work+0x13c/0x1d5 Oct 13 20:48:36 Athena kernel: worker_thread+0x18b/0x22f Oct 13 20:48:36 Athena kernel: ? process_scheduled_works+0x27/0x27 Oct 13 20:48:36 Athena kernel: kthread+0xe5/0xea Oct 13 20:48:36 Athena kernel: ? kthread_unpark+0x52/0x52 Oct 13 20:48:36 Athena kernel: ret_from_fork+0x22/0x30 Oct 13 20:48:36 Athena kernel: ---[ end trace 2e5dccb3ecd7d581 ]--- Oct 13 20:48:36 Athena dhcpcd[1891]: br0: carrier acquired Oct 13 20:48:36 Athena dhcpcd[1891]: br0: rebinding lease of 192.168.1.2 Oct 13 20:48:37 Athena kernel: r8125: eth0: link down Oct 13 20:48:37 Athena kernel: bond0: (slave eth0): link status definitely down, disabling slave Oct 13 20:48:37 Athena kernel: device eth0 left promiscuous mode Oct 13 20:48:37 Athena kernel: bond0: now running without any active interface! Oct 13 20:48:37 Athena kernel: br0: port 1(bond0) entered disabled state Oct 13 20:48:38 Athena dhcpcd[1891]: br0: carrier lost Oct 13 20:48:40 Athena kernel: r8125: eth0: link up Oct 13 20:48:40 Athena dhcpcd[1891]: br0: carrier acquired Oct 13 20:48:40 Athena kernel: bond0: (slave eth0): link status definitely up, 1000 Mbps full duplex Oct 13 20:48:40 Athena kernel: bond0: (slave eth0): making interface the new active one Oct 13 20:48:40 Athena kernel: device eth0 entered promiscuous mode Oct 13 20:48:40 Athena kernel: bond0: active interface up! Oct 13 20:48:40 Athena kernel: br0: port 1(bond0) entered blocking state Oct 13 20:48:40 Athena kernel: br0: port 1(bond0) entered forwarding state Oct 13 20:48:40 Athena dhcpcd[1891]: br0: rebinding lease of 192.168.1.2 Oct 13 20:48:41 Athena dhcpcd[1891]: br0: probing address 192.168.1.2/24 Oct 13 20:48:47 Athena dhcpcd[1891]: br0: leased 192.168.1.2 for 86400 seconds Oct 13 20:48:47 Athena dhcpcd[1891]: br0: adding route to 192.168.1.0/24 Oct 13 20:48:47 Athena dhcpcd[1891]: br0: adding default route via 192.168.1.1 Oct 13 20:48:48 Athena ntpd[1952]: Listen normally on 14 br0 192.168.1.2:123 I attached my whole diagnostic here as well. This kernel panic occurs multiple times in a row. It appears to be to be related to rtl8125 which is a relatively new 2.5G NIC thats part of my motherboard. Its actually the reason I needed to use beta unRAID versions... Has anyone seen this before / anybody have suggestions? I am going to try 2 things: 1. Disable br0 and just use the connection without bonding enabled (although i think I require bridging for Docker) 2. Buy a PCIe x1 network card and use that instead of the built in ethernet... ill report back athena-diagnostics-20201013-2053.zip
  4. Ah just as an update I have still been unable to fully solve this issue. I have played around with memory speeds ad nauseam at this point... While decreasing memory speed down to 2133 does seem to make the crashes less frequent, it has not solved the problem. Im still getting one every 2 to 3 days. I have modified the C State / Idle behavior in the BIOS and have found no improvement... running out of things to try at this point
  5. ah i found the fix... No idea how I got into this position by my rsyslog.conf file in /boot/config/ was entirely empty. I just deleted it and let it repopulate after a reboot. Now it looks good. I had been experiencing occasional system crashes until recently so perhaps that file was somehow corrupted. I dont know. Thanks
  6. alright, I have gone ahead and rebooted into Safe Mode. I see that my few plugins have not started up + I see a red "System is running in safe mode" at the bottom of the screen. I started the array, started my Dockers... I still do not see any syslog. Using all the things mentioned above, I still see nothing. Was the "boot menu" portion required? I booted safe mode from the "Main" checkbox at the bottom of the screen. I dont have a monitor hooked up to my machine so its not as simple to do from the UEFI boot menu.
  7. Hi there, I am new to unRAID. My trial period is nearly complete and there are just a few oddities I'm still trying to work out about my unRAID installation. This one sounds ridiculously simple, but I have been unable to find any forum posts or suggestions online that solve my issue... I cannot seem to get syslog to work at all. I am not really sure what is going on, but there are never any messages generated from syslog. I have turned "Mirror syslog to flash" to ON, but I only ever see empty archives written to the USB stick. When I use `tail -f /var/log/syslog`, it never generates any additional text and just stays waiting forever. When I use `cat /var/log/syslog` it never prints a single line. I have not setup a remote or local syslog server, but my understanding is that those are just for additional logging to ensure that your syslog entries aren't lost with a reboot. When I use "Tools > System Log" it is just blank even though all the filters are checked ON. I have searched online but I cannot seem to find exactly what is going wrong. I apologize if perhaps I am missing some simple setting but it just seems that there should be _some_ syslog output. I thought that perhaps it is something to do with how I am booting unRAID, but both legacy and UEFI booting headless doesn't seem to change this behavior. Any suggestions? tower-diagnostics-20201011-1946.zip
  8. Thank you for the suggestion. When I originally configured the BIOS, the memory speed populated at 2133 MT/s. Since they are sold as 3866 sticks, I figured that XMP was required to get their intended performance. I wasn't familiar with XMP and therefore it never really occurred to me that this was a big overclock on the memory. I went ahead and made two changes: 1. Updated BIOS with a (beta 9/29/2020 v144) version from MSI that contains an update intended to improve APU performance on B550 boards. 2. Reset my memory back to the default 2133 MT/s by turning XMP off. I am happy to report that after about 36hours, it appears the system is stable without a single crash. I am going to go ahead and experiment with memory settings to reach that 3200 MT/s maximum supported by the 4750G processor. Hopefully I can find some rock solid settings at that frequency. If not, I will just have to bite the bullet and keep the memory at the default 2133 MT/s. I appreciate the help.
  9. OS Version: 6.9.0-beta25 and 6.9.0-beta29 Processor: AMD Ryzen 7 PRO 4750G Motherboard: MSI MAG B550 MORTAR Memory: G.SKILL TridentZ 16GB (2x8GB) DDR4 3866 PSU: Corsair RMx RM550x SSD (Cache): ADATA XPG SX8200 Pro 1TB Drives: 2x WD Red 10TB CMR, 4x WD Red 4TB CMR (not installed yet) Hey guys, I'm brand new to unRAID coming from Synology. I've really enjoyed what I have setup so far, but I am now running into an issue with my unRAID server crashing. I purchased brand new hardware for this setup except for 4x 4TBs that I plan on moving over to unRAID once everything is stable. I brought up my unRAID server with only 1x 10TB and 1x 4TB in my array and was able to move everything off of my Synology NAS onto my new unRAID array without any issues. The system seemed to be stable for about 2 days with no issues to report. I began installing a few Dockers at this point like Plex and Swag. Everything seemed to be working fine. Once my transfer was complete, I hooked up my ADATA SSD as `cache` + my other 10TB as parity and begin the parity build process. Within about 3 hours, the unRAID server went completely unresponsive out of nowhere. It would not respond to webUI nor SSH in any way. The only way I could get it to come back was to hard reset it. Since then, the server has been doing this same crash behavior every couple hours, sometimes quicker. Steps I have tried: Updated unRAID to 6.9.0-beta29 for new Linux Kernel... This didn't seem to make a difference. I am unable to downgrade to stable builds because they do not contain my motherboard's ethernet driver. The latest Linux kernels are also way better for the recent Ryzen APUs. I haven't observed any qualitative difference in this behavior between 6.9.0-beta25 and 6.9.0-beta29. Booted MemTest86 with Legacy boot. Ran overnight for ~11 hours without any errors. Booted server /w monitor attached. I was able to see the following kernel panic Ran the 'Fix Common Problems': nothing was really found of any interest. Used the zenstates to disable C6. Didn't make a difference and the server still crashed. Booted the array without a parity drive, but with the cache still selected. No parity build started for this test. Dockers were all running. Observed the same failure. Booted the array without the cache drive, but with the parity re-selected. This is currently still working /w uptime of about 6hrs... That is longer than its taken for previous failures to occur (usually about 1-2hrs for a failure). My goal is to complete the parity build before making any further changes. Docker is also disabled because cache is disconnected! One thing to note is that I have my docker.img setup to be at `/mnt/cache/docker.img` with my appdata folder at `/mnt/user/appdata/` and set at Prefer Cache. This means that I do not have Docker currently running now because I didn't start the array with cache... Perhaps it is feasible that there is something wrong with my Docker config or containers causing this, but I haven't really done anything out of the ordinary there. I am only running Plex-Media-Server, Swag, Tautulli, DuckDNS, and binhex-delugevpn at this point so nothing too crazy. I have left the settings at mostly default / what SpaceInvader recommended in a few of this videos. Where do you guys suggest I go next? Once my parity build is complete, I am comfortable reconnecting cache and doing some more debugging. I have attached my diagnostics from the current server boot (no cache) in case that is any help to you guys. I'm not sure whether this suggests a hardware issue or software issue and I am not experienced enough with unRAID to know how to debug deeper than this. P.S. I see `* If the system crashes completely and there is no way to capture a final syslog, then start a tail on the unRAID console or Telnet session (tail -f /var/log/syslog).` in your read me for this forum. I will run this once i reattach cache. I suspect it would show this same kernel panic above, but maybe with some better contextual information. tower-diagnostics-20201001-1718_noCacheAttached.zip