wickedathletes
Community Developer
-
Joined
-
Last visited
Everything posted by wickedathletes
-
so i have done some debugging and figured I would check in with the latest logs (although I doubt it found it yet). I did 4 days in safe mode (no issues, it usually crashes between 2-3 days) I then left safe mode and did 3+ days of plugins only (no dockers) (no issues) I then did 3+ days of these dockers on: plex, radarr, radarr 4k (second instance), sab, sonarr, tautulli (no issues) I then added cloudflare, homarr, seerr, traefik and it stopped responding after 2 days I am currently testing a different group of dockers with the original set that didn't have an issue. Assuming its one of those 4 dockers in the red line, but the only somewhat "new" docker is seerr and it was working fine. Eitherway, figured I would attach the logs in case anyone notices anything new. This whole, taking 2-3 days to stop responding thing is really annoying to debug. Is their any advanced logging I can turn on to help navigate the error better? hades-diagnostics-20260706-1135.zip
-
and also this just popped up, and this is what i am concerned could be causing my crashing, as it degrades over time, then eventually all dockers die out. Jun 23 09:57:20 HADES php-fpm[5126]: [WARNING] [pool www] server reached max_children setting (50), consider raising it
-
still running strong, closing in on 48 hours now, so 1-2 days to go. That said, I noticed these 2 things in my log today: Jun 22 10:19:33 HADES kernel: warning: `lshw' uses wireless extensions which will stop working for Wi-Fi 7 hardware; use nl80211 Wasn't sure if either mattered or not. Jun 23 07:32:15 HADES webgui: Successful login user root from 10.0.0.48 Jun 23 07:32:16 HADES nginx: 2026/06/23 07:32:16 [error] 5237#5237: *20763 open() "/usr/local/emhttp/apple-touch-icon-precomposed.png" failed (2: No such file or directory) while sending to client, client: 10.0.0.48, server: XYZ.myunraid.net, request: "GET /apple-touch-icon-precomposed.png HTTP/2.0", host: "XYZ.myunraid.net:3443" I assume the above was caused by my attempt to login from my phone?
-
My machine is roughly on 24 hours of uptime, so another 48-72 to go to see if I am in the clear when running in GUI Safe Mode however, I saw these in my log and was wondering if this was anything? Jun 21 12:08:23 HADES ntpd[2650]: duplicate or replay: org 0xede28af7.2fc7a29a does not match 0x0.00000000 from [email protected] Jun 21 12:09:27 HADES ntpd[2650]: duplicate or replay: org 0xede28b37.2fc80104 does not match 0x0.00000000 from [email protected] Jun 21 12:09:37 HADES ntpd[2650]: duplicate or replay: org 0xede28b41.c8419670 does not match 0x0.00000000 from [email protected] Jun 21 12:45:14 HADES ntpd[2650]: duplicate or replay: org 0xede2939a.c842c026 does not match 0x0.00000000 from [email protected]
-
hades-diagnostics-20260614-1903.zip I plan to start safe mode soon, didn't want to annoy too many Plex friends on the weekend. A few questions and also the latest logs in case this helps at all. I noticed the following after I captured those logs above. Is this common to see? Also, Maintainerr is disabled and turned off, why does it keep trying to find the icon still? Jun 15 10:12:26 HADES kernel: vethd938b94: renamed from eth0 Jun 15 10:12:26 HADES kernel: br-35630357bbbc: port 7(vethc148694) entered disabled state Jun 15 10:12:26 HADES kernel: vethc148694 (unregistering): left allmulticast mode Jun 15 10:12:26 HADES kernel: vethc148694 (unregistering): left promiscuous mode Jun 15 10:12:26 HADES kernel: br-35630357bbbc: port 7(vethc148694) entered disabled state Jun 15 10:12:26 HADES kernel: br-35630357bbbc: port 7(vethd414c76) entered blocking state Jun 15 10:12:26 HADES kernel: br-35630357bbbc: port 7(vethd414c76) entered disabled state Jun 15 10:12:26 HADES kernel: vethd414c76: entered allmulticast mode Jun 15 10:12:26 HADES kernel: vethd414c76: entered promiscuous mode Jun 15 10:12:26 HADES kernel: eth0: renamed from vethcd44c90 Jun 15 10:12:26 HADES kernel: br-35630357bbbc: port 7(vethd414c76) entered blocking state Jun 15 10:12:26 HADES kernel: br-35630357bbbc: port 7(vethd414c76) entered forwarding state Jun 15 10:12:30 HADES webgui: Maintainerr: Could not download icon https://github.com/jorenn92/Maintainerr/blob/main/ui/public/logo.png?raw=true
-
boot into safe mode and see if it, it eventually fails again in 2-3 days? Just trying to figure out what this is checking? Is it because plugins and dockers aren't turned on doing that?
-
syslog.ziphades-diagnostics-20260611-1008.zip attached are the latest round of logs. I removed 2 plugins as well. Hopefully this helps in some way to diagnose what could be causing this issue? Like clockwork, the server becomes unresponsive after 48-72hrs.
-
do the attached logs not show the reason for crash? its been crashing for a few weeks now, I was able to capture "diagnostics" before rebooting, its attached.
-
thank you, I noticed that via a command line i found to use so I rebooted. Now just trying to figure out why I keep crashing.
-
hades-diagnostics-20260608-0953.ziplogs attached. Seeing a ton of this: Jun 5 17:04:24 HADES php-fpm[11183]: [WARNING] [pool www] server reached max_children setting (50), consider raising it Jun 5 17:08:25 HADES nginx: 2026/06/05 17:08:25 [error] 11342#11342: *153975 upstream timed out (110: Connection timed out) while reading response header from upstream, client: 10.0.0.74, server: 10-0-0-218.90e2fe0d49f96ca5d5fa9dc615c0641bedcef03e.myunraid.net, request: "POST /webGui/include/Report.php HTTP/2.0", subrequest: "/auth-request.php", upstream: "fastcgi://unix:/var/run/php-fpm.sock", host: "10-0-0-218.90e2fe0d49f96ca5d5fa9dc615c0641bedcef03e.myunraid.net:446", referrer:
-
yes, I was able to grab the diagnostics, I am more wondering if the reboot is safe if the data rebuild was still happening. That said, it looks like it had finished so I rebooted.
-
thank you. is it safe to reboot whether the parity rebuild finished or not, if you know.
-
I have a server that was doing a data rebuild (94% on Friday) and at some point Friday night my server became unresponsive. Couple questions: Is it safe for me to reboot without knowing the status of the rebuild? Is there a way for me to see the status of the rebuild on the console? How do I get diagnostics saved from console on the usb stick so I can reboot and grab the zip to see why the heck my server keeps becoming unresponsive after 24-72hrs. I am running 7.3.1, however I tried 7.2.x and 7.3.0 with same issues. I thought my issue was the drive I had failing so I put in a backup drive. Unfortunately that doesn’t seem to be it either.
-
I am unsure of the best way to capture the syslog when the system locks up and it needs to be hard-restarted. If I hard power down can I get the old syslog from the USB stick still?
-
I initially thought it had something to do with moving to 7.3 as it started happening when I made that move. However, I have since reverted back to 7.2.7 and still seeing the issue. After 24-48 hours my server becomes somewhat unresponsive. By this I mean, some dockers still work (Plex streaming for example), but they act wonky (I cant run meta-agents in Plex). At this point I can not log back into my server and I have to hard-reboot it. I do have a drive that needs to be replaced but I am concerned that if thats not the problem what happens when the parity is being rebuild and my server crashes? In wondering if it was 7.3.x (both 7.3.0 and 7.3.1 had same issue) I replaced my old as dirt USB stick to a new one as well, but it didn't solve anything. The last crash happened sometime in the last 24 hours, its tough to pinpoint when it stops responding unless im checking it hourly. I have attached my diagnostics logs in hoping someone can find something I am missing. hades-diagnostics-20260601-1622.zip
-
so running in safe mode had it finish with an average speed of 131MB/s. I noticed my cpu performance was pegged and I disabled folder cache plugin. This solved my processor issues, wondering if that was causing everything? The odd thing is this only started happening since 7.0 release. It worked as it normally did back on the RC's (I run parity every few months). No folder structures of cache folder settings changed, so not sure. I will see how it does with the array running soon (I have a scheduled on in 2 weeks).
-
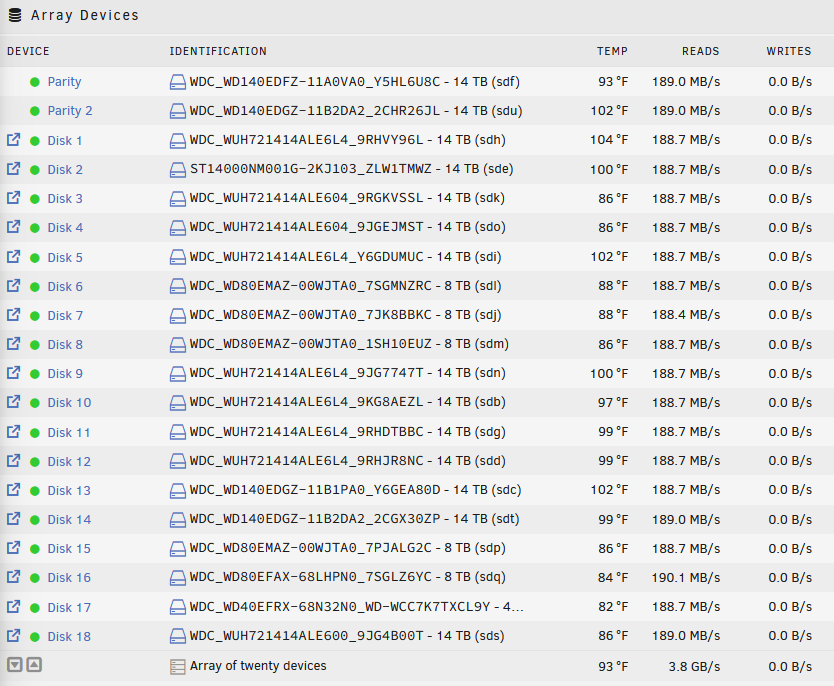
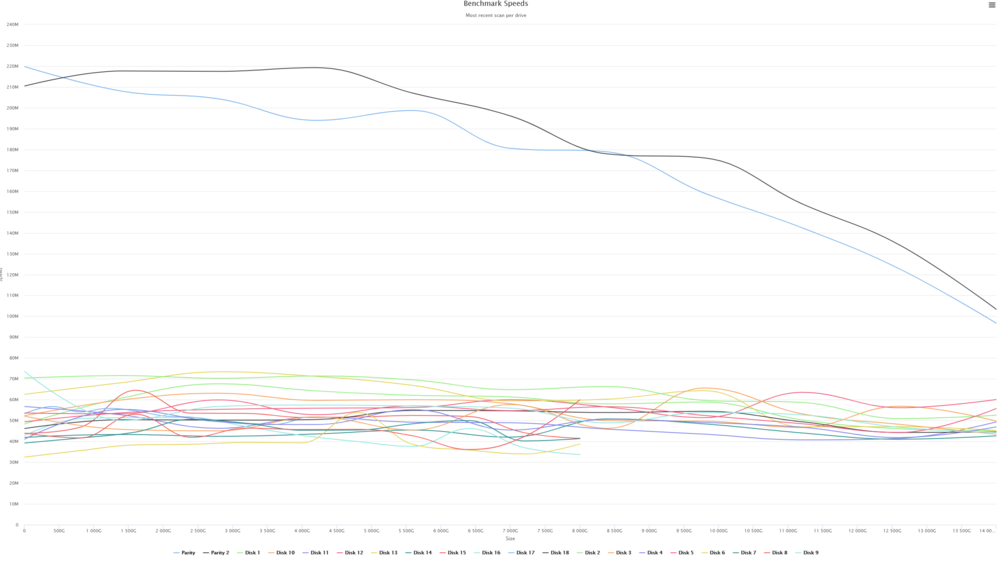
Is it common to see the speeds go down over time? 7hrs in (27%) and down to 96MB/s. until about 15% it maintained the 180-190MB/s.
-
So running a parity under safe mode has me at about 190 MB/s (its early, sub 1%). I will assume this will be the case until about 40% and then I will hit the same snag area. If not, maybe im good? But when I did it over the last few tries this month 0-40% was roughly 35MB/s (my normal, again with docker and everything running, not in safe mode) and then it haults for no real reason that I can see. Will monitor.
-
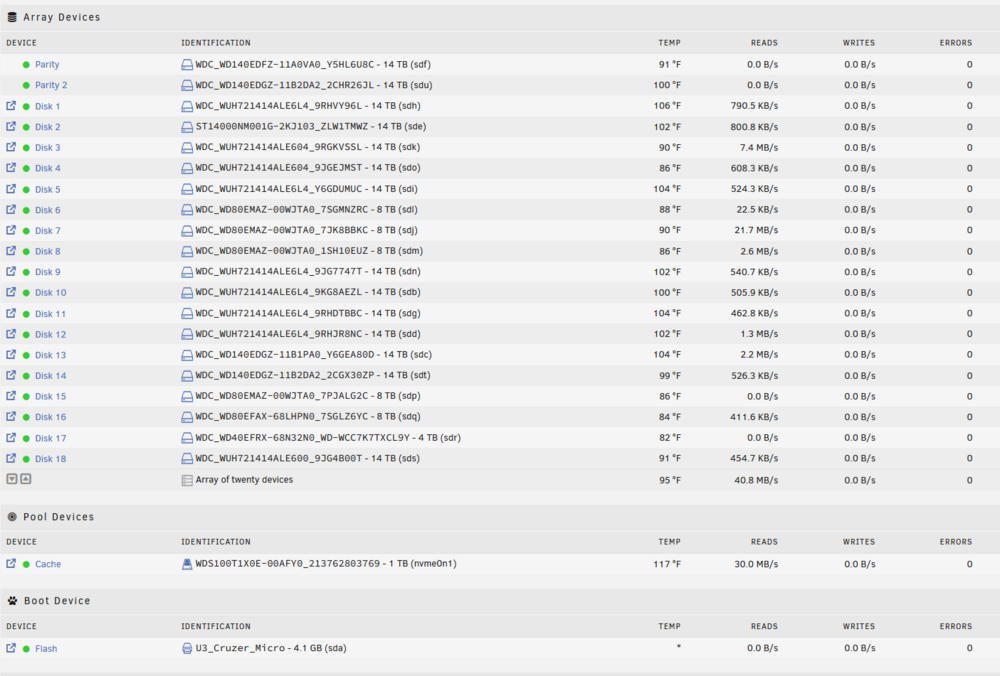
these results are with the array running (and they produce the same with parity paused or running). I know something is wrong, just dont know what or how to even diagnose what is happening. Everything is functioning as it normally does minus parity running like trash. My recent logs attached. hades-diagnostics-20250209-1433.zip
-
Attached is from when I ran it a day or so ago. Also, I am back down to 700KB/s again. killing dockers 2 nights ago got it up to 7MB/s and restoring the dockers it stayed at 7MB/s but today its been 700KB/s all day.
-
diskspeed docker gives me 35-85 MB/s depending on the drive, I ran that a few days ago, with and without the parity being run, so oddly enough parity process had no impact to the diskspeed performance test. After shutting down all my dockers I am up to about 5-7MB/s and re-enabling them a few hours ago didn't impact that change, but something is still drawing 20+ MB/s from my typical times. And, as mentioned the first 40% or so runs at normal speed and then it crashes. This was seen 3 times in a row. At this point I don't want to restart it again though as at least now i am in a 20 days until finish window and its been running for over 10 days now. I would assume I would see the same thing again (for a 4th time) if I checked it. This parity to me is important because I have 2 drives I have been trying to add to the system to replace older ones but I want to make sure all is well before I do it, and I have major concerns that if a parity check is taking this long I can't have a data rebuild take 40 days... Also, one of the reasons I don't think its read/write is because I just kicked off a data transfer to my PC (200GB) and I am getting 40MB/s and parity check didnt change at all, still 5-7MB/s. Something else is happening I just don't know what. If parity is running and draining my server that bad then shouldn't everything be getting crushed to those speeds too?
-
any best guess on what is the best thing I can look into that is causing this? The first 30-40% run at 30-40MB/s. Then it crawls to 600KB/s. I shutdown all dockers and the best I can get it to is 5MB/s. This is reproducible and have little fluctuation depending on time of day (which to me means this isn't a read/write issue its something else. Nothing has changed since my last parity run besides all drives now being ZFS (I believe I had a few that still weren't in december) and unraid 7.0 full version (was on beta in dec.). My usage patterns haven't changed in years beyond maybe some more friends in plex (but currently Plex is off anyways).
-
Yes, I noticed that and adjusted. I shut down all dockers this AM and the best I’m getting is 3MB/s. any other guesses on what could be writing/reading from my disks? Also, why would it run at 30-40MB/s for the first 30-40% then immediately fall apart for the rest of the time? If it was a read/write activity it would be consistent based on activity no? My server activity is roughly the same daily.
-
Sorry, I was referring to the writes.
-
not sure if there is a better way to tell but I don't see anything