


Daniel Thiberge
Members
-
Joined
-
Last visited
-
I wasn't but got those errors after installing the Intel SR-IOV plugin, trying to resolve some 'av:hevc:df0 gpu hang' errors, which I've now narrowed down to the Frigate container. Likely just need to change which driver it uses so nothing major, appreciate it!
-
Just adding, I'm seeing the following errors but believe they're unrelated to the initial issue: Nov 28 09:48:13 srv-host-0 kernel: i915 0000:00:02.0: [drm] ERROR GT0: GUC: CT: Sending action 0x550b failed (-EIO) status=0XE0000102 Nov 28 09:48:13 srv-host-0 kernel: i915 0000:00:02.0: [drm] GT0: IOV: Failed to save VF1 state (-EPROTO) Nov 28 09:48:13 srv-host-0 kernel: i915 0000:00:02.0: [drm] ERROR GT0: GUC: CT: Sending action 0x550b failed (-EIO) status=0XE0000102 Nov 28 09:48:13 srv-host-0 kernel: i915 0000:00:02.0: [drm] GT0: IOV: Failed to save VF2 state (-EPROTO) Nov 28 09:48:13 srv-host-0 kernel: i915 0000:00:02.0: [drm] ERROR GT0: GUC: CT: Sending action 0x550b failed (-EIO) status=0XE000000A Nov 28 09:48:13 srv-host-0 kernel: i915 0000:00:02.0: [drm] GT0: IOV: Failed to save VF3 state (-EPROTO) Nov 28 09:48:13 srv-host-0 kernel: i915 0000:00:02.0: [drm] ERROR GT0: GUC: CT: Sending action 0x550b failed (-EIO) status=0XE000000A Nov 28 09:48:13 srv-host-0 kernel: i915 0000:00:02.0: [drm] GT0: IOV: Failed to save VF4 state (-EPROTO) Nov 28 09:48:13 srv-host-0 kernel: i915 0000:00:02.0: [drm] ERROR GT0: GUC: CT: Sending action 0x550b failed (-EIO) status=0XE000000A Nov 28 09:48:13 srv-host-0 kernel: i915 0000:00:02.0: [drm] GT0: IOV: Failed to save VF5 state (-EPROTO) Nov 28 09:48:13 srv-host-0 kernel: i915 0000:00:02.0: [drm] ERROR GT0: GUC: CT: Sending action 0x550b failed (-EIO) status=0XE000000A Nov 28 09:48:13 srv-host-0 kernel: i915 0000:00:02.0: [drm] GT0: IOV: Failed to save VF6 state (-EPROTO) Nov 28 09:48:13 srv-host-0 kernel: i915 0000:00:02.0: [drm] ERROR GT0: GUC: CT: Sending action 0x550b failed (-EIO) status=0XE000000A Nov 28 09:48:13 srv-host-0 kernel: i915 0000:00:02.0: [drm] GT0: IOV: Failed to save VF7 state (-EPROTO) Nov 28 09:48:13 srv-host-0 kernel: intel_gpu_top[40452]: segfault at 78 ip 000055dad4c22464 sp 00007ffd3dddea00 error 4 in intel_gpu_top[9464,55dad4c1f000+a000] likely on CPU 8 (core 16, socket 0) Nov 28 09:48:13 srv-host-0 kernel: Code: ff 4c 8b bd 98 e4 ff ff 48 89 b5 f0 e9 ff ff 48 89 bd f8 e9 ff ff eb 12 4c 89 f8 48 83 c0 08 49 89 c7 48 8b 00 48 85 c0 74 11 <80> 78 38 00 74 e8 48 8b 78 30 e8 5d d2 ff ff eb dd 48 8b 85 70 e4
-
Well, things appear to be working as expected now so while I'm not certain what specifically resolved it, I'll list all changes I made below in case it helps anyone else: Increased "Number of fuse File Descriptors" to the max supported value listed in the UI Ensured appdata has exclusive access set to yes for direct cache access, bypassing SHFS Ran 'touch /boot/config/fastusr' and rebooted to ensure OS data stays in RAM no matter what Removed any unnecessary plugins
-
Made the suggested changes and rebooted into regular (non-safe mode) Unraid, CPU usage seemed to be more balanced and system RAM usage was reasonable. But got a new error in the logs that I haven't seen before: kernel: ffprobe[281109]: segfault at 330 ip 00001477410eb822 sp 00007ffe39e384d0 error 6 in libavcodec.so.60.31.102[2eb822,147740e11000+b1a000] likely on CPU 18 (core 30, socket 0) Running Memtest86+ now to rule out actual issues with the RAM, but with everything working error-free in safe mode I doubt that's the issue. Will look at plugins next but that'll take a while to try and narrow down.
-
That definitely seemed to be the case, though in all my monitoring I never saw memory use go past 90% despite the errors. Advanced view wasn't reporting any significant container CPU or RAM use either, it was almost entirely system RAM and CPU use through SHFS. I'd think this would be related to some file/IO operations, which definitely were initiated by the containers given the issues disappeared when docker (or some containers with large mounts) were stopped. This just wasn't an issue with all the same things running a while back (pre-hardware changes and Unraid update). And the fact the the issue seems gone when booted into safe mode really hints at an underlying issue with Unraid handling container access to such large numbers of files. All that said, really useful advice there! I could've sworn I updated Number of fuse File Descriptors in the past but it's currently only at 40960. Will try the max! No VMs running at least and actual container use of RAM is quite low (14/64GB). Will check the link as well!
-
Adding a screenshot from my Open Files plugin. Taking a closer look, shfs has a lot of files open from cache for docker appdata. I just checked and for some reason the appdata share has exclusive access set to no, so I'll try and change that to see if it helps. Edit: Exclusive access didn't fix the issue, I'm seeing system RAM usage above 40GB, there's no way that's normal! Edit2: Stopped all media containers and CPU usage is normal now, though system RAM usage is still above 41GB which does not seem normal. Monitoring to see if the previous error logs come back while those containers are stopped, then I'll bring them up one by one to see what spikes the CPU. With advanced view enabled I wasn't seeing any crazy usage by individual containers previously though. Edit3: Only started Plex and CPU jumped too 100% almost immediately. It does have more periods where it's lower rather than being pinned at almost 100%, but shfs is now frequently back at the top % in htop and system RAM usage is still very high. What's weird is Plex isn't even doing anything though. No transcoding, no active library scans, no streams. The above error logs haven't shown up again, but I'm still seeing sporadic "php-fpm[15832]: [WARNING] [pool www] child 3618207 exited on signal 9 (SIGKILL) after 293.297239 seconds from start" Unraid log entries. Edit4: Well.. rebooted into safe mode and issue appears to be gone? Maybe a plugin incompatibility with Unraid 7.2.x but outside maybe mover tuning I can't really think of one that'd be particularly problematic. Will continue to run it like this for a day or so to see if the issue comes back and if not, will uninstall all plugins and slowly bring them back while monitoring for the issue. Regardless, if anyone has input or could check the diagnostics, I'd really appreciate that!

-
Hi there, would really appreciate some input here as this is a relatively new issue for me. My system is quite beefy with an i9-12900H and 64GB of DDR5 RAM. 2TB of NVMe cache in RAID 0 and 248TB of HDD array storage, split over two USB 3.2 external enclosures (which I know some people dislike, but it's been rock solid stability-wise). I run a large number of docker containers (~25) including Plex, Frigate, Nextcloud, Immich, etc. so I have a pretty huge number of 'open' files at any given time. Back when I was using an Intel NUC with an i7 this wasn't an issue, but after migrating to a Minisforum MS-01 I've had constant performance issues with the Unraid Web UI and docker app responsiveness, with CPU usage constantly at or near 100%. It goes away when Docker is disabled, but I haven't been able to narrow the cause to a specific container. It's still present even with Plex, Jellyfin, Frigate, and other IO-heavy apps all stopped. htop consistently shows /usr/libexec/unraid/shfs /mnt/user -disk 4095 -o default_permissions,allow_other,noatime -o remember=0 as the main source of CPU usage and not just when the mover is running. I've confirmed my appdata is fully on the cache drives, and while it's pathed as /mnt/user/appdata, it's configured as per best practices and should be bypassing shfs for those reads/writes. Some containers do, however, access data on the array, such as media for Plex and photos/files for Immich/Nextcloud. I've uninstalled the GPU Statistic plugin and other plugins that have been noted to cause relevant issues and the problem was present on both Unraid 7.2.0 and now 7.2.2. Looked into configuring a swap file but the plugin for that seems to only be for an old Unraid version, and really the RAM usage shouldn't be a problem despite the following. I see RAM usage around 82%, with the following System: 36.8 GiB, Docker: 14.4 GiB, Free: 11.4 GiB Then this will pop up in Unraid logs and CPU usage will drop for a second before rising again: Nov 27 20:43:35 srv-host-0 php-fpm[15832]: [WARNING] [pool www] child 3361052 exited on signal 9 (SIGKILL) after 333.258686 seconds from start Nov 27 20:43:44 srv-host-0 kernel: lsof: vmalloc error: size 8388608, failed to allocated page array size 16384, mode:0x400cc2(GFP_KERNEL_ACCOUNT|__GFP_HIGHMEM), nodemask=(null),cpuset=/,mems_allowed=0 Nov 27 20:43:44 srv-host-0 kernel: CPU: 19 UID: 0 PID: 3389358 Comm: lsof Tainted: P D O 6.12.54-Unraid #1 Nov 27 20:43:44 srv-host-0 kernel: Tainted: [P]=PROPRIETARY_MODULE, [D]=DIE, [O]=OOT_MODULE Nov 27 20:43:44 srv-host-0 kernel: Hardware name: Micro Computer (HK) Tech Limited Venus Series/AHWSA, BIOS 1.27 04/03/2025 Nov 27 20:43:44 srv-host-0 kernel: Call Trace: Nov 27 20:43:44 srv-host-0 kernel: <TASK> Nov 27 20:43:44 srv-host-0 kernel: dump_stack_lvl+0x47/0x70 Nov 27 20:43:44 srv-host-0 kernel: warn_alloc+0xfa/0x190 Nov 27 20:43:44 srv-host-0 kernel: __vmalloc_node_range_noprof+0x28f/0x5f0 Nov 27 20:43:44 srv-host-0 kernel: ? seq_read_iter+0x1c6/0x350 Nov 27 20:43:44 srv-host-0 kernel: __kvmalloc_node_noprof+0xa2/0xb0 Nov 27 20:43:44 srv-host-0 kernel: ? seq_read_iter+0x1c6/0x350 Nov 27 20:43:44 srv-host-0 kernel: seq_read_iter+0x1c6/0x350 Nov 27 20:43:44 srv-host-0 kernel: ? copyto_user+0x15/0x40 Nov 27 20:43:44 srv-host-0 kernel: seq_read+0xdb/0x110 Nov 27 20:43:44 srv-host-0 kernel: vfs_read+0x9d/0x1c0 Nov 27 20:43:44 srv-host-0 kernel: ? __do_sys_newfstat+0x33/0x60 Nov 27 20:43:44 srv-host-0 kernel: ksys_read+0x71/0xc0 Nov 27 20:43:44 srv-host-0 kernel: do_syscall_64+0x68/0xe0 Nov 27 20:43:44 srv-host-0 kernel: entry_SYSCALL_64_after_hwframe+0x76/0x7e Nov 27 20:43:44 srv-host-0 kernel: RIP: 0033:0x1500cafd8c02 Nov 27 20:43:44 srv-host-0 kernel: Code: 00 00 00 48 8b 05 e6 71 16 00 64 89 10 48 c7 c2 ff ff ff ff 48 83 c4 18 48 89 d0 c3 0f 1f 40 00 49 89 ca 48 8b 44 24 20 0f 05 <48> 89 c2 48 3d 00 f0 ff ff 77 0b 48 89 d0 48 83 c4 18 c3 0f 1f 00 Nov 27 20:43:44 srv-host-0 kernel: RSP: 002b:00007ffcaeca1bd0 EFLAGS: 00000202 ORIG_RAX: 0000000000000000 Nov 27 20:43:44 srv-host-0 kernel: RAX: ffffffffffffffda RBX: 0000000000440670 RCX: 00001500cafd8c02 Nov 27 20:43:44 srv-host-0 kernel: RDX: 0000000000000400 RSI: 00000000004d3860 RDI: 0000000000000007 Nov 27 20:43:44 srv-host-0 kernel: RBP: 00001500cb13f210 R08: 0000000000000000 R09: 0000000000000000 Nov 27 20:43:44 srv-host-0 kernel: R10: 0000000000000000 R11: 0000000000000202 R12: 00001500cb13f0c0 Nov 27 20:43:44 srv-host-0 kernel: R13: 0000000000000000 R14: 0000000000440670 R15: 0000000000001000 Nov 27 20:43:44 srv-host-0 kernel: </TASK> Nov 27 20:43:44 srv-host-0 kernel: Mem-Info: Nov 27 20:43:44 srv-host-0 kernel: active_anon:214737 inactive_anon:2885185 isolated_anon:0 Nov 27 20:43:44 srv-host-0 kernel: active_file:2300391 inactive_file:255373 isolated_file:0 Nov 27 20:43:44 srv-host-0 kernel: unevictable:9491351 dirty:444 writeback:0 Nov 27 20:43:44 srv-host-0 kernel: slab_reclaimable:573293 slab_unreclaimable:197053 Nov 27 20:43:44 srv-host-0 kernel: mapped:653616 shmem:9661281 pagetables:36496 Nov 27 20:43:44 srv-host-0 kernel: sec_pagetables:524 bounce:0 Nov 27 20:43:44 srv-host-0 kernel: kernel_misc_reclaimable:0 Nov 27 20:43:44 srv-host-0 kernel: free:162450 free_pcp:4 free_cma:0 Nov 27 20:43:44 srv-host-0 kernel: Node 0 active_anon:858948kB inactive_anon:11540740kB active_file:9201564kB inactive_file:1021492kB unevictable:37965404kB isolated(anon):0kB isolated(file):0kB mapped:2614464kB dirty:1776kB writeback:0kB shmem:38645124kB shmem_thp:53248kB shmem_pmdmapped:0kB anon_thp:100352kB writeback_tmp:0kB kernel_stack:70280kB pagetables:145984kB sec_pagetables:2096kB all_unreclaimable? no Nov 27 20:43:44 srv-host-0 kernel: Node 0 DMA free:15360kB boost:0kB min:12kB low:24kB high:36kB reserved_highatomic:0KB active_anon:0kB inactive_anon:0kB active_file:0kB inactive_file:0kB unevictable:0kB writepending:0kB present:15992kB managed:15360kB mlocked:0kB bounce:0kB free_pcp:0kB local_pcp:0kB free_cma:0kB Nov 27 20:43:44 srv-host-0 kernel: lowmem_reserve[]: 0 863 63991 63991 63991 Nov 27 20:43:44 srv-host-0 kernel: Node 0 DMA32 free:259756kB boost:4012kB min:4920kB low:5804kB high:6688kB reserved_highatomic:2048KB active_anon:2576kB inactive_anon:242204kB active_file:45288kB inactive_file:5096kB unevictable:293132kB writepending:0kB present:1022096kB managed:926752kB mlocked:0kB bounce:0kB free_pcp:0kB local_pcp:0kB free_cma:0kB Nov 27 20:43:44 srv-host-0 kernel: lowmem_reserve[]: 0 0 63127 63127 63127 Nov 27 20:43:44 srv-host-0 kernel: Node 0 Normal free:374684kB boost:293904kB min:360560kB low:425200kB high:489840kB reserved_highatomic:118784KB active_anon:856372kB inactive_anon:11297828kB active_file:9156276kB inactive_file:1016396kB unevictable:37672272kB writepending:1776kB present:65794048kB managed:64642452kB mlocked:1131124kB bounce:0kB free_pcp:16kB local_pcp:16kB free_cma:0kB Nov 27 20:43:44 srv-host-0 kernel: lowmem_reserve[]: 0 0 0 0 0 Nov 27 20:43:44 srv-host-0 kernel: Node 0 DMA: 0*4kB 0*8kB 0*16kB 0*32kB 0*64kB 0*128kB 0*256kB 0*512kB 1*1024kB (U) 1*2048kB (M) 3*4096kB (M) = 15360kB Nov 27 20:43:44 srv-host-0 kernel: Node 0 DMA32: 2792*4kB (UME) 1390*8kB (UME) 787*16kB (UME) 453*32kB (UME) 264*64kB (UME) 128*128kB (UME) 294*256kB (UME) 53*512kB (UME) 15*1024kB (M) 9*2048kB (UMH) 10*4096kB (UM) = 259808kB Nov 27 20:43:44 srv-host-0 kernel: Node 0 Normal: 3332*4kB (UMEH) 21686*8kB (UMEH) 10221*16kB (UMH) 177*32kB (UME) 245*64kB (M) 15*128kB (M) 0*256kB 0*512kB 0*1024kB 0*2048kB 0*4096kB = 373616kB Nov 27 20:43:44 srv-host-0 kernel: Node 0 hugepages_total=0 hugepages_free=0 hugepages_surp=0 hugepages_size=1048576kB Nov 27 20:43:44 srv-host-0 kernel: Node 0 hugepages_total=0 hugepages_free=0 hugepages_surp=0 hugepages_size=2048kB Nov 27 20:43:44 srv-host-0 kernel: 12259269 total pagecache pages Nov 27 20:43:44 srv-host-0 kernel: 0 pages in swap cache Nov 27 20:43:44 srv-host-0 kernel: Free swap = 0kB Nov 27 20:43:44 srv-host-0 kernel: Total swap = 0kB Nov 27 20:43:44 srv-host-0 kernel: 16708034 pages RAM Nov 27 20:43:44 srv-host-0 kernel: 0 pages HighMem/MovableOnly Nov 27 20:43:44 srv-host-0 kernel: 311893 pages reserved Nov 27 20:43:44 srv-host-0 kernel: 0 pages cma reserved srv-host-0-diagnostics-20251127-2054.zip srv-host-0-diagnostics-20251127-2036.zip
-
Seems to be fixed with the update from today.
-
Same issue here, restoring from an appdata backup for the container from almost a week ago didn't fix it so not sure what the issue is.
-
It was the USB-C cable haha. Thought I bought a nice one but a cheaper one brought the expected speeds.
-
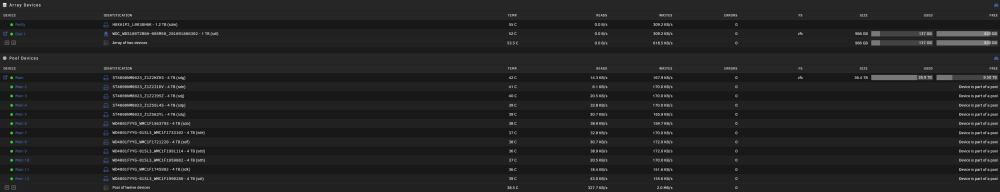
Struggling to troubleshoot a slow parity sync. Just swapped to a new system with a mini PC (i7, 64GB RAM) and USB 3.2 gen 2 DAS enclosure. A few things I noticed were: Initial transfer of my data over 1 gig network was at the expected speeds (110-250MB/s) but slowed to 5-30MB/s if the array was in use by docker apps on the new system Upon rebooting the new system, sometimes a disk (saw it happen to two) won't show up which requires another reboot to resolve Parity sync/check averages 5-8MB/s when array is in use by docker apps First issue was resolved by simply minimizing app use while the transfer finished. Second issue doesn't affect my data and I'm not surprised by with USB DAS. Though I did research and went with a TERRAMASTER D6-320 for a good USB controller and quality USB-C cable. It's also connected over SCSI. I know it's not recommended regardless, but hope it helps a bit. Third issue I can't seem to get around. I've rebooted and started a fresh sync, checked SMART data, done individual disk benchmarks, and ensured all docker apps didn't autostart. Nothing should be using my array but my parity sync is insanely slow. One of the drives is 5400RPM but that should still be ~100MB/s. Attached diagnostics downloaded after a reboot + letting parity sync for a bit. Edit: Ah, I see OOS12000G_000DSWBK - 12 TB (sdh) has a ton of read errors (which didn't show up on alerts or the Main page). Will try removing after transferring out the data and report back. Edit 2: Removed the drive from the array with a new config, parity sync is still the same speed so it wasn't that. Any clues? Adding new diagnostics from post-removal in case it helps. Edit 3: Writes to the array are about 90MB/s over SFTP during the parity sync, reads about the same. Definitely not the disks from what I see. srv-host-0-diagnostics-20240509-0152.zip srv-host-0-diagnostics-20240509-0248.zip
-
Nah, the server is filled to the brim. That makes sense, was my risk to take I guess haha. That said, I was looking to switch to a mini PC and DAS setup soonish anyway.* Technically my ZFS pool in Unraid is just a normal pool, and therefore OS agnostic right? It’d be great if I could move my boot USB to a new system, boot the current server in a live environment, import the pool, and transfer over the network. *Doing my research so I know what I’m getting into first.. I know it’s also not recommended.
-
I've been using a ZFS pool (12x 4TB SAS HDD) as my primary storage (user, appdata, media, etc.) while my array (1x 1TB SSD + 1x 1.2TB HDD for parity) just held AppData backups. I know, I know, it's not how this was intended to be used but I thought the pool would be significantly more performant and ended up here. I want to move back to a traditional setup with the 12 drives being on the array and the SSD + extra drive being cache. Biggest issue is my pool has about 27TB out of about 36 used, mostly for Plex media with a bit of appdata and personal files. I have no idea how to go about fixing up my array without transferring all this data elsewhere. I do have 2x 12TB external HDDs but they're connected over USB 2.0 (old server) and my network is all gigabit. Even if I deleted some media or got another external HDD, my server would be down for so long. srv-host-0-diagnostics-20240422-1818.zip
-
Ended up holding out a bit on uninstalling the patch and a reboot seems to have fixed it for now? I guess we can close this but I'm not 100% what the cause or most effective solution is given it's happened before. But I guess I'll just reboot if it does it again in the future.
-
I'll give it a shot and report back. It may take a day or two to confirm as the apps uninstall at random times.


